Tables serve as carriers for displaying data and can present multiple fields from any data table. Tables can display both detailed data and statistical data. Next, we will introduce how to use the table components.
Adding Components
Drag and drop the
components from the component pane on the left to the canvas area.
Configuring Query Conditions
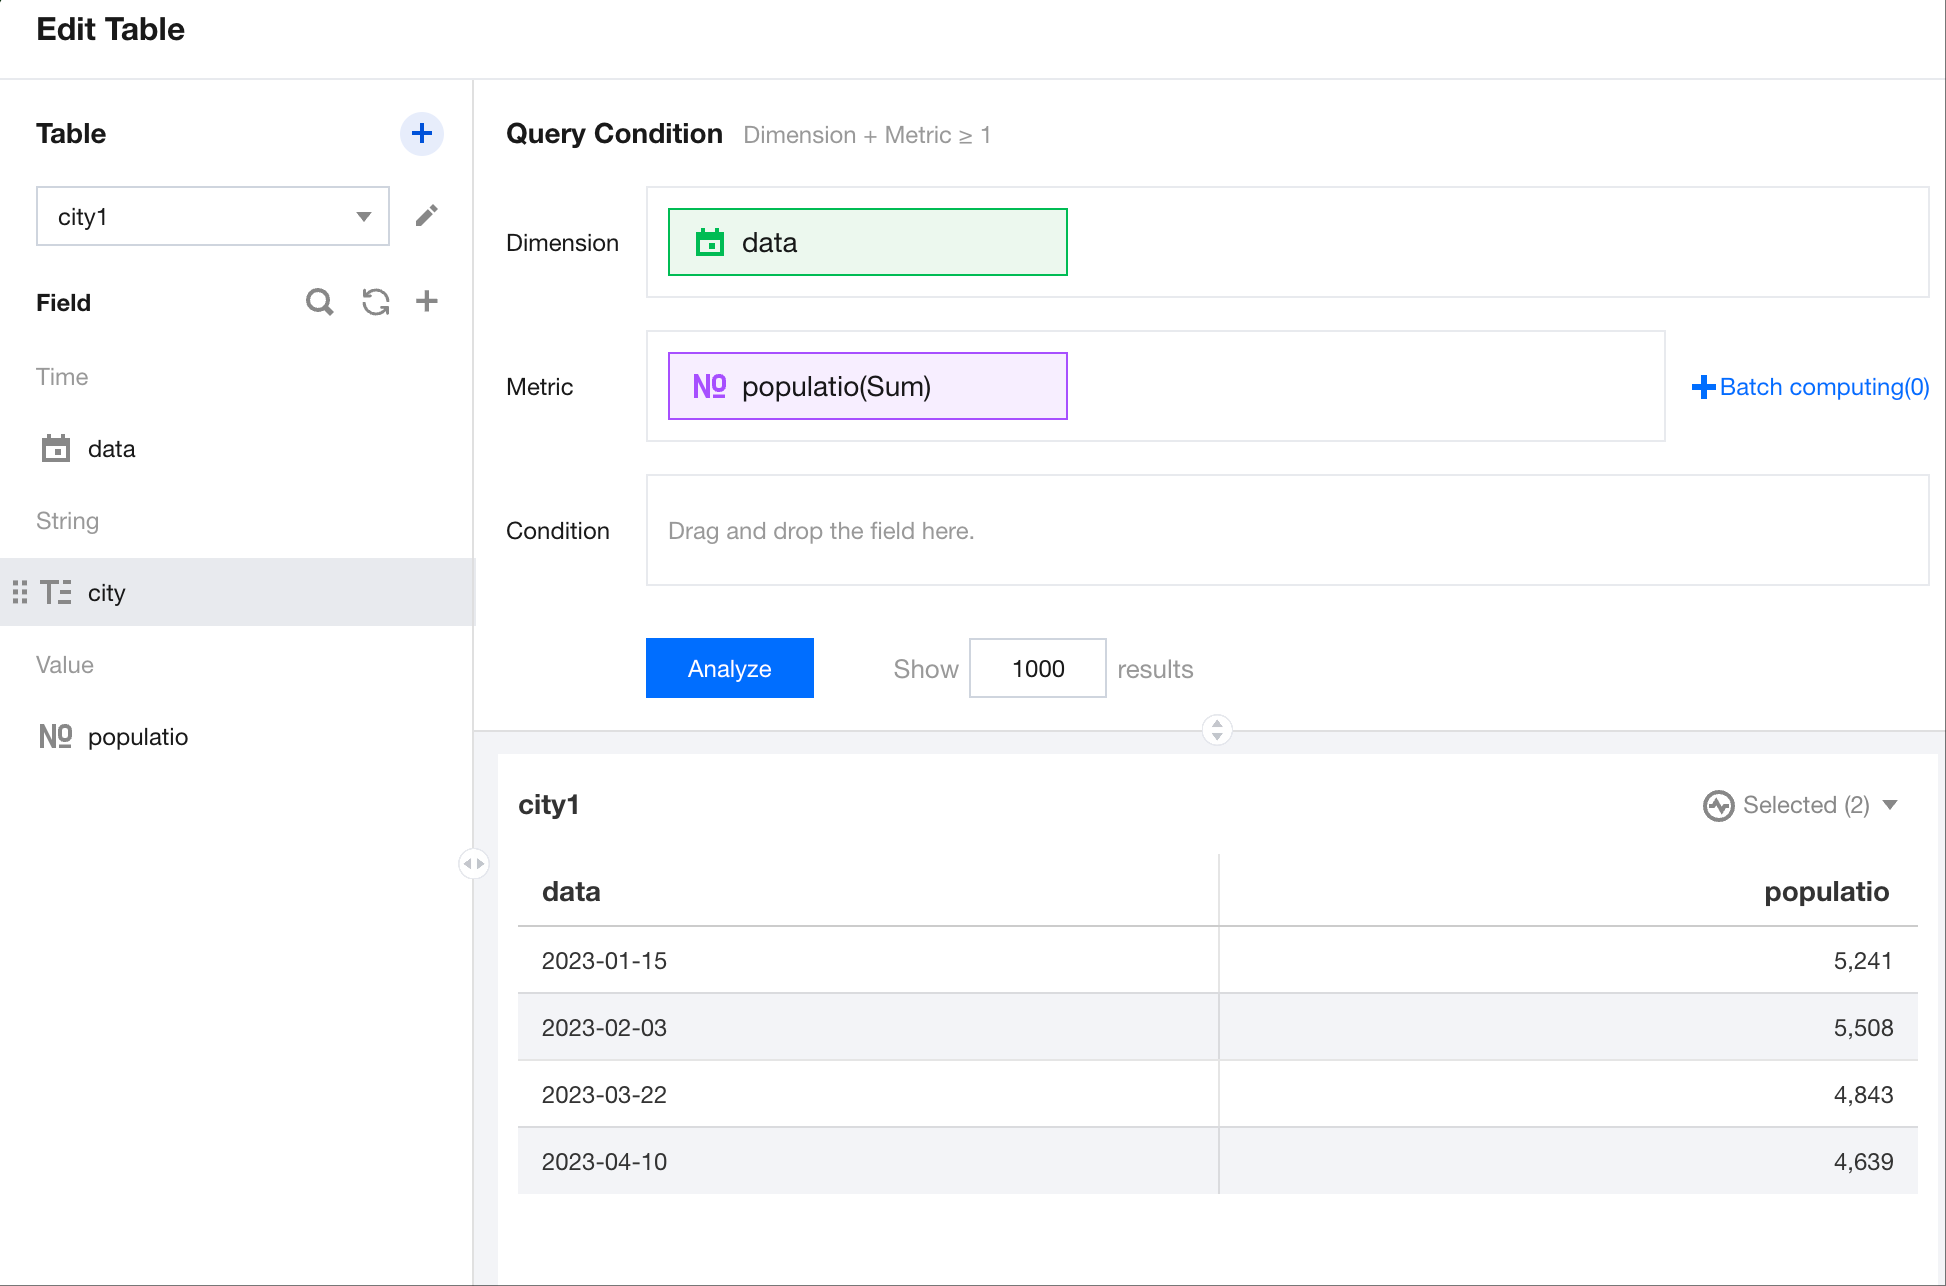
After selecting the data table, drag and drop fields to the dimension and metric areas to generate the following table.