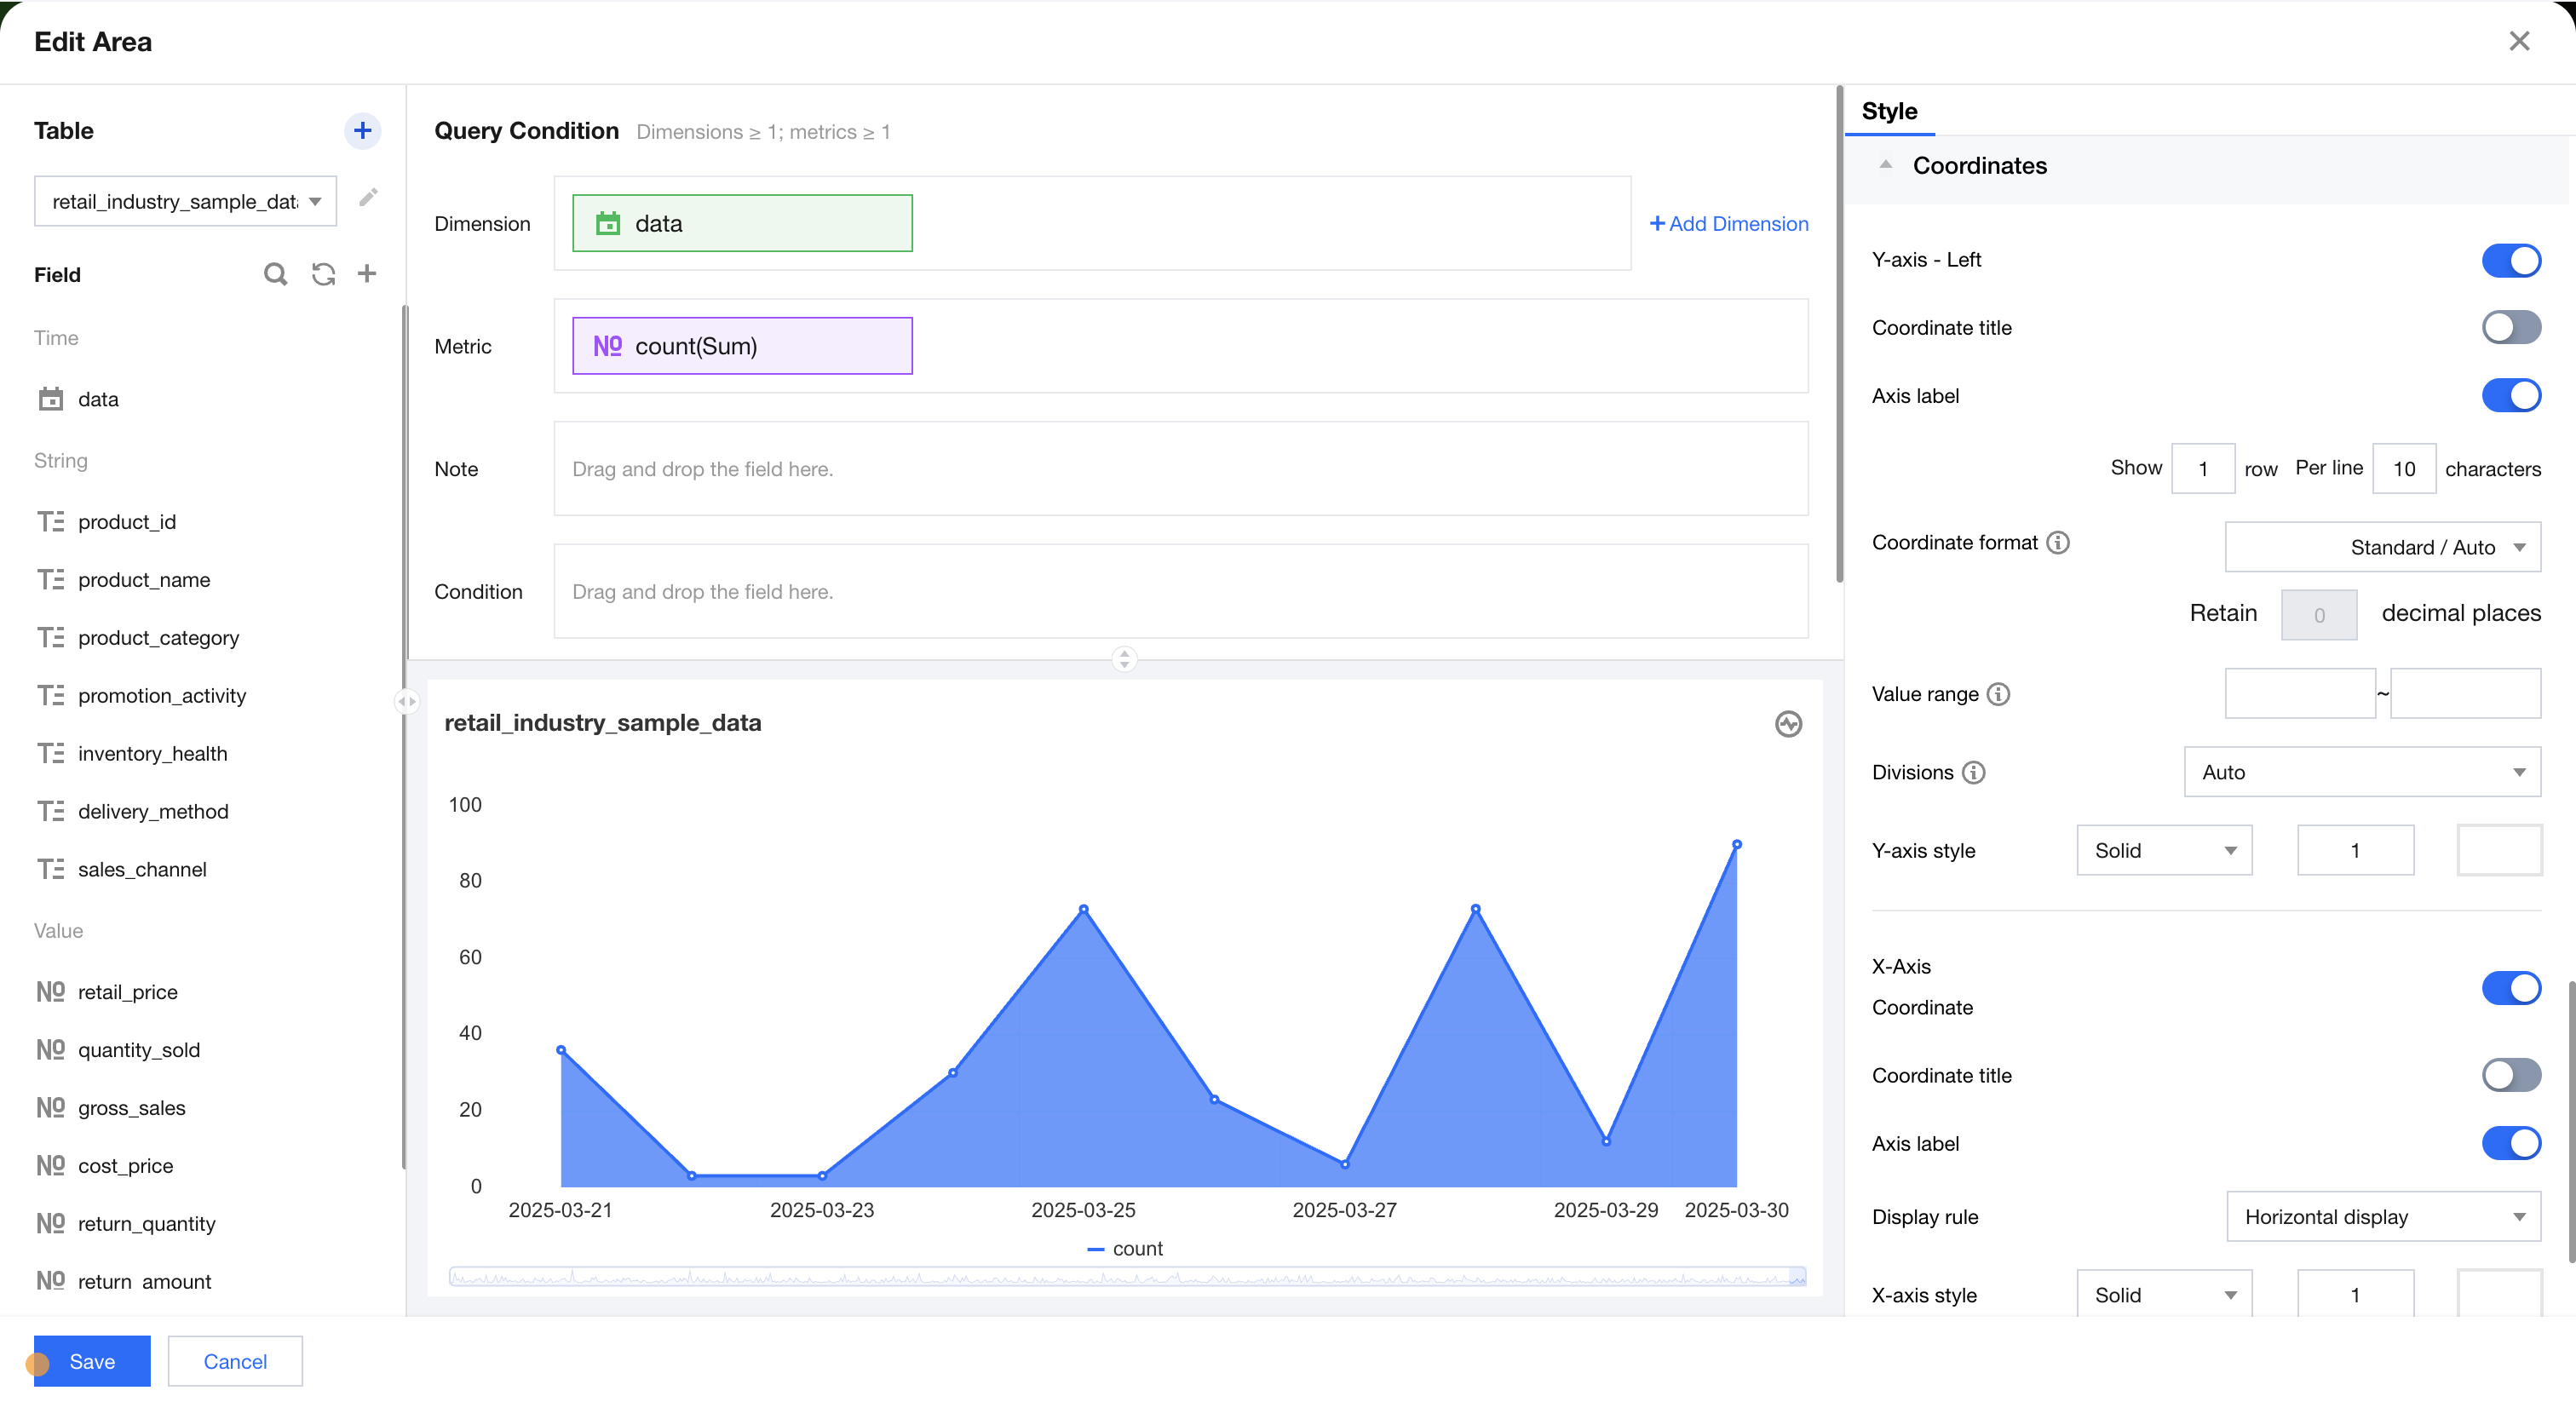
Coordinate axis
Coordinate axis settings support title, axis label, format, interval, and axis style settings.
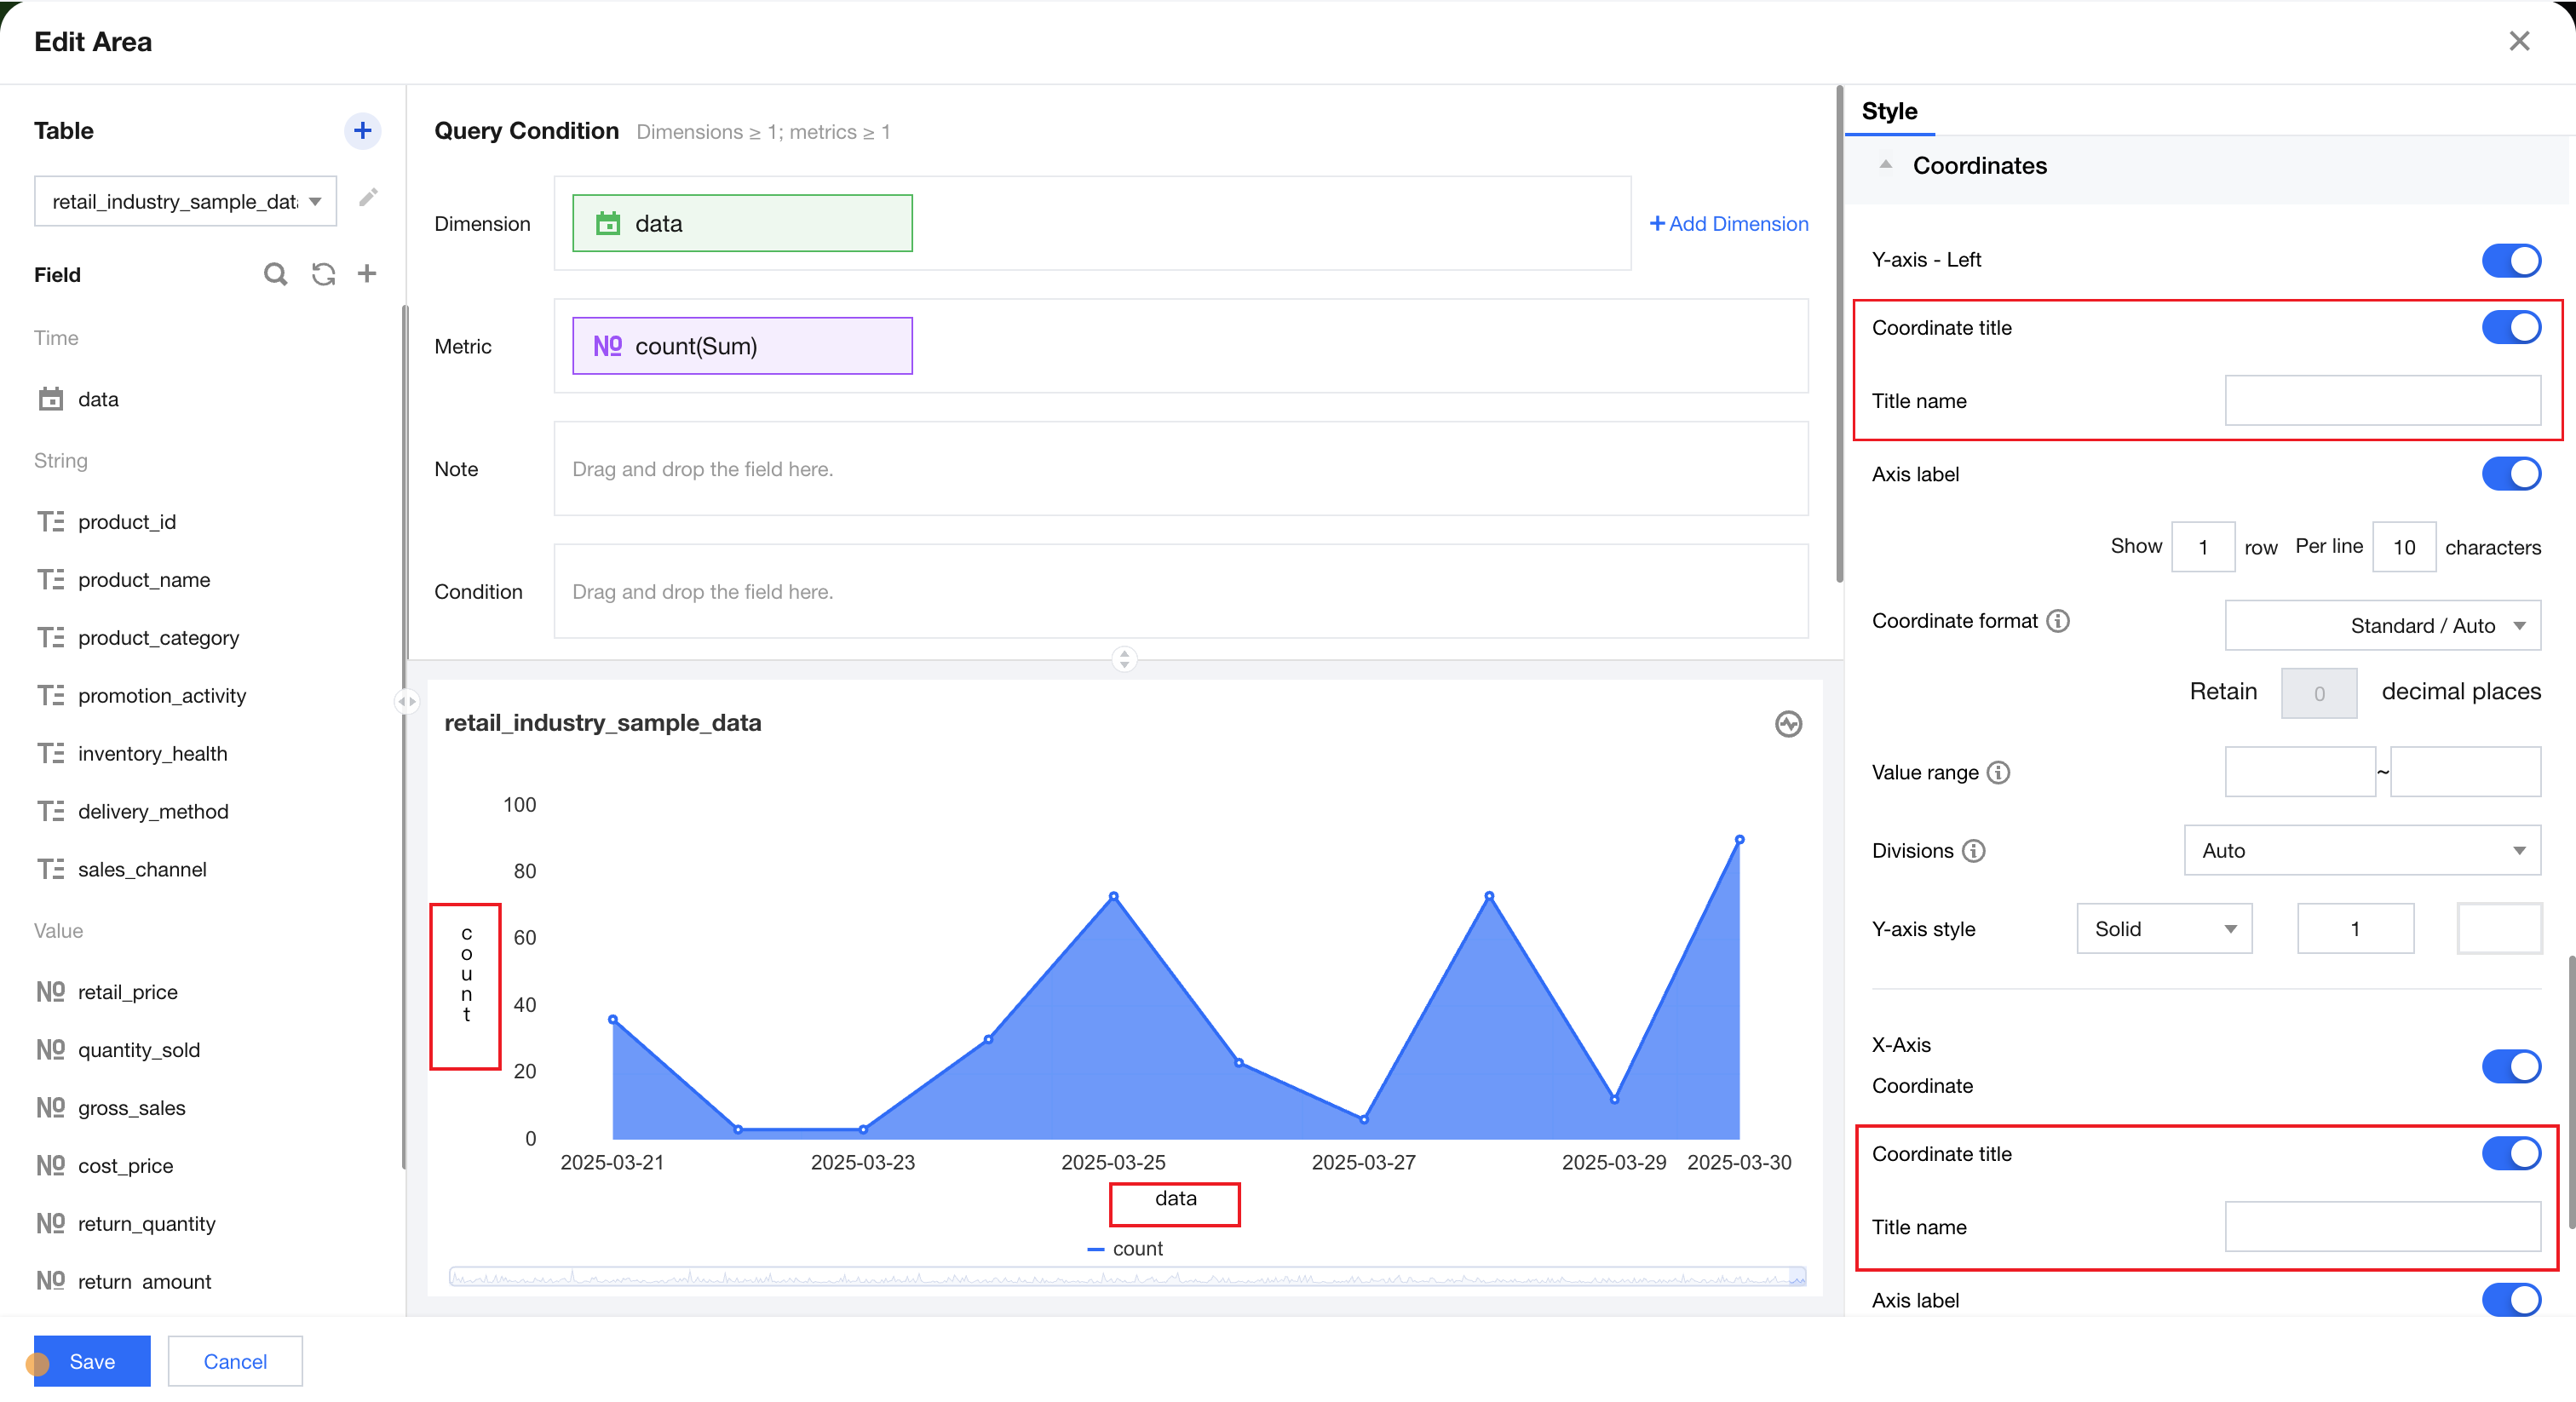
Coordinate Title
Chart coordinate axis titles can be set. A coordinate axis title is descriptive text (such as "Time," "Temperature," or "Sales") that clarifies the data represented by the axis (e.g., X-axis, Y-axis).
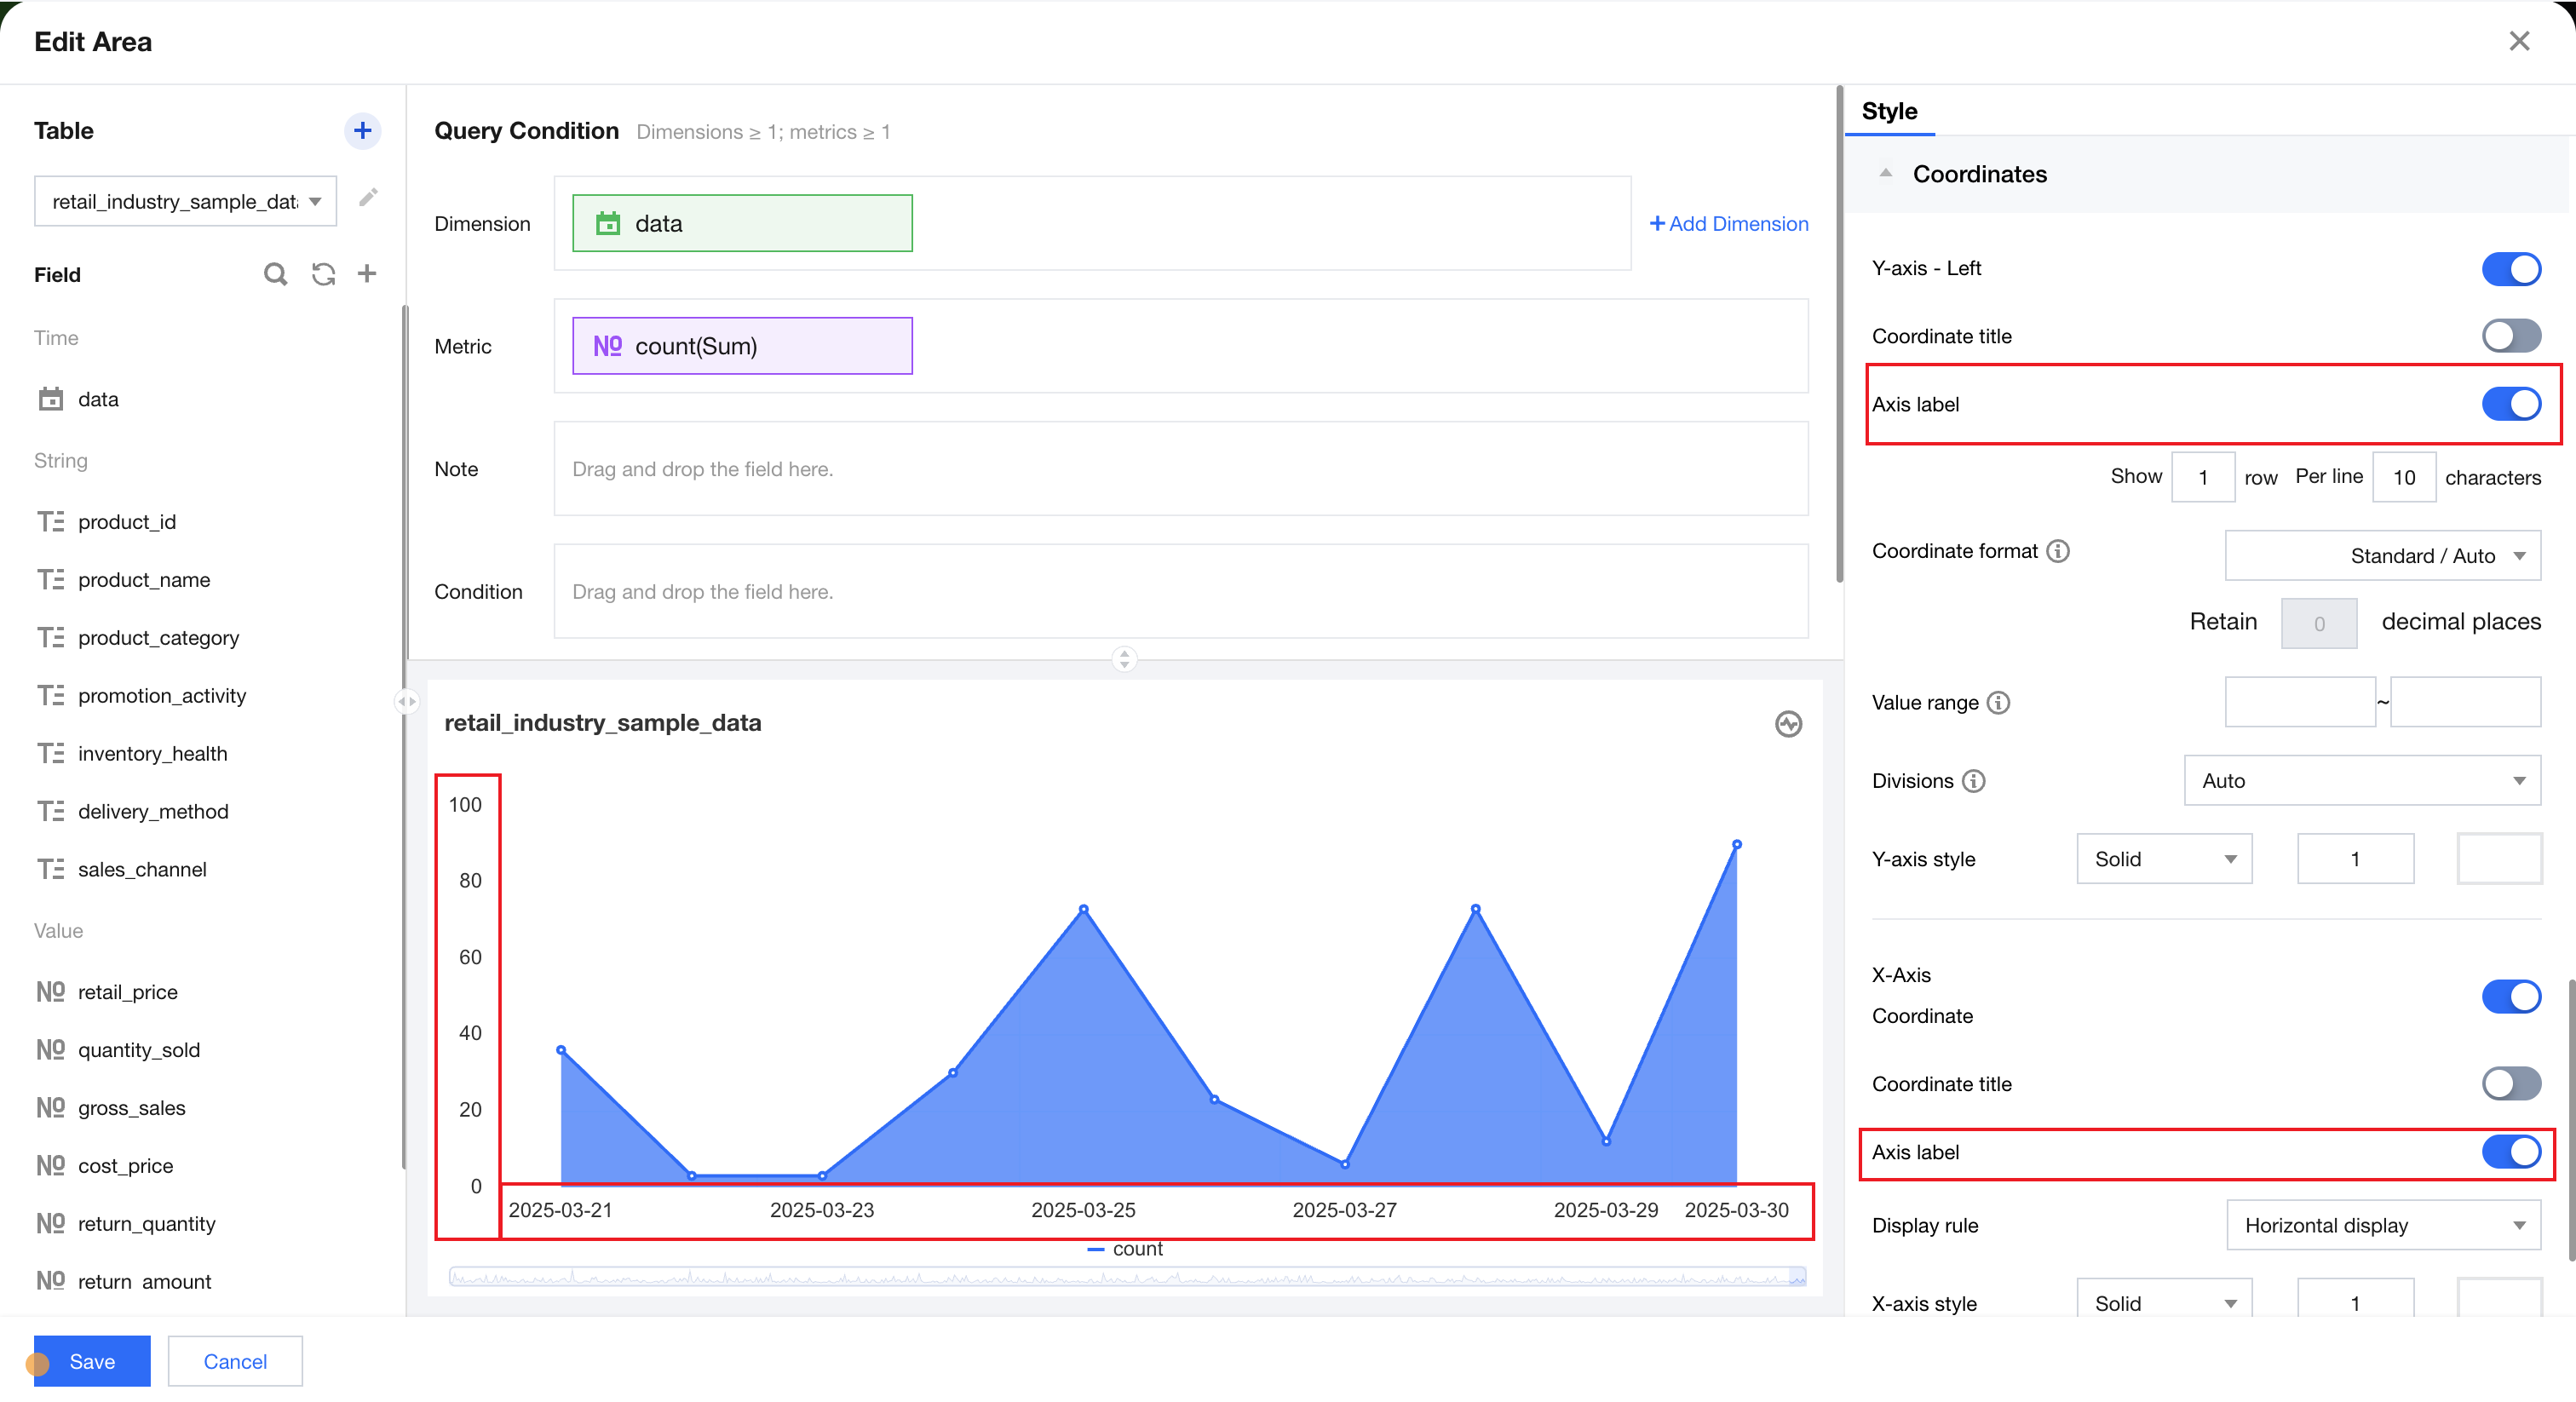
Axis Label
Axis labels can be set for charts. An axis label is a text or numeric value tag corresponding to scale marks on the coordinate axis, used to identify the position, range, or category of the data.
Axis Label Display Rule
Axis label display rules can be adjusted based on chart content. The X-axis supports horizontal display, vertical display, skew display, and customization, while the Y-axis supports customization.
DisplayDisplay Rule> | Coordinate axis | Diagram |
horizontal display | X-axis | 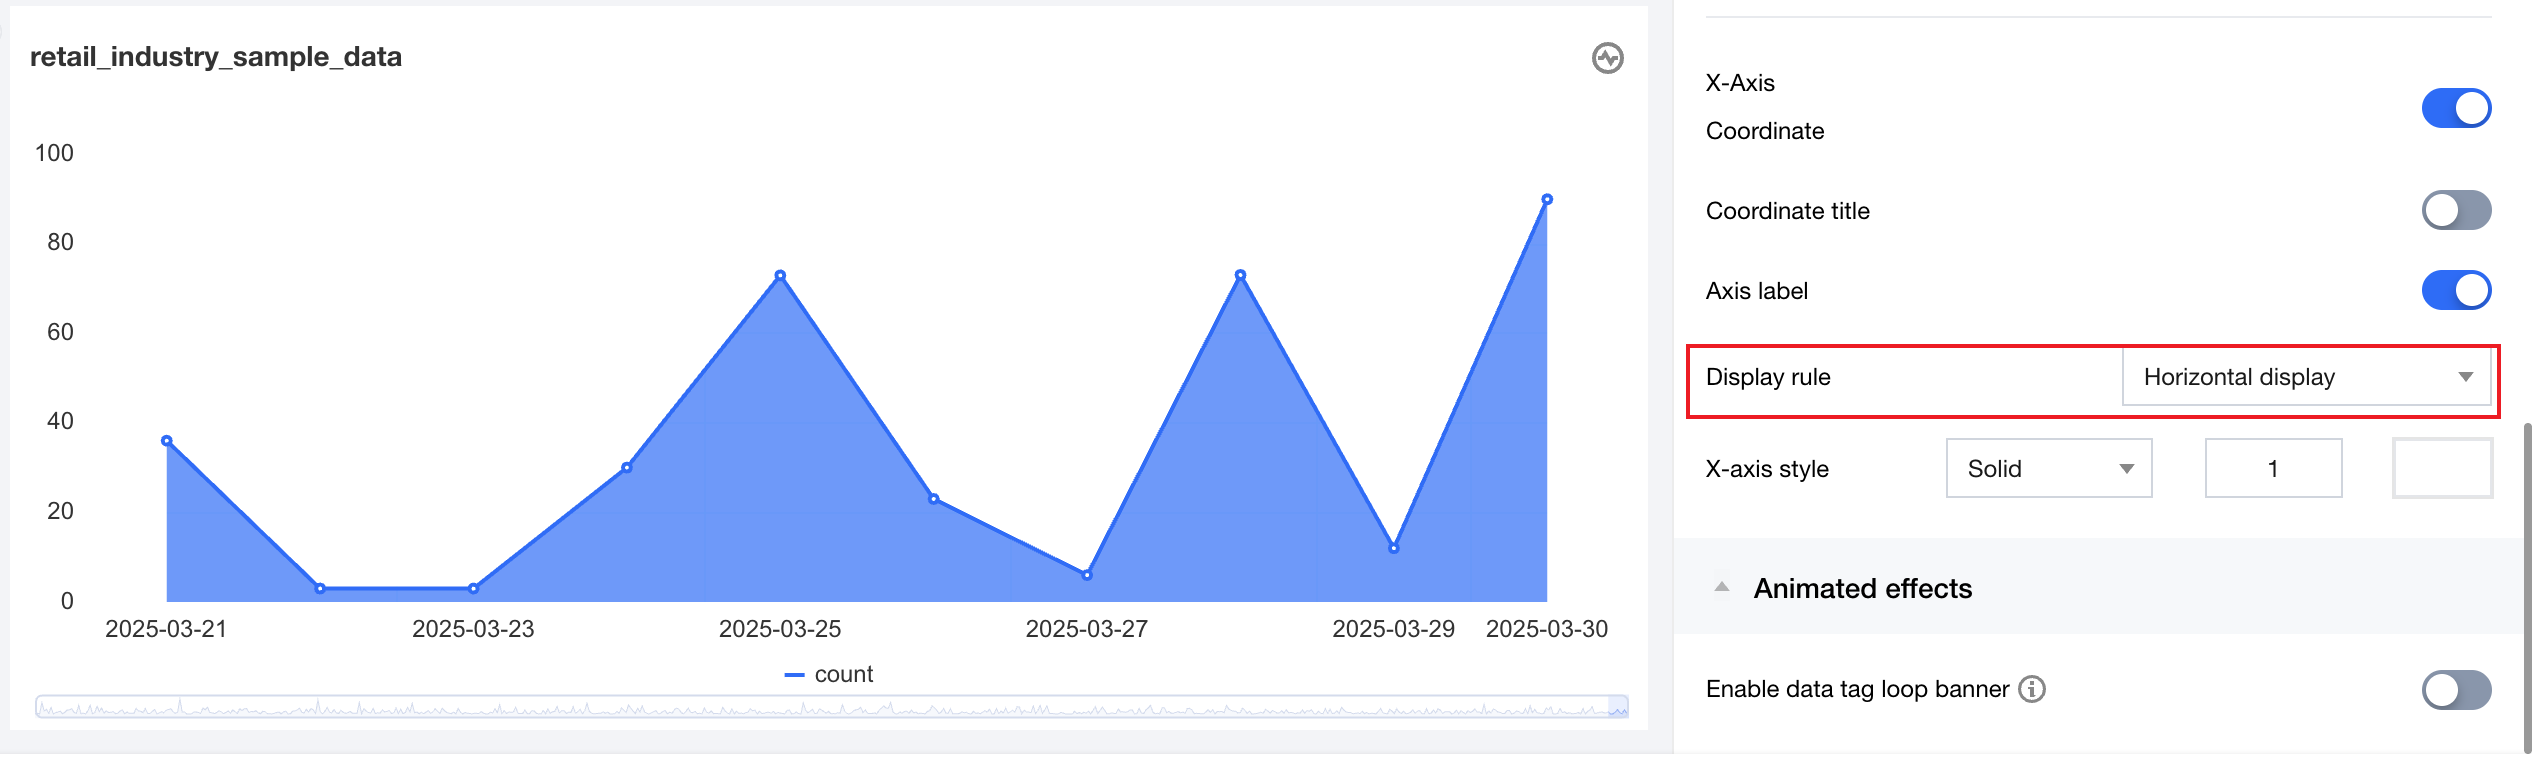 |
vertical display | X-axis | 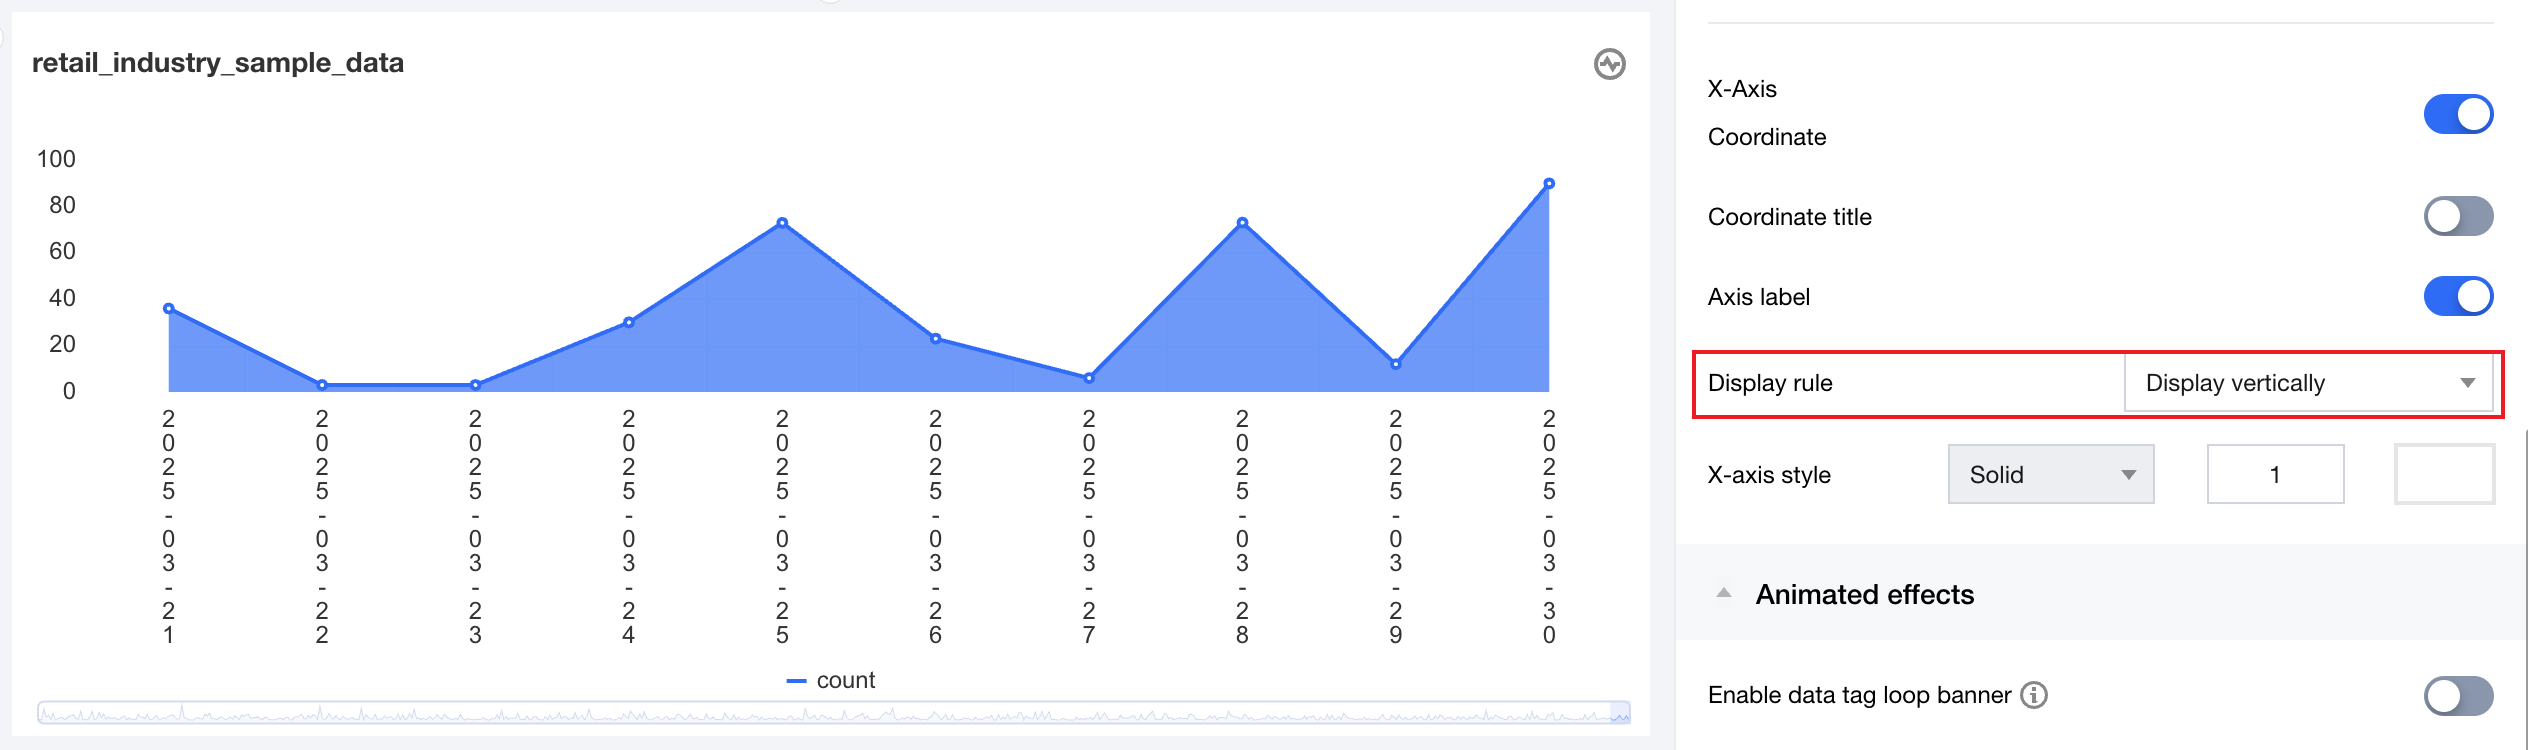 |
skew display | X-axis | 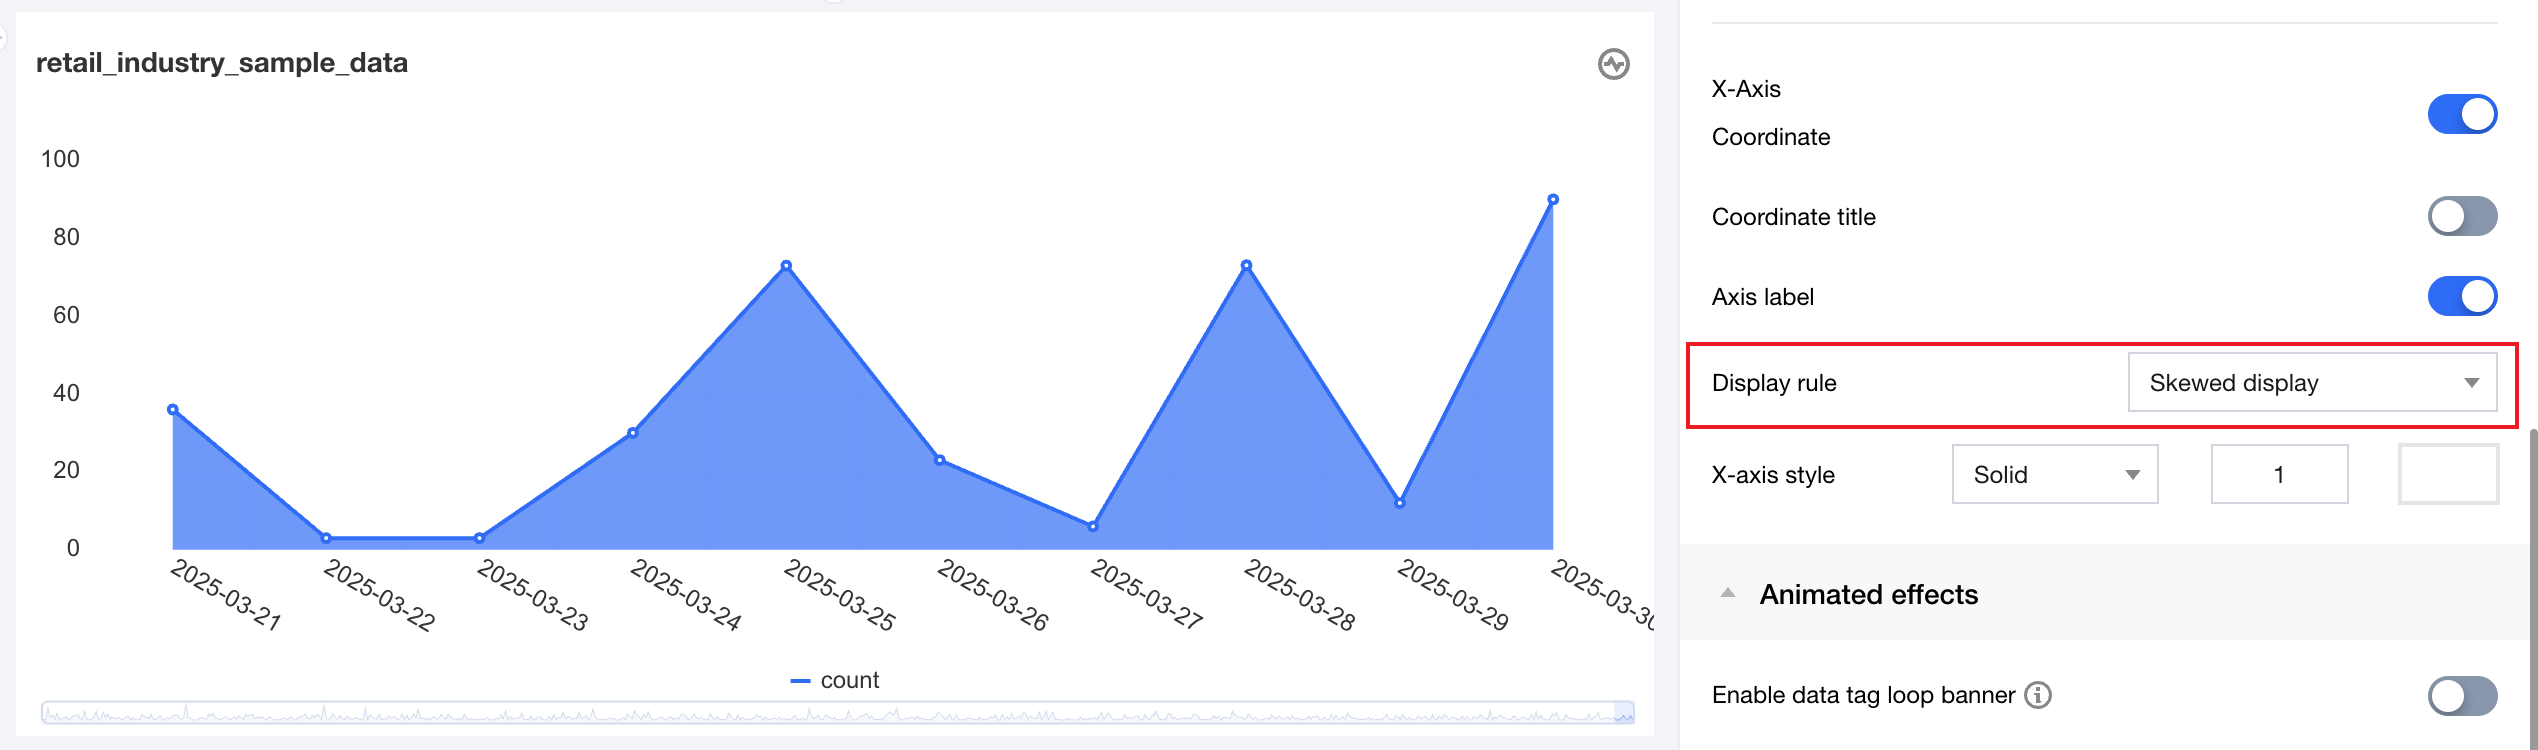 |
Customize display Support customizable tag max line count and word count per line. | X-axis Y-axis | 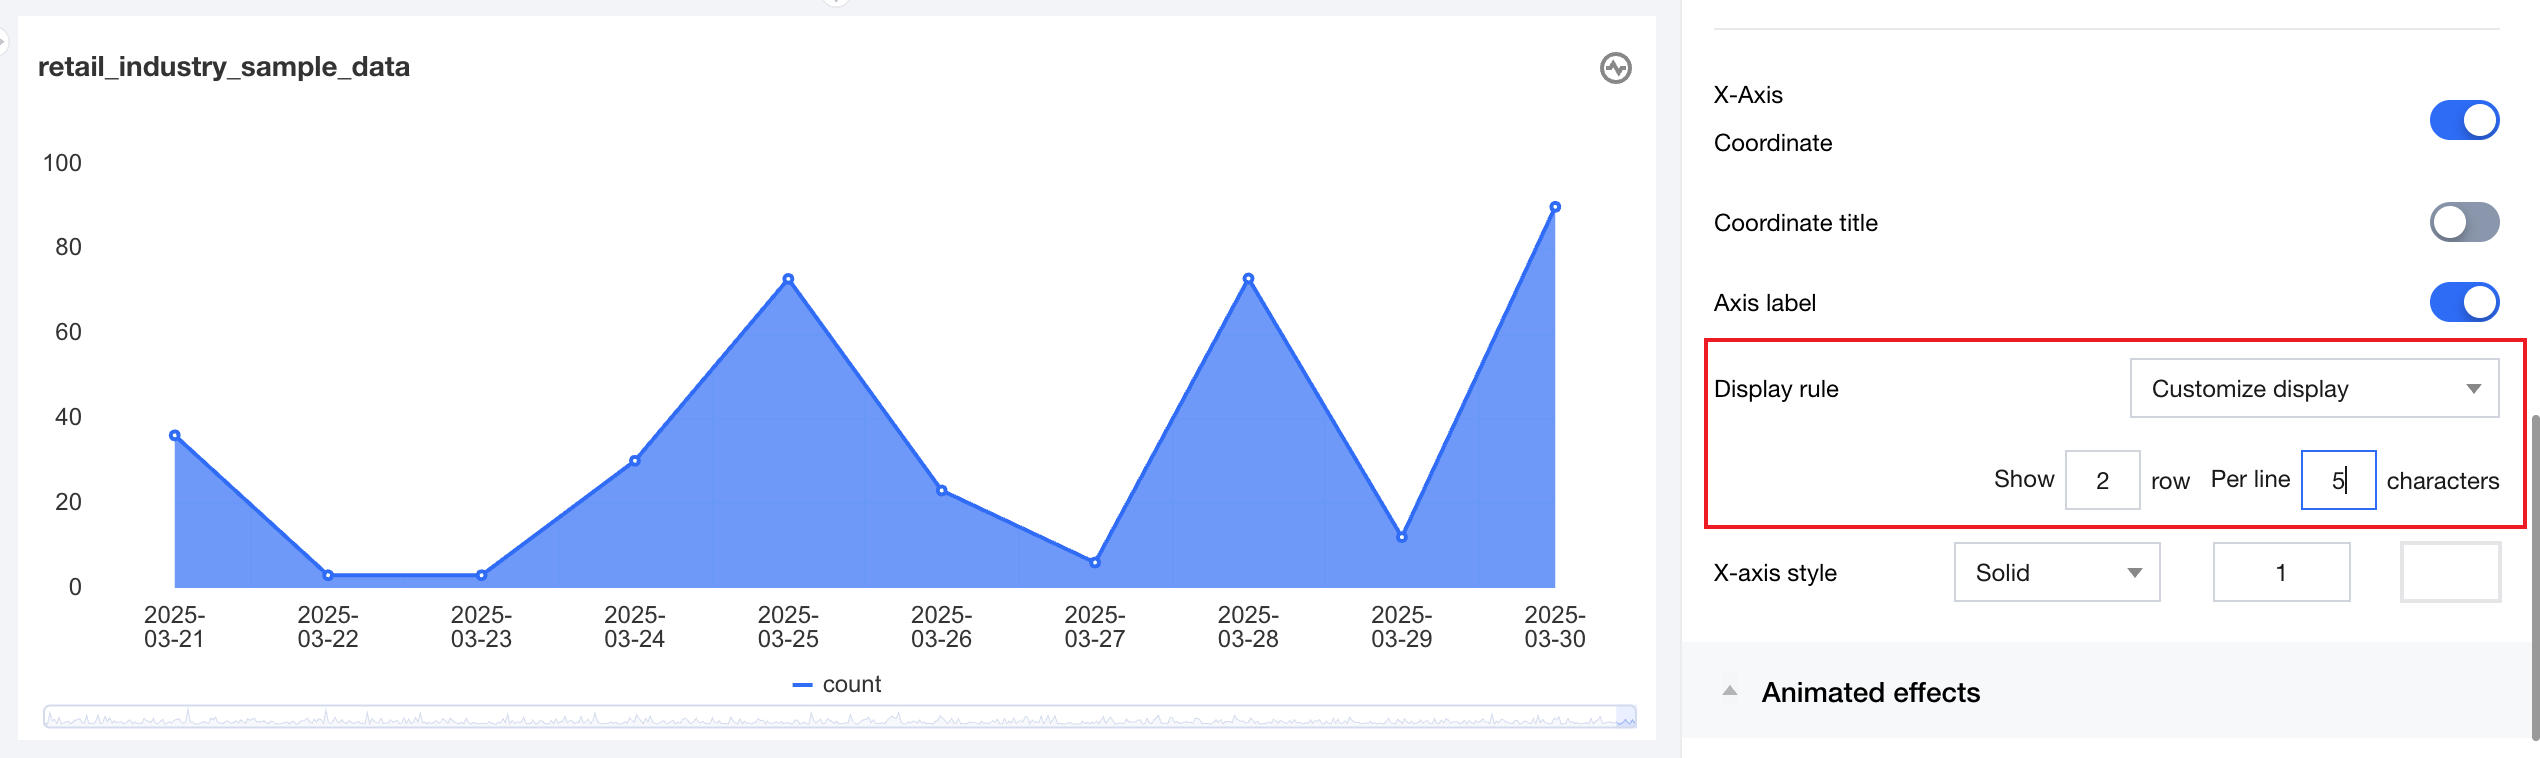 |
Coordinate Format
Coordinate format settings can specify the numeric format for scale display (only effective for numeric scales). Its specific form depends on the scenario and coordinate system type.
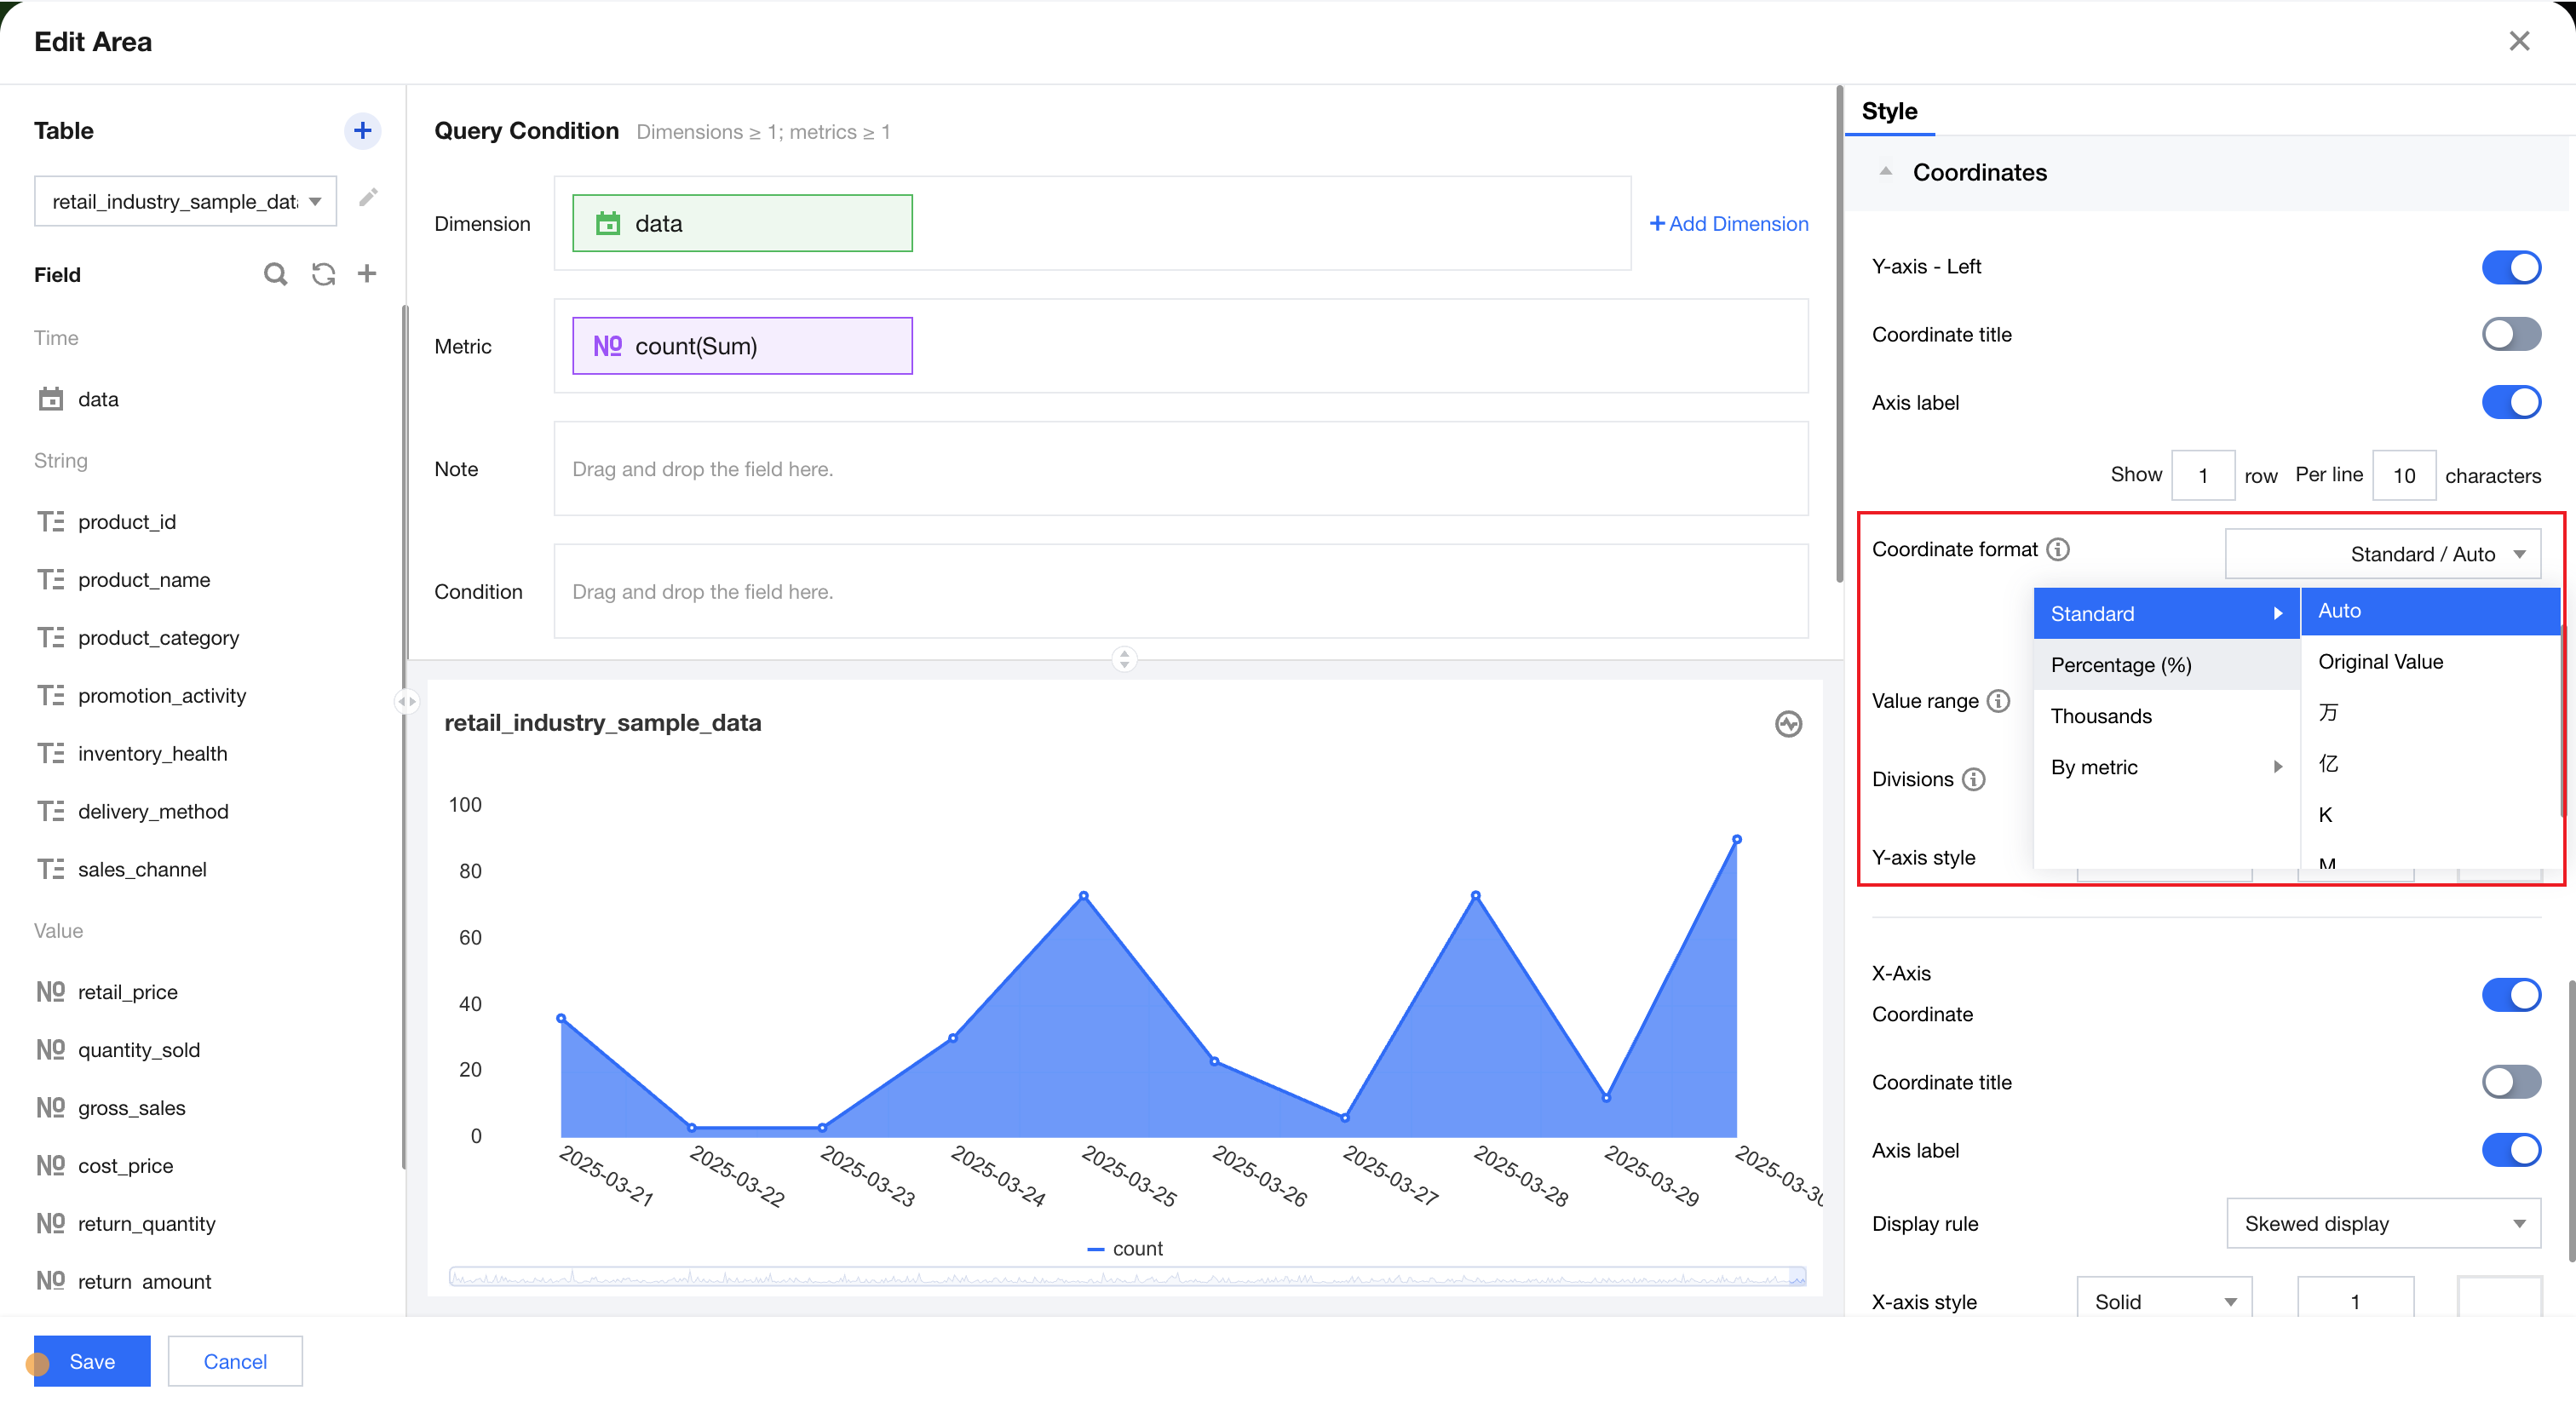
Supports coordinate formats as follows:
Coordinate Format | Description |
standard numerical value | Primarily used for normal value display. Standard numerical value supports English unit or auto unit. When set to auto unit, the value unit will switch automatically based on the value size. Manual configuration of decimal places is no longer supported. For example: values 120 and 456721 will display as 120 and 456.7k in auto mode. |
Percentage | Mainly used to intuitively display the proportion of values. When the coordinate format is percentage, decimal places can be set. |
Thousand separator | Primarily used for large value representation. Using a thousand separator can significantly improve data readability and accuracy. For example: the value 123456789 will display as 123,456,789 in thousand separator format. |
as Metric | The coordinate format should be consistent with the numeric display format of the metric. For example, if Metric A is set to percentage format, the Y-axis coordinate will also display as a percentage when set to "Follow Metric A." |
When the coordinate format is a standard numerical value, the coordinate unit supports Chinese and English or auto unit, as follows:
Note: When the maximum and minimum values of the data differ greatly, it is recommended to use automatic unit conversion. If a fixed unit is used, the numeric display of the minimum and maximum values after conversion may not match expectations. For example: Department A income is 100, Department B income is 1 million. When the fixed unit is set to "million," the minimum value (A) will display as 0 million after conversion.
Unit | Description |
Auto | The automatic setting of the unit format is normally based on data range, user configuration, and built-in rules to automatically select the appropriate unit. |
Chinese Units | Supports units in ten thousand and hundred million. |
English unit | Supports K, M, B units. |
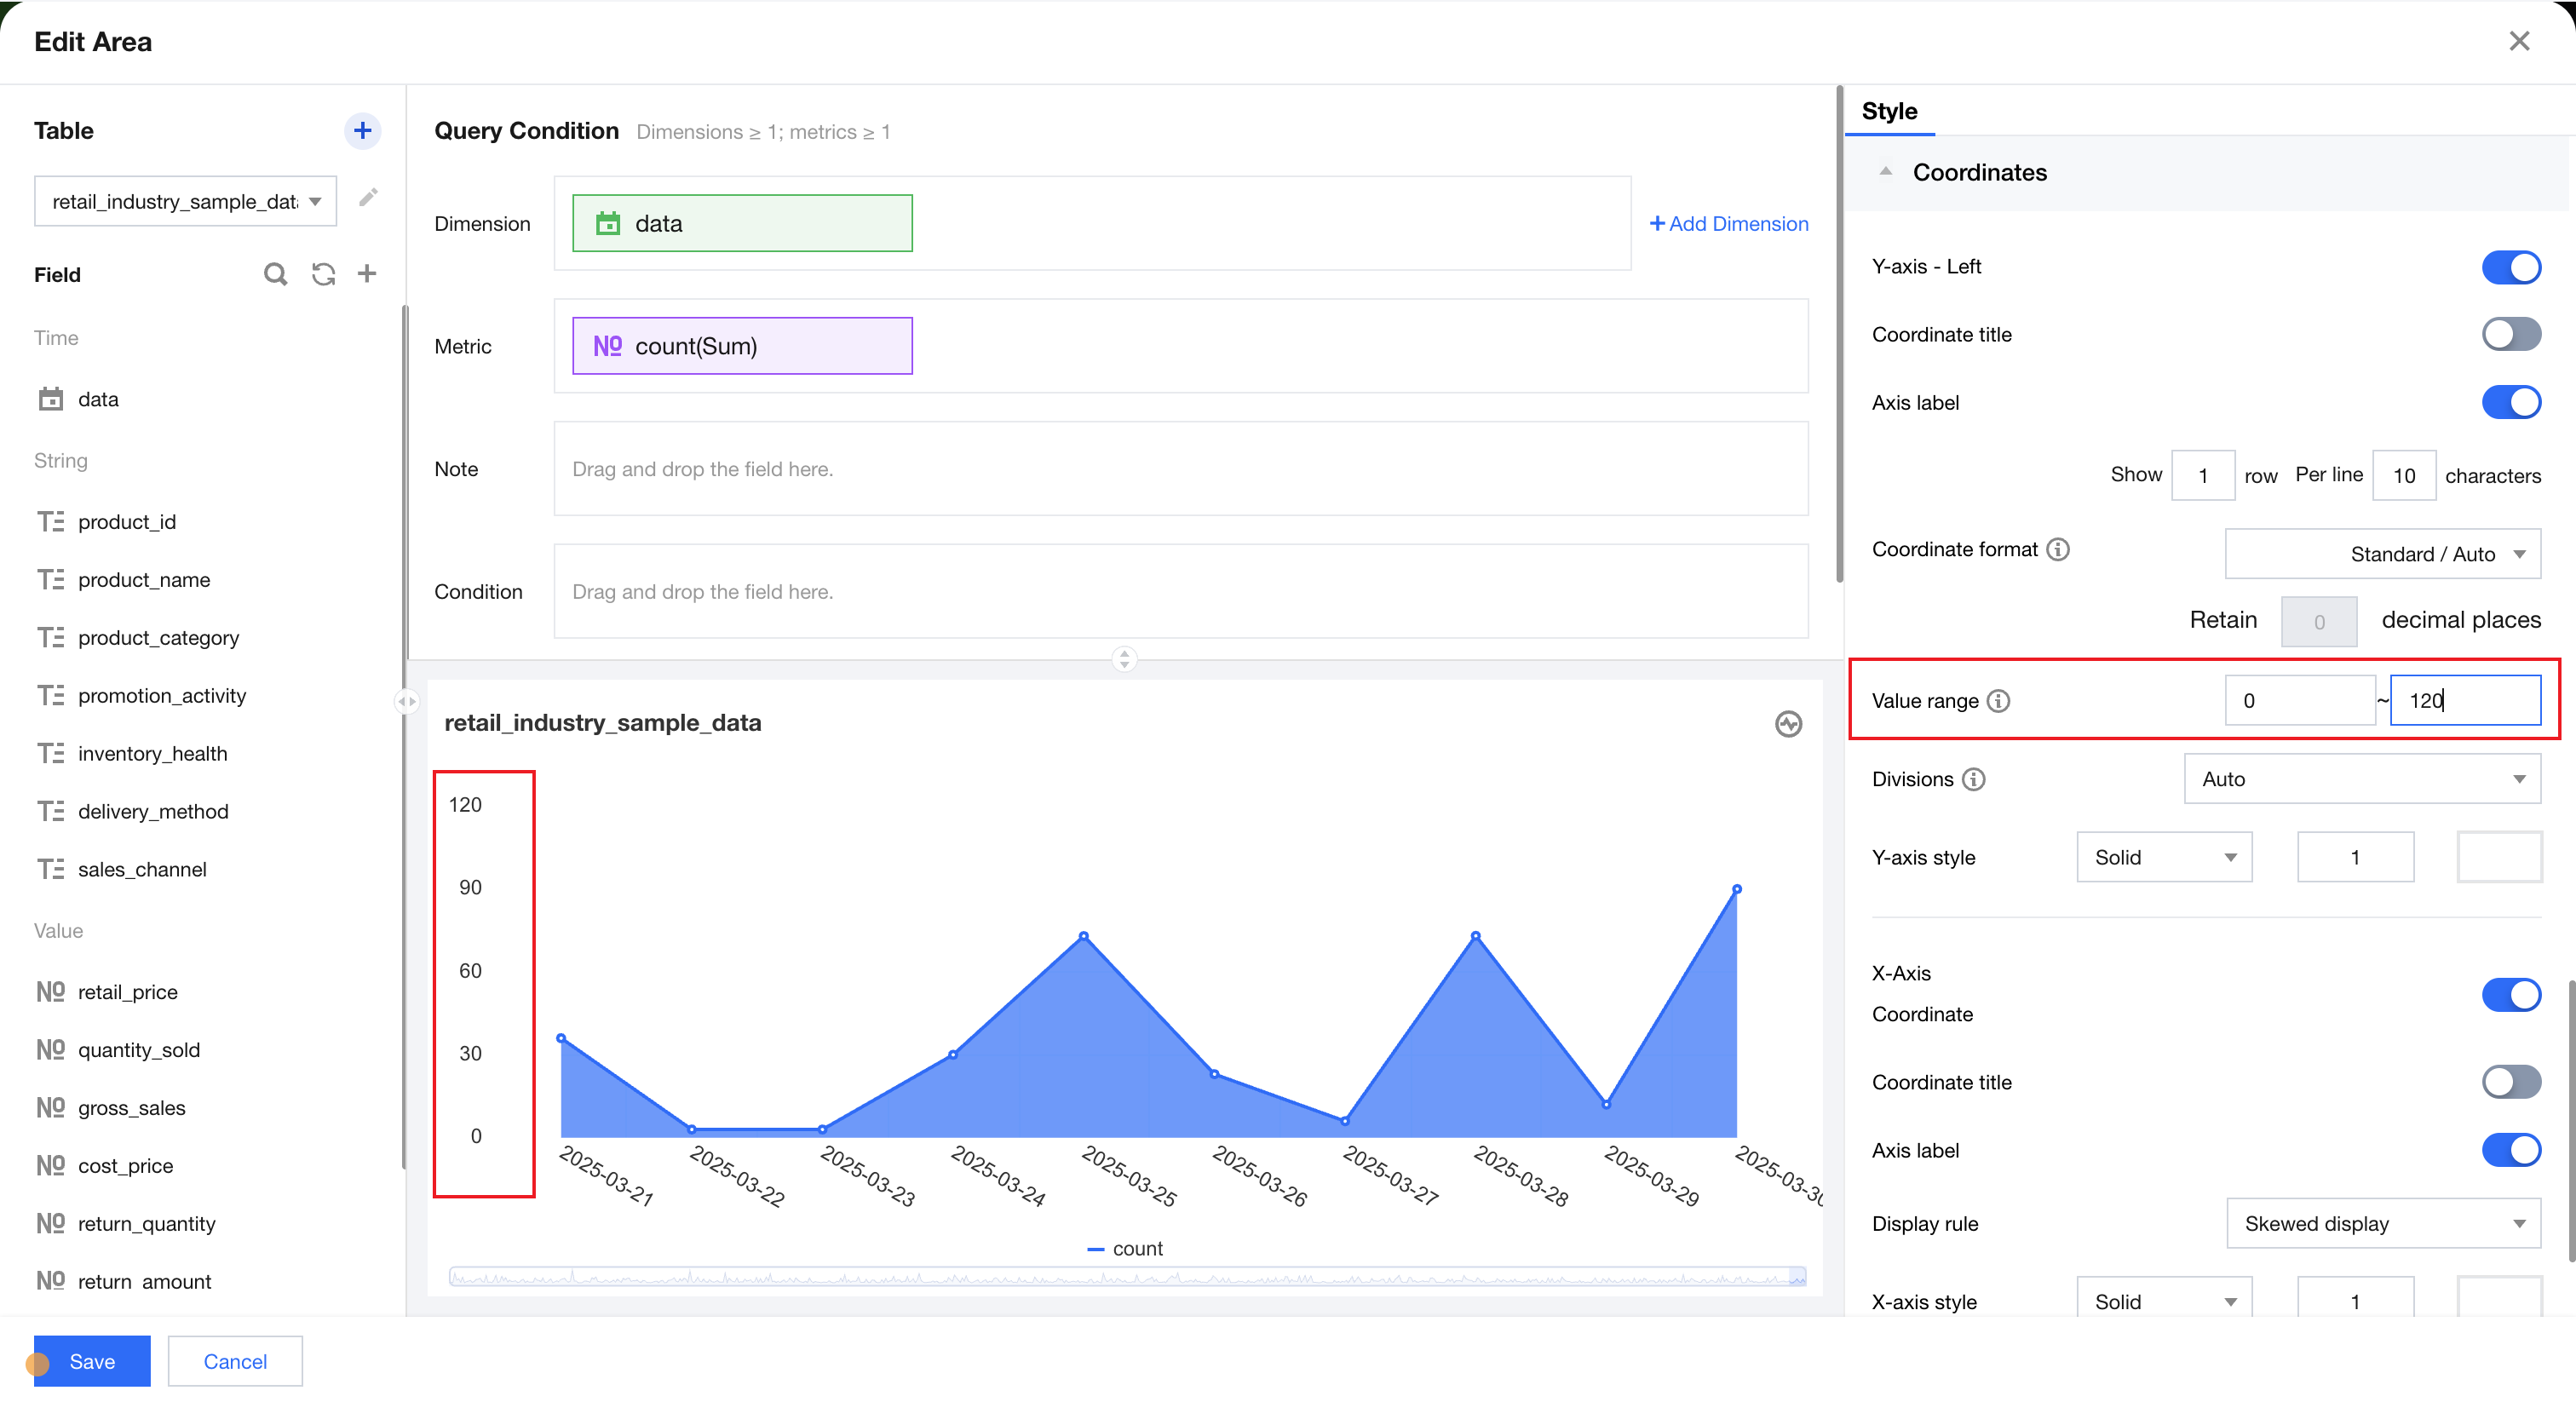
Coordinate Value Interval
The chart automatically configures the coordinate value interval based on current data by default. You can also set the minimum and maximum values of the coordinate interval manually. Data exceeding the set interval will not be displayed.
Note: In special scenarios, you can manually set the coordinate value interval to resize the comparison display of data. For example, when data ranges between 6 million and 8 million, and the coordinate axis interval is set to 0-8 million, the value difference may not be clear in the chart. You can set the coordinate axis interval to 6-8 million to enlarge the difference between values, making it easy to identify numerical variations.
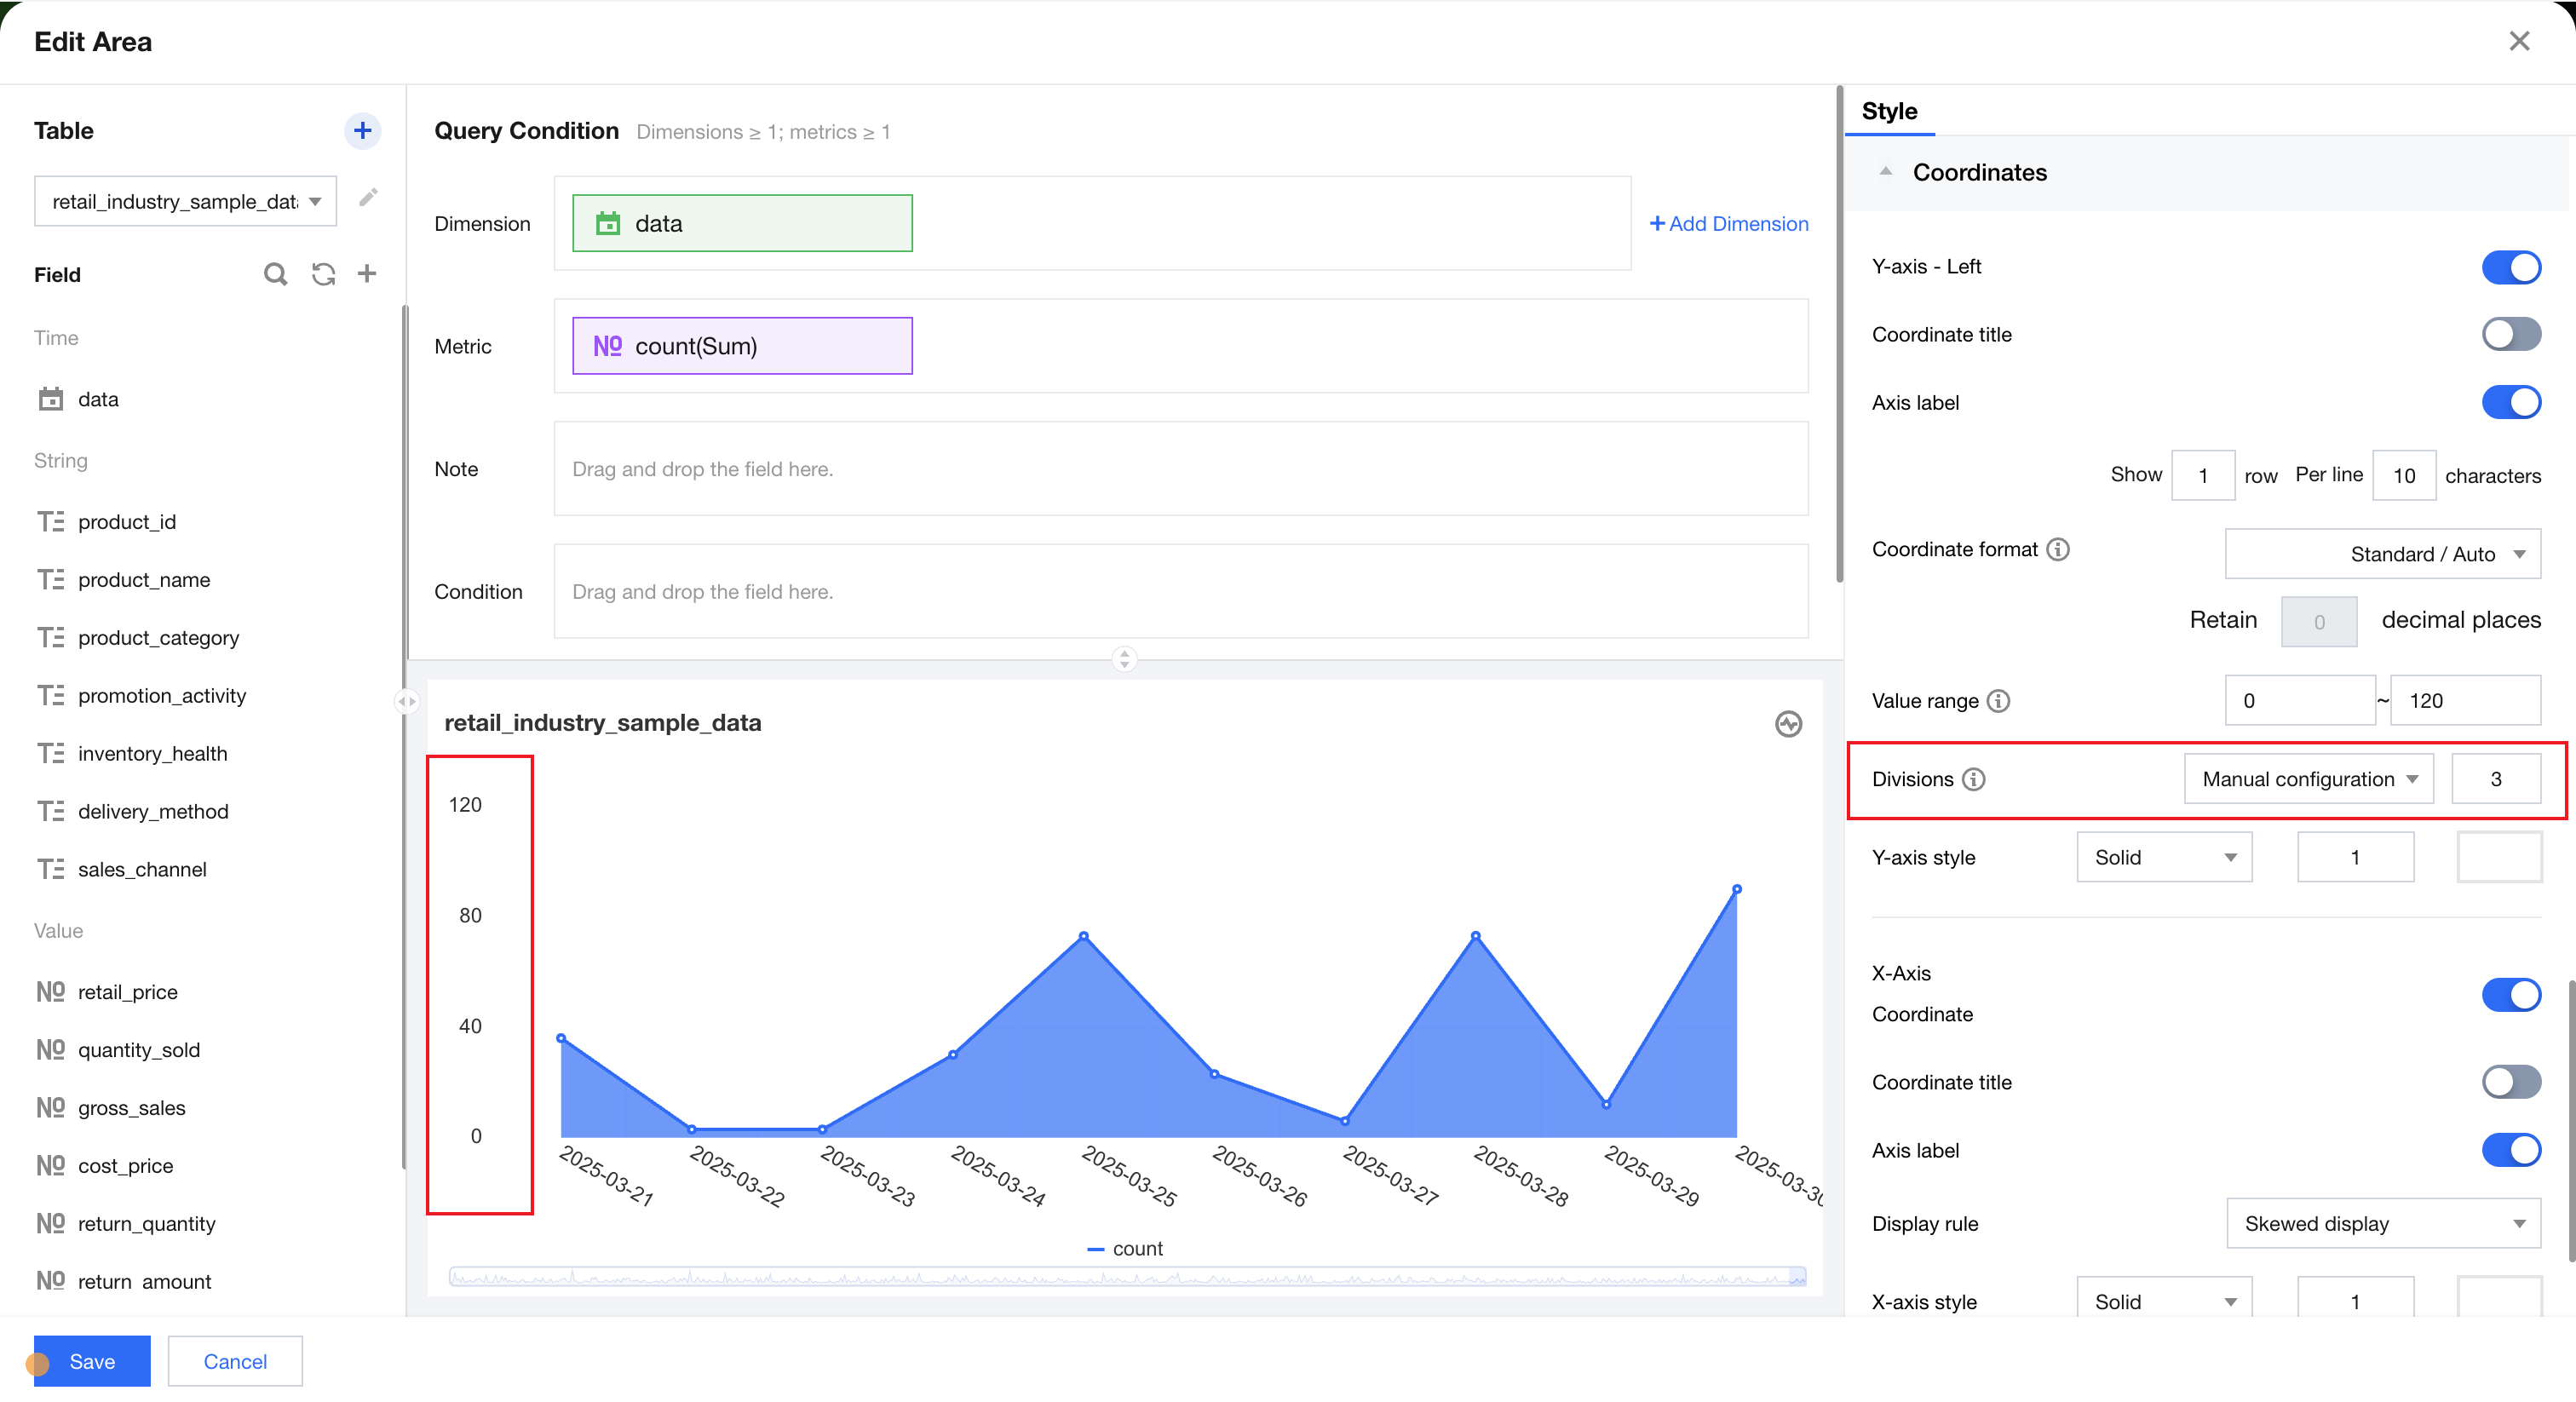
Number of Intervals
The chart sets a reasonable number of intervals based on current data and the coordinate value interval by default. You can also set the number of intervals manually. When the data range is not divisible by the manually set intervals or extreme values interfere, the actual number of intervals displayed may differ from the manual settings.
Axis Style
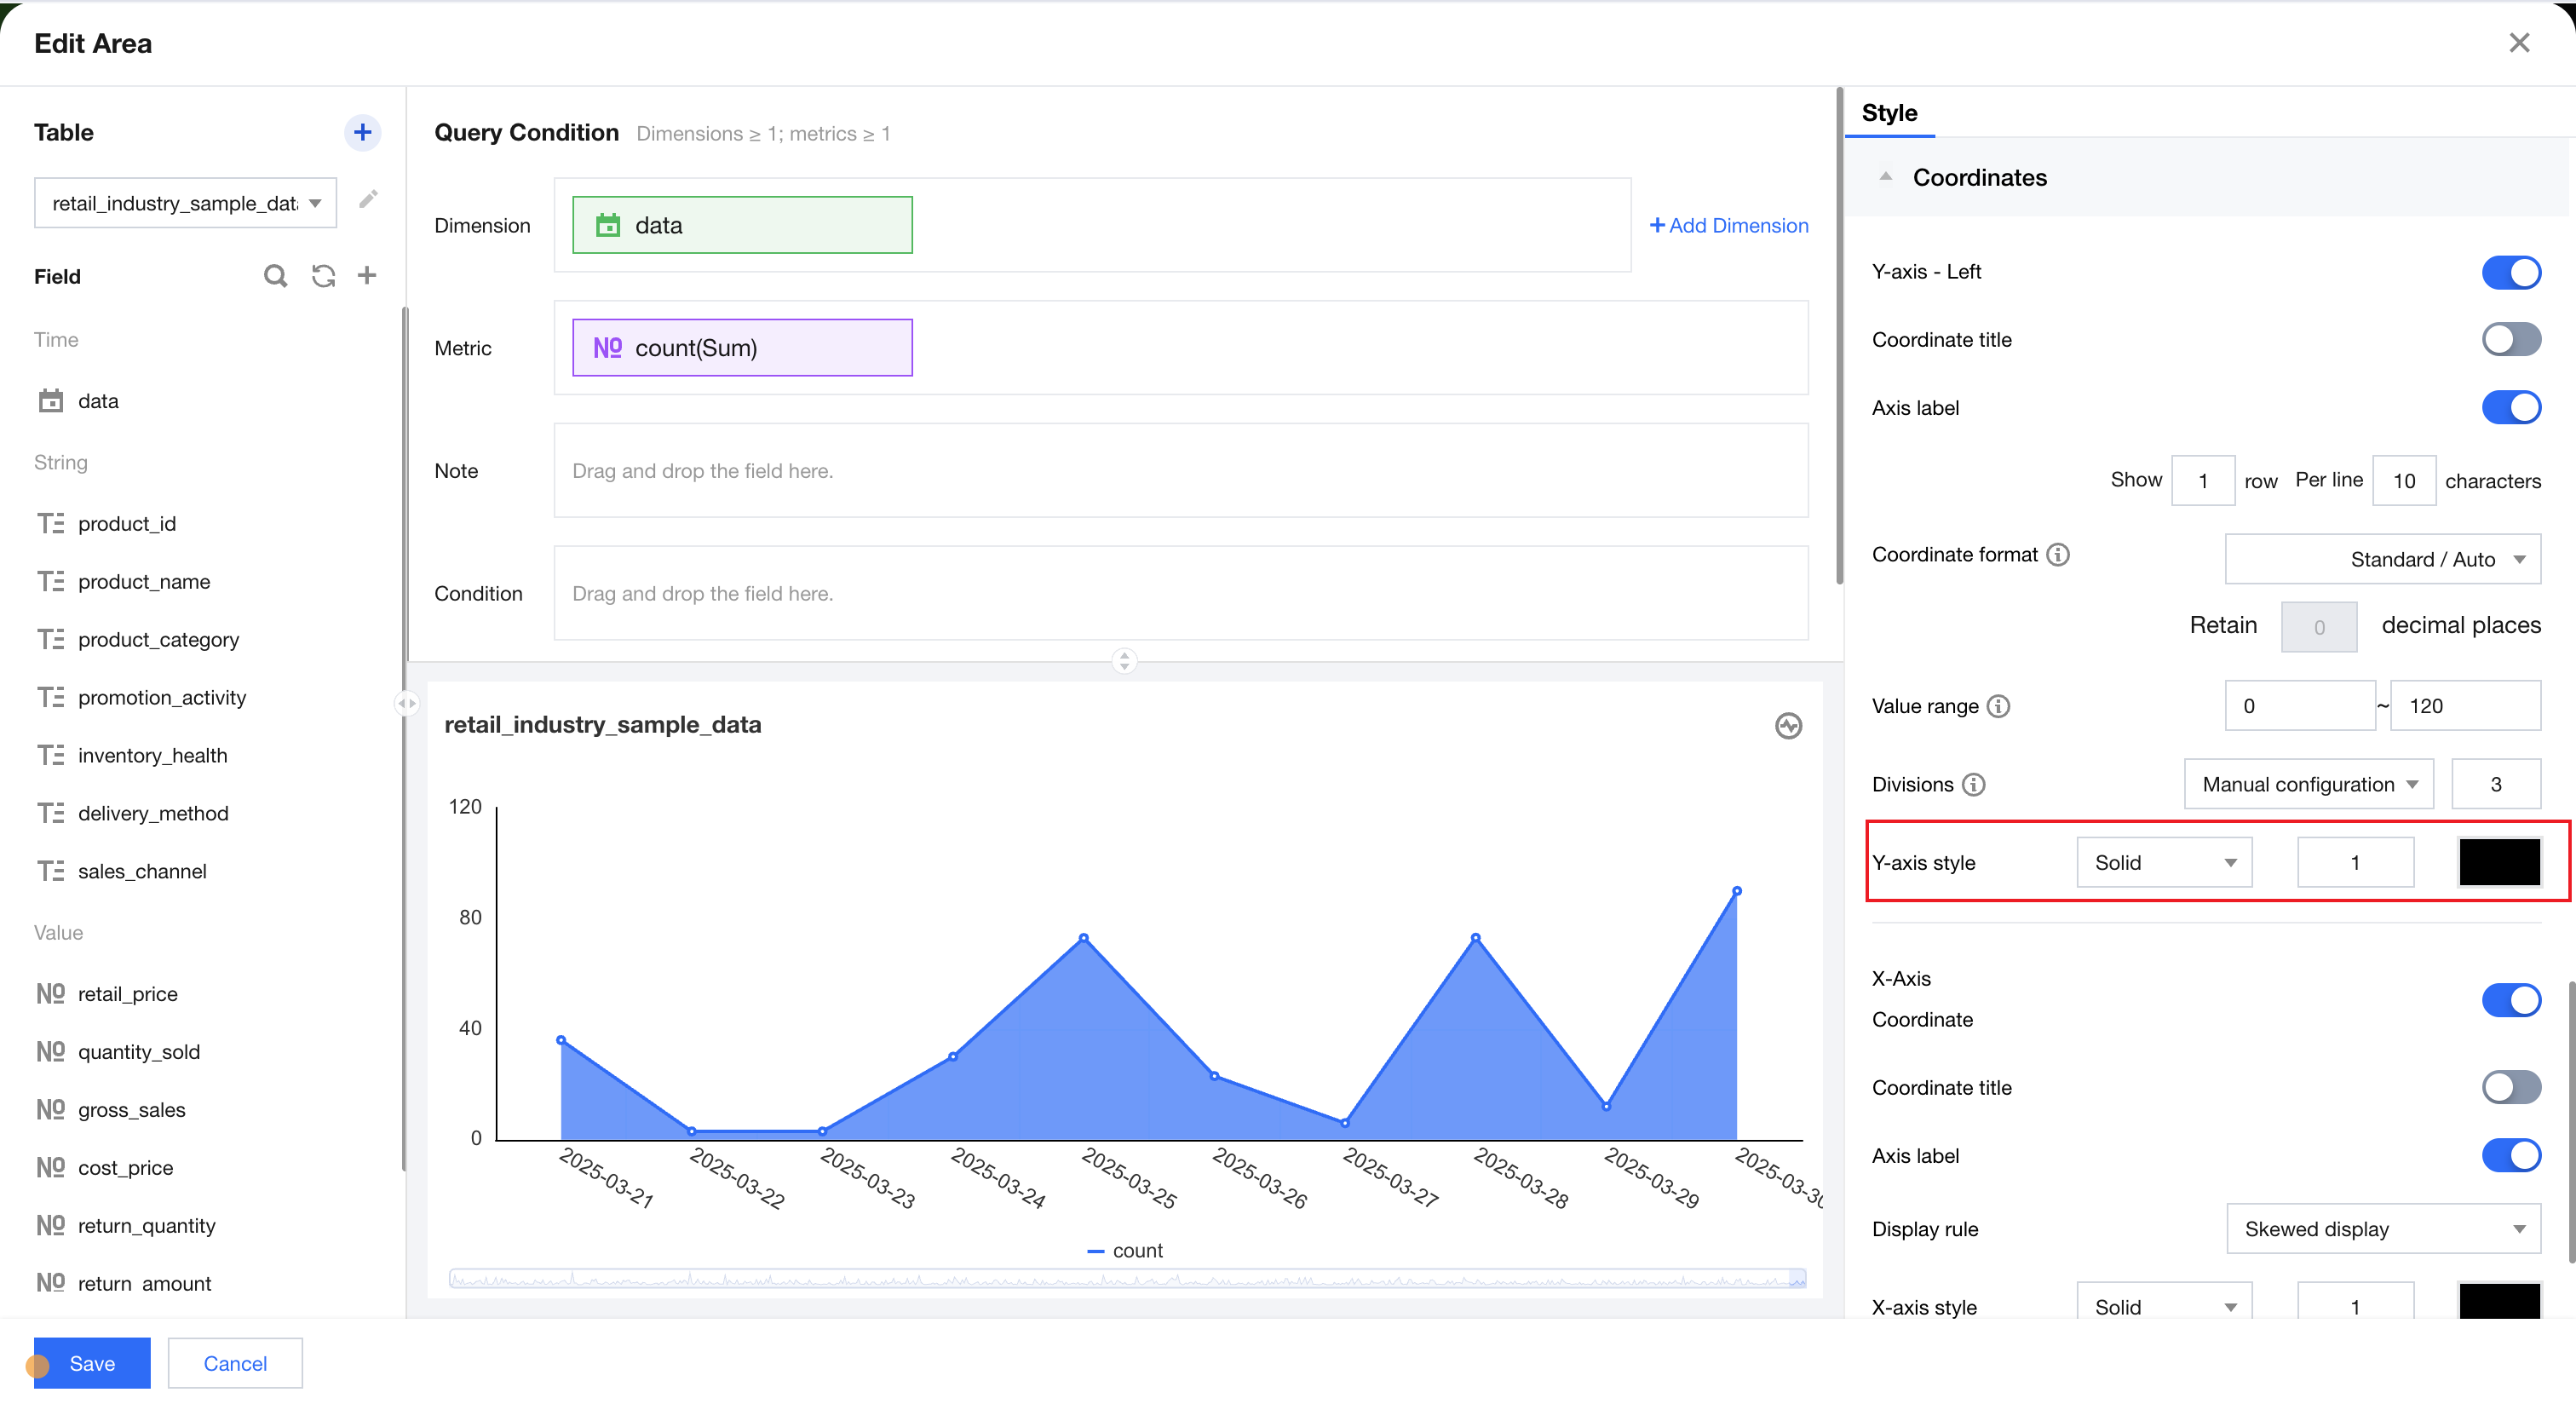
Settings | Settings Description |
axis style | Line type: support solid and dashed line. Line width: Allows setting axis thickness. Axis color: Supports setting axis color and transparency. |
Help and Support
Was this page helpful?
You can also Contact sales or Submit a Ticket for help.
Help us improve! Rate your documentation experience in 5 mins.
Feedback