Bar Charts
This document describes the use cases and operations directions of bar charts.
Use Cases
Bar chart: is applicable to the comparison between metrics in each statistical period.
Configuration effects of bar charts: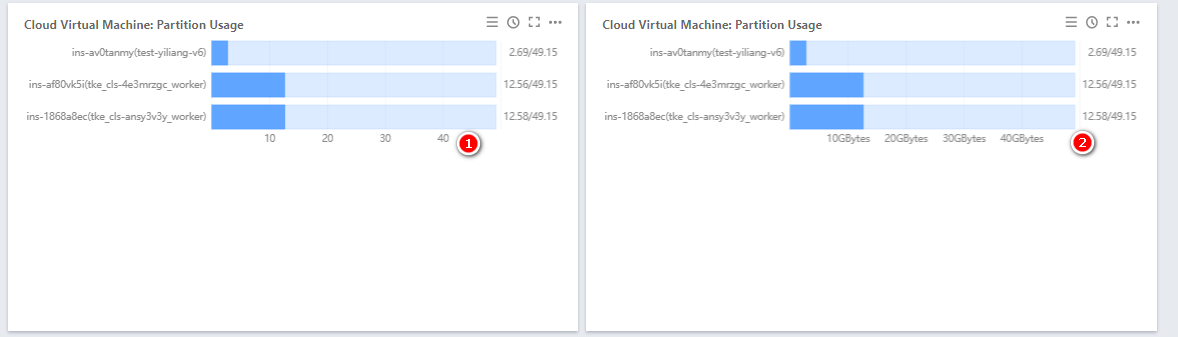
Directions
1. Log in to the Tencent Cloud Observability Platform console and click Dashboard > Default Dashboard on the left sidebar.
2. Click 
3. In the chart configuration section, select “Bar Chart” as the chart type.
4. (Optional) Under “Chart Elements,” you can specify whether to display units. For more information on the meanings of units, see List of Units.
5. After the configuration is completed, click Save in the upper-right corner.
Help and Support
Was this page helpful?
You can also Contact sales or Submit a Ticket for help.
Help us improve! Rate your documentation experience in 5 mins.
Feedback