Ad-hoc analysis enables data analysis by connecting to data tables and allows for flexible selection of fields and field values for granularity analysis.
Through this document, you will learn the following:
Selecting Data Tables
Filtering Fields
Selecting Fields
Selecting Dimension Values
Selecting Data Tables
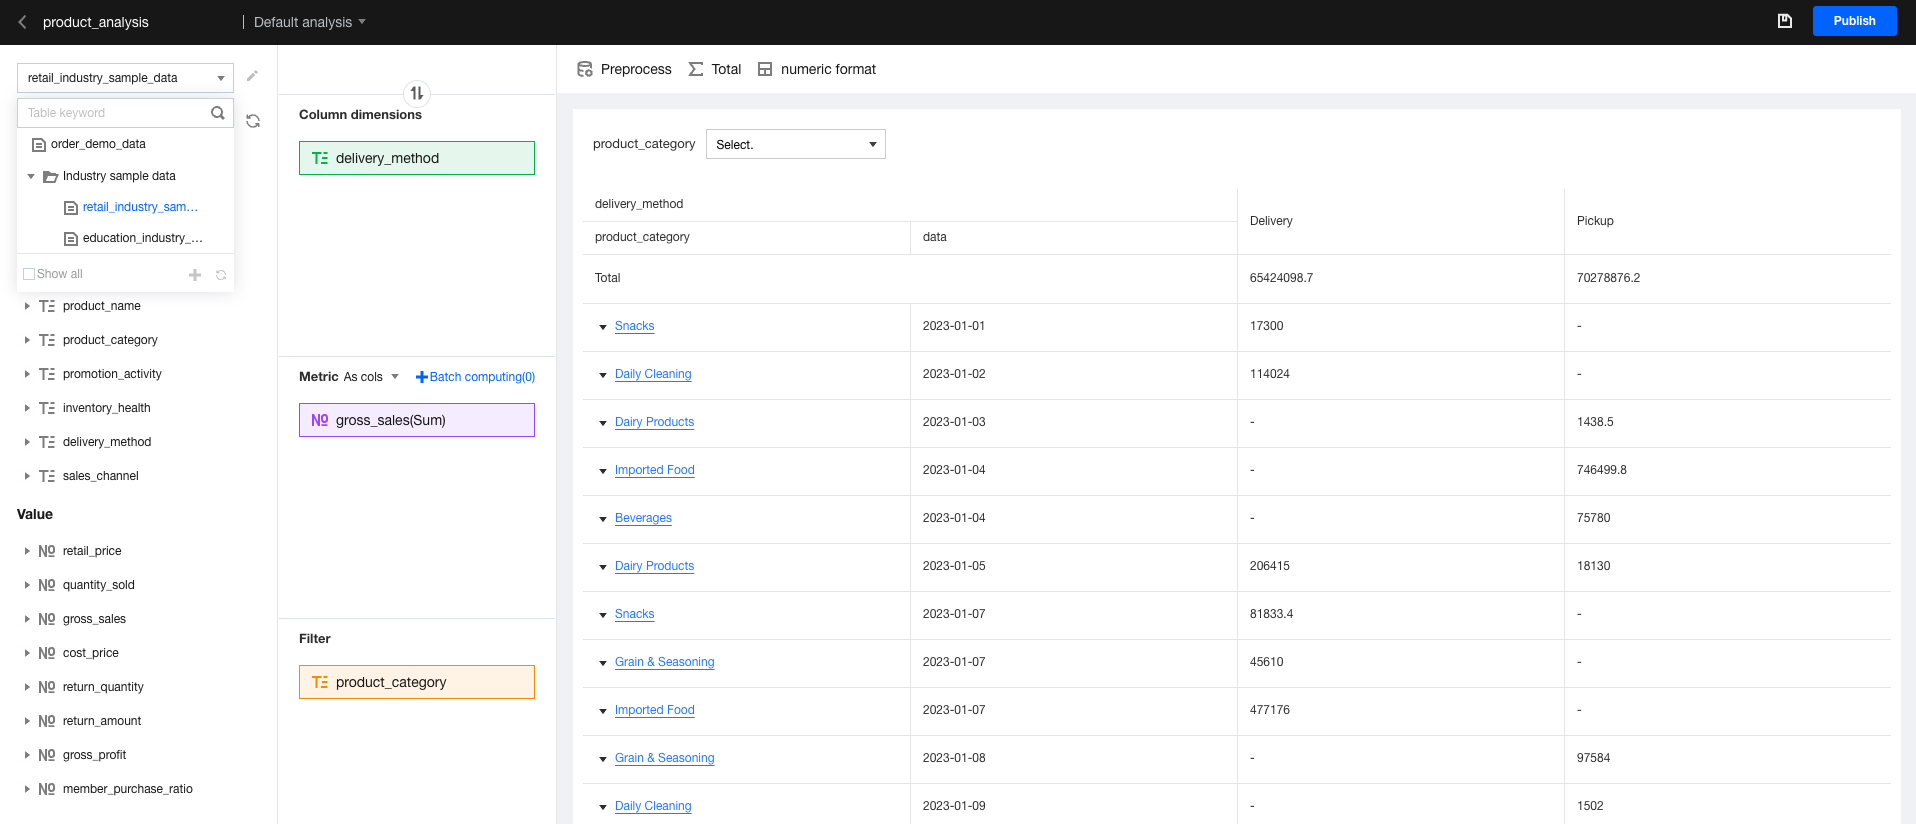
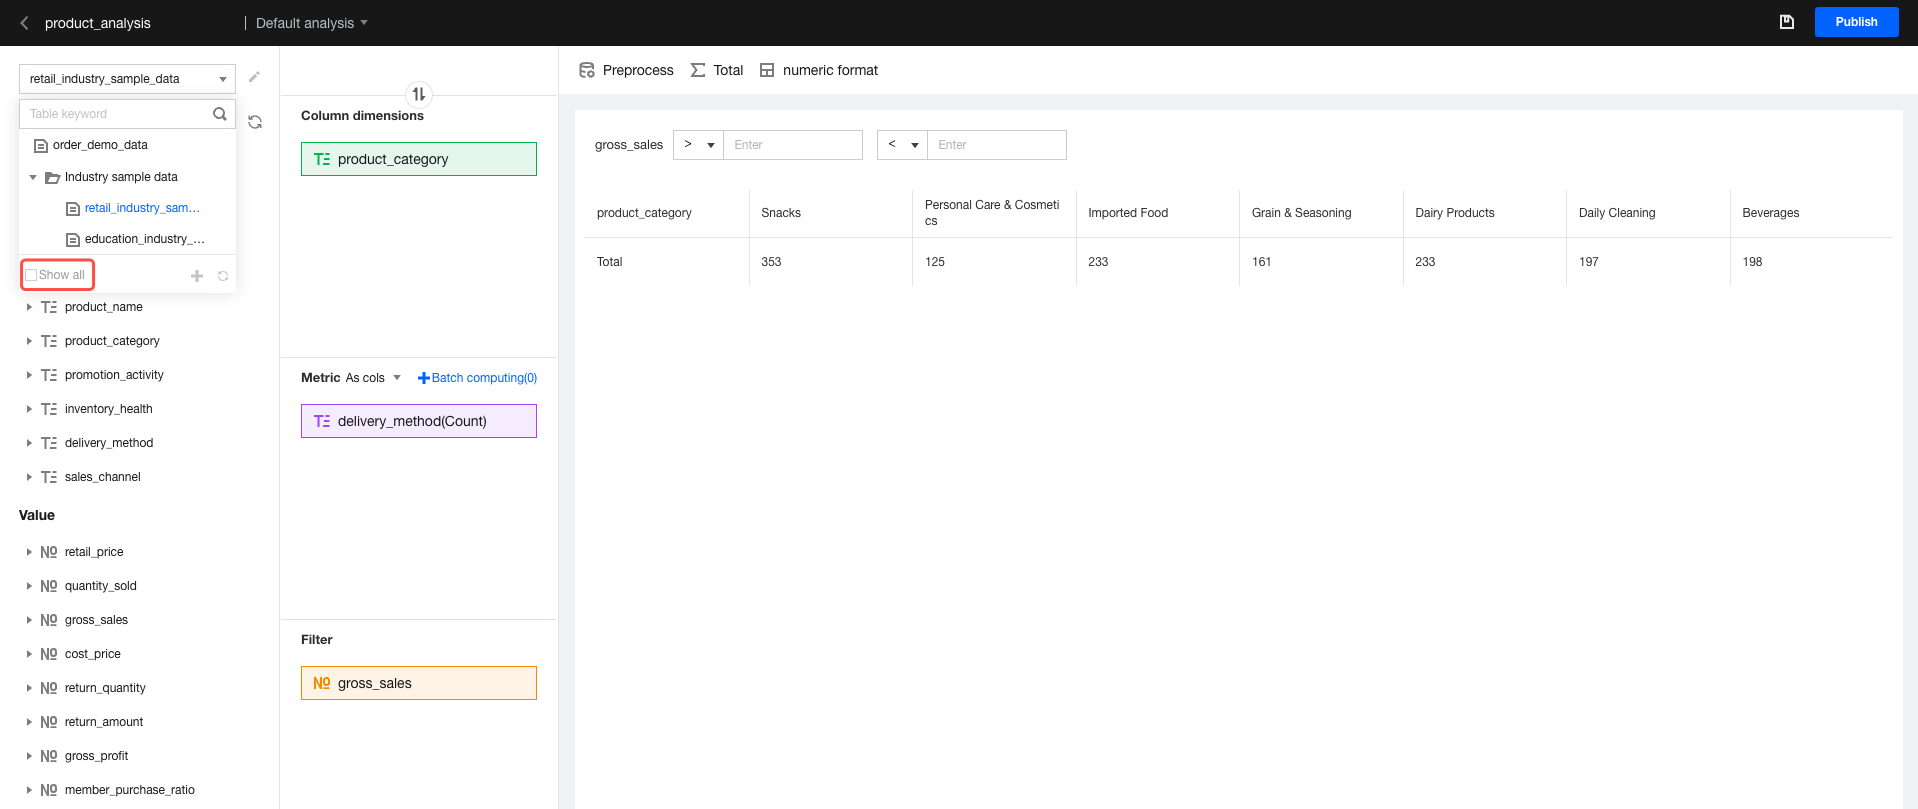
1. Entry: Go to the console. Select Project, Ad-hoc analysis, and then Edit ad-hoc analysis. Click the position indicated in the figure below to switch the data table.
Note:
After the data table is switched, the original configurations will be reset, including the row and column dimensions and metric settings in the analysis area.
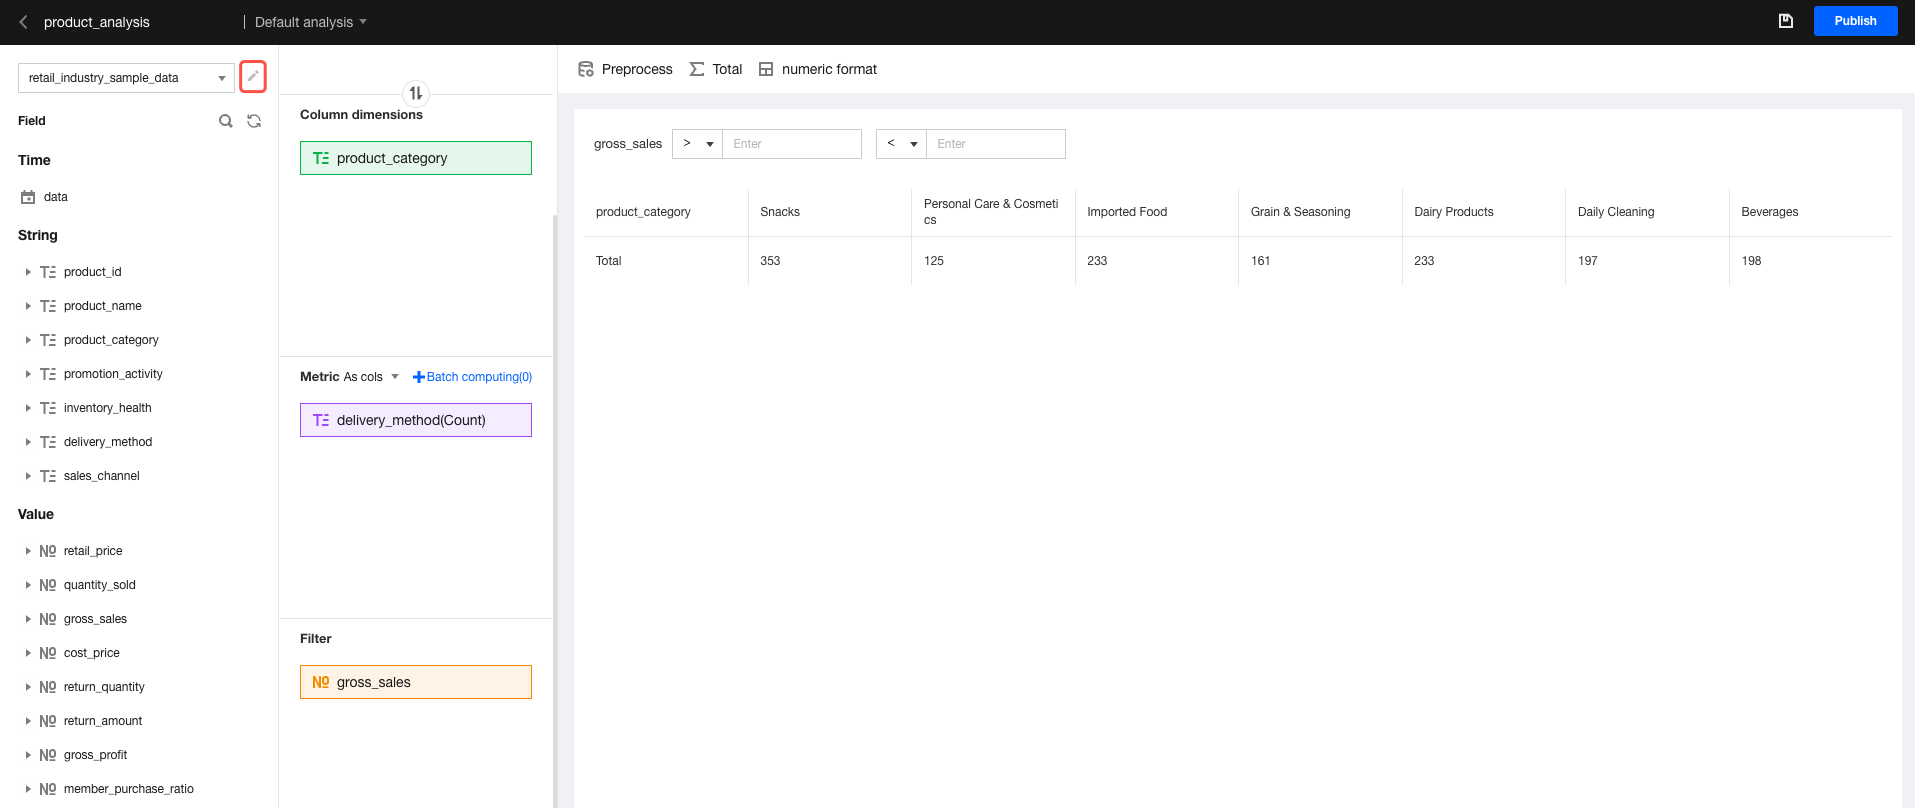
2. Click the "Edit" icon to be quickly redirected to the data table editing page.
3. If no suitable data table is available, click create data table to create one.
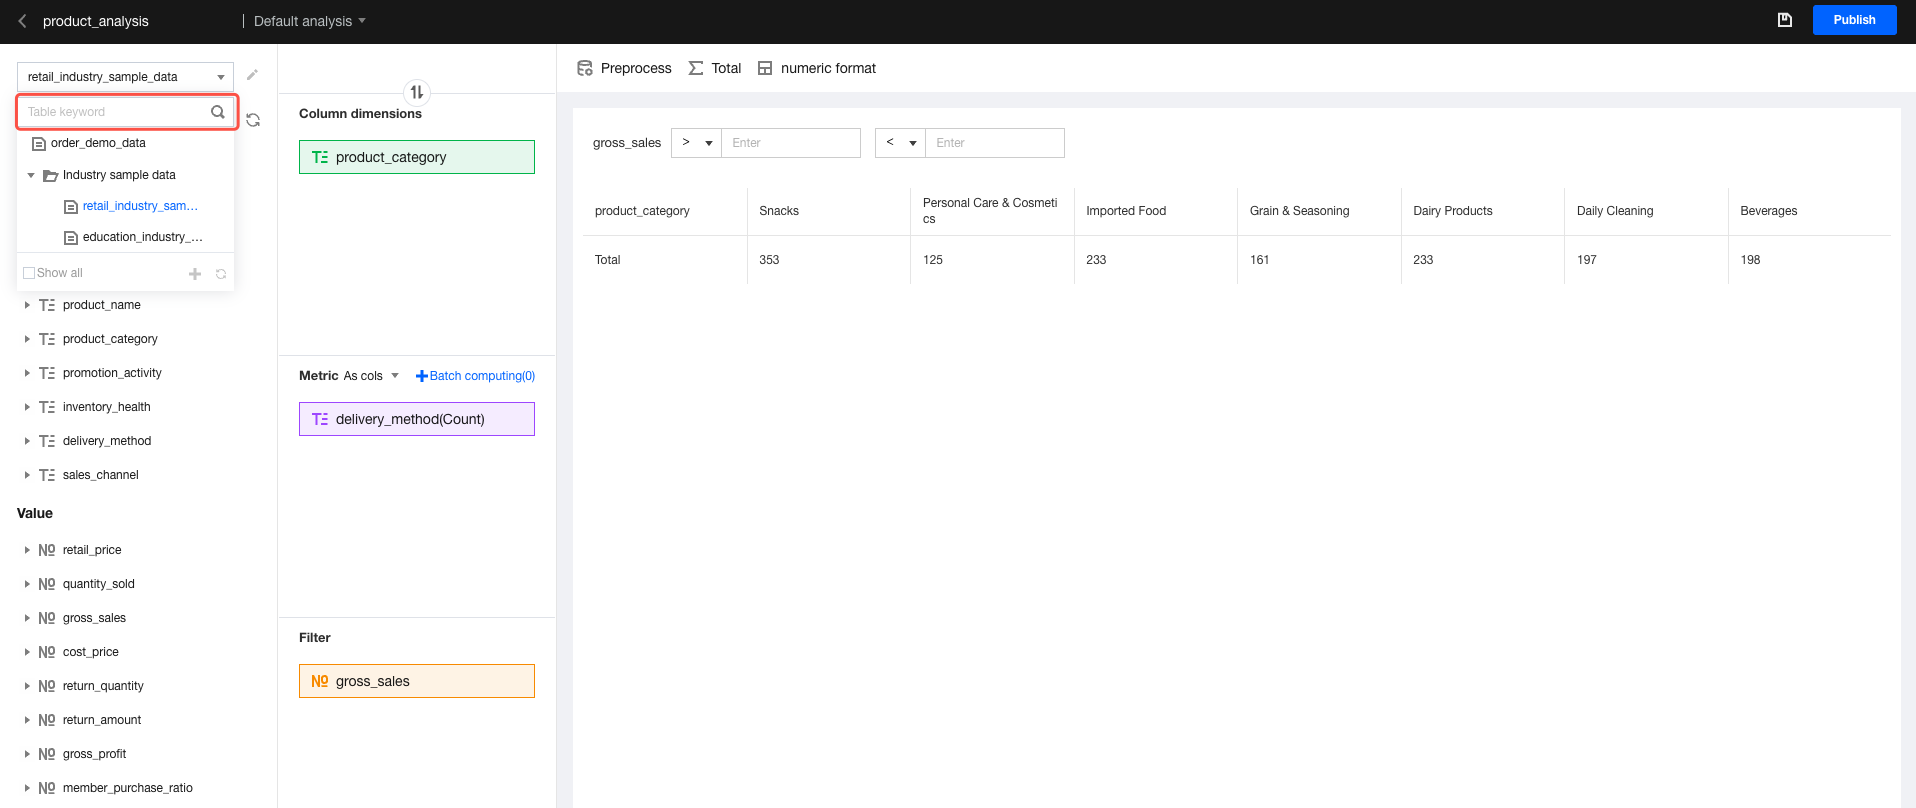
4. You can enter the table name keyword in the search box to search for the desired data table.
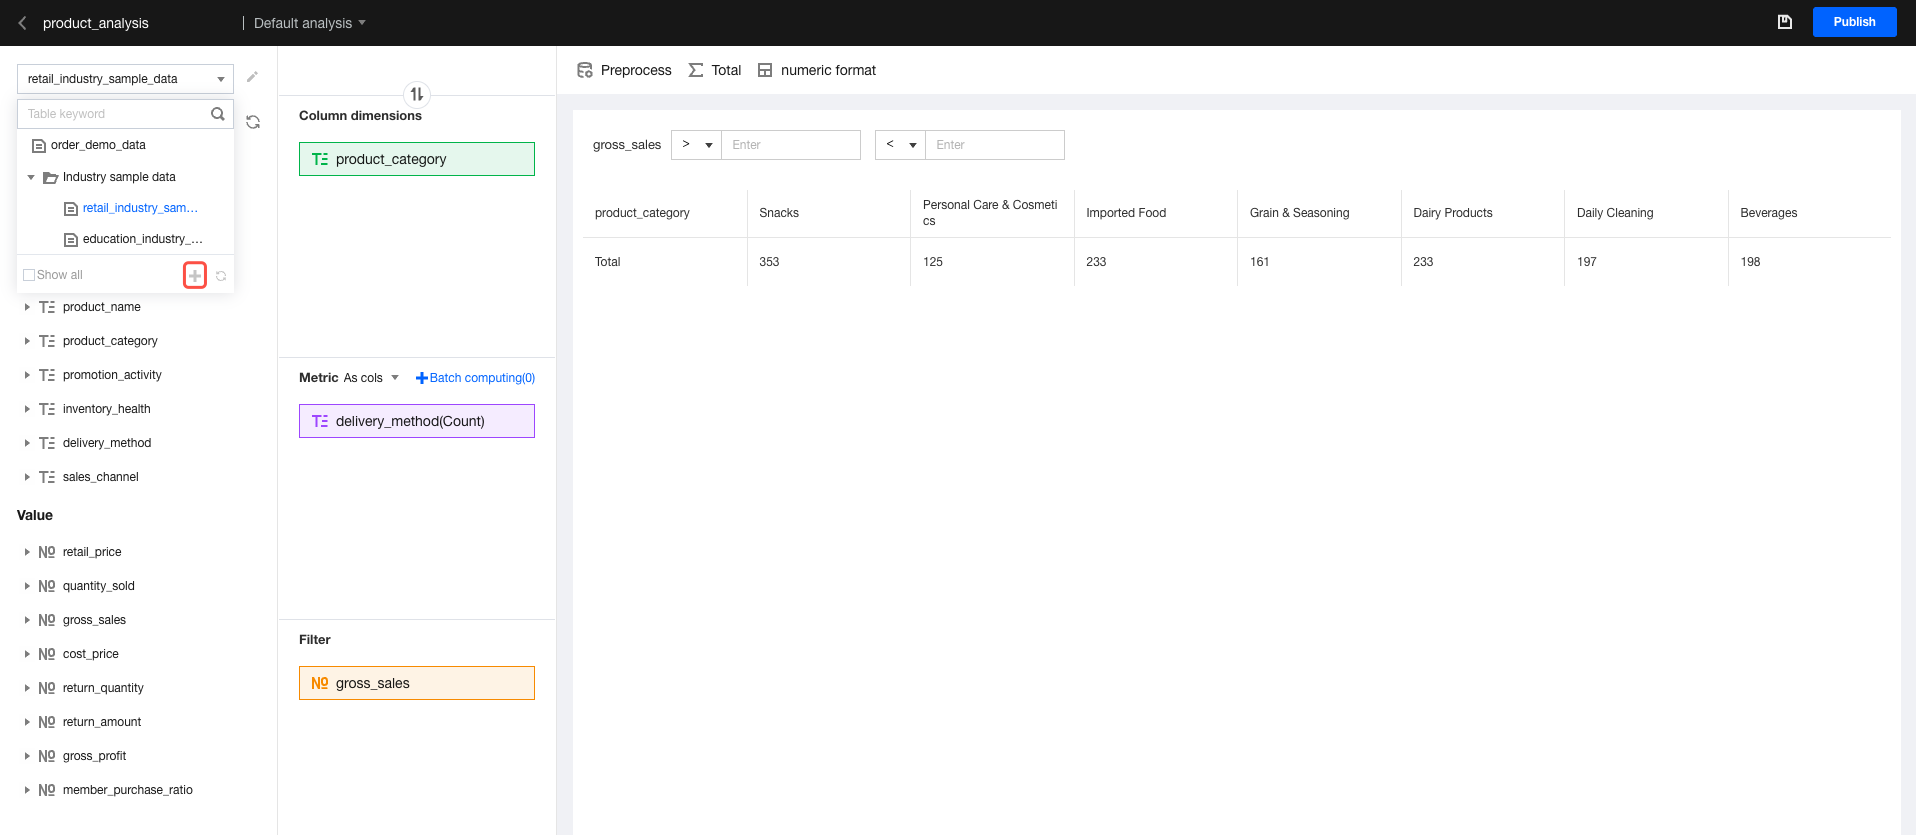
5. By default, data tables with access permissions are displayed in the list. If you want to view all data tables, click Show All.
Filtering Fields
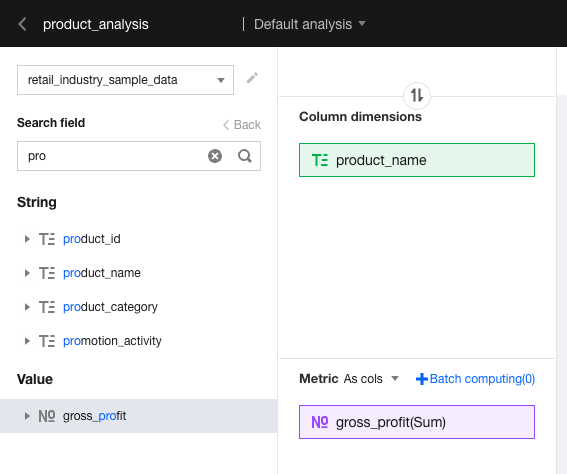
To find the required field, enter the field keyword in the position indicated in the figure below.
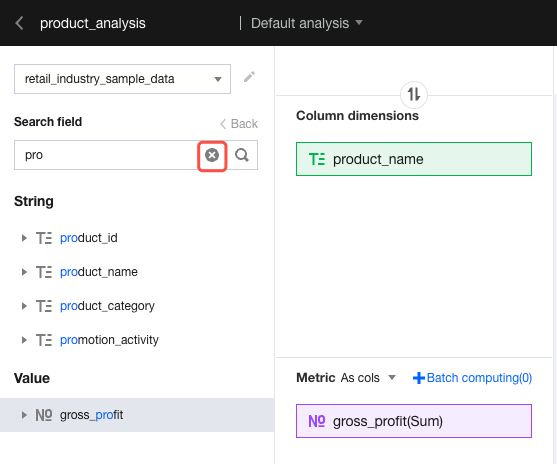
Click "x" to clear filter criteria and display all fields.
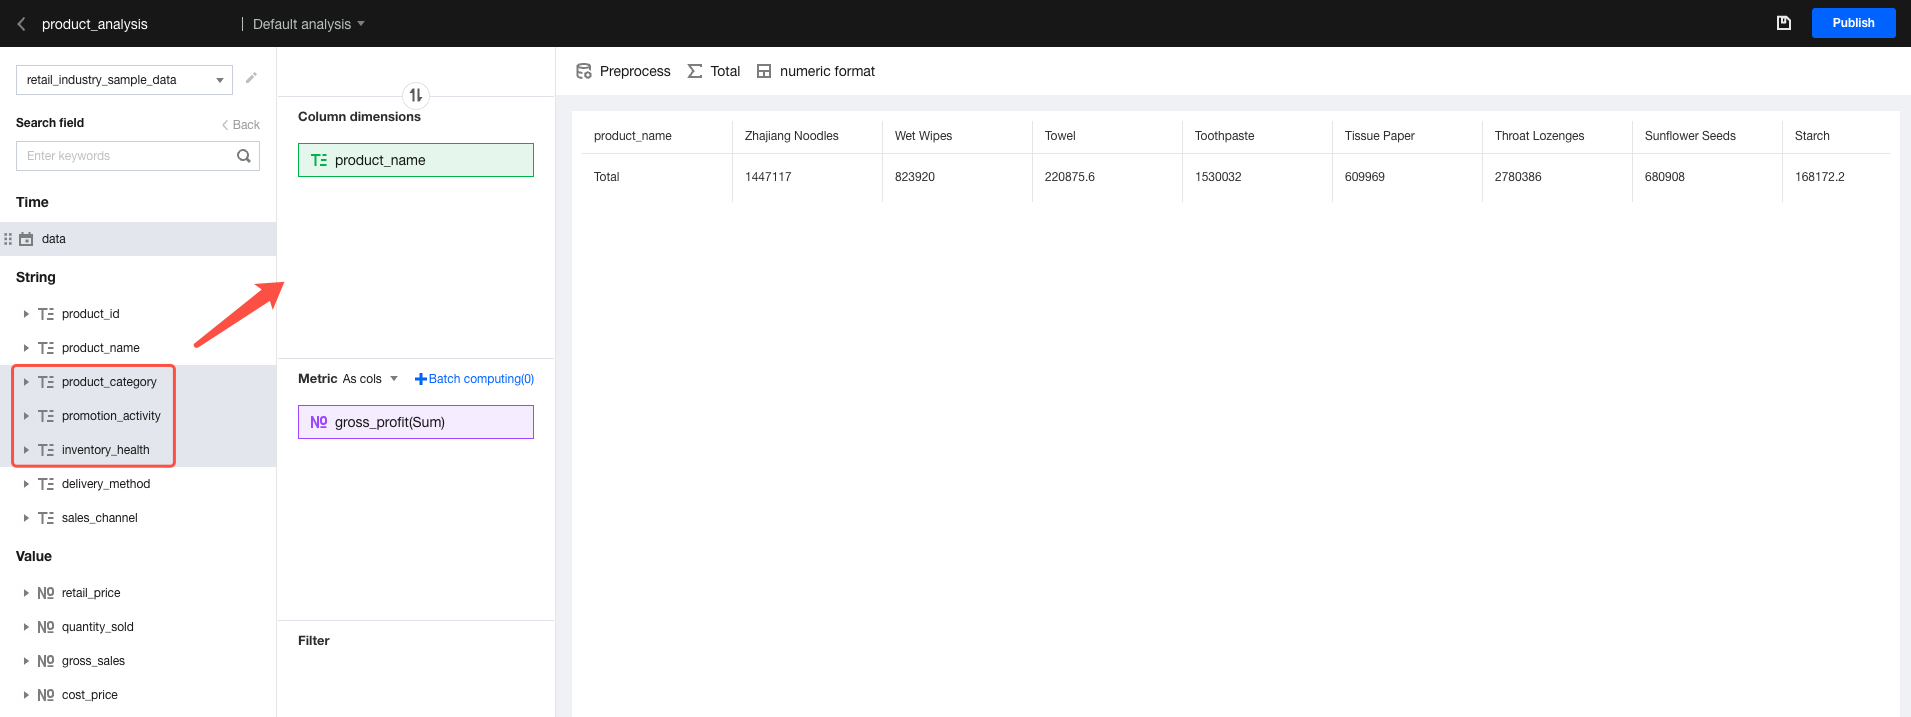
Selecting Fields
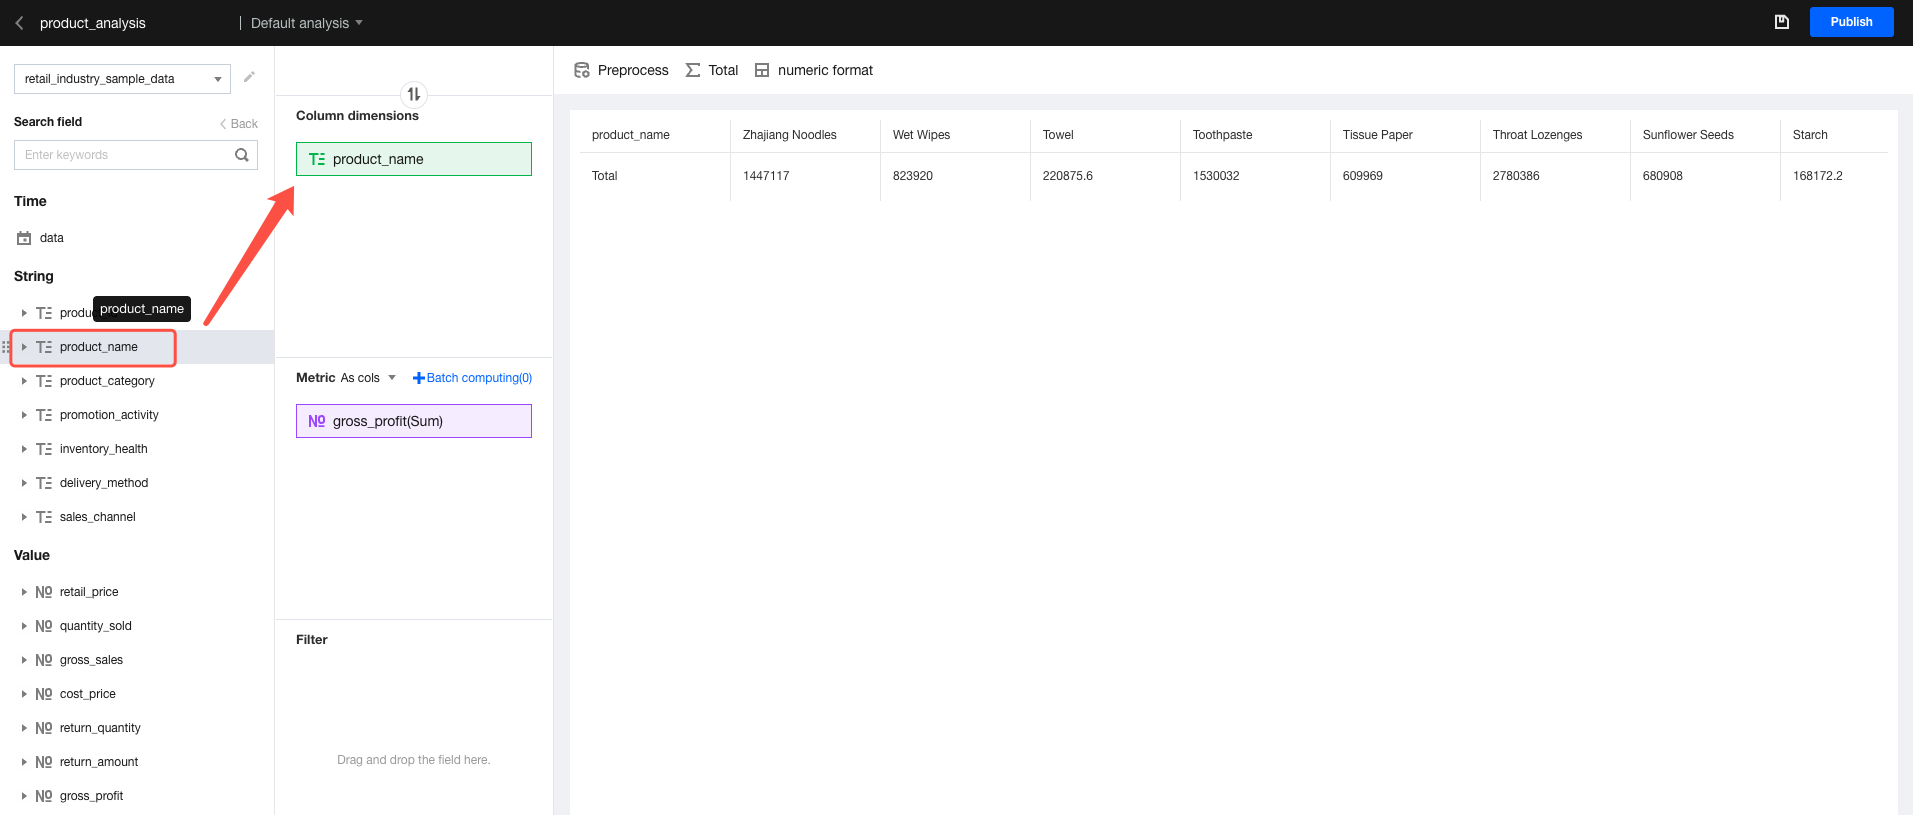
1. Single selection: Click a field in the field list, and drag and drop the field to the analysis area.
2. Multiple selection: Press and hold the Shift key while clicking a field and dragging and dropping the field to the analysis area.
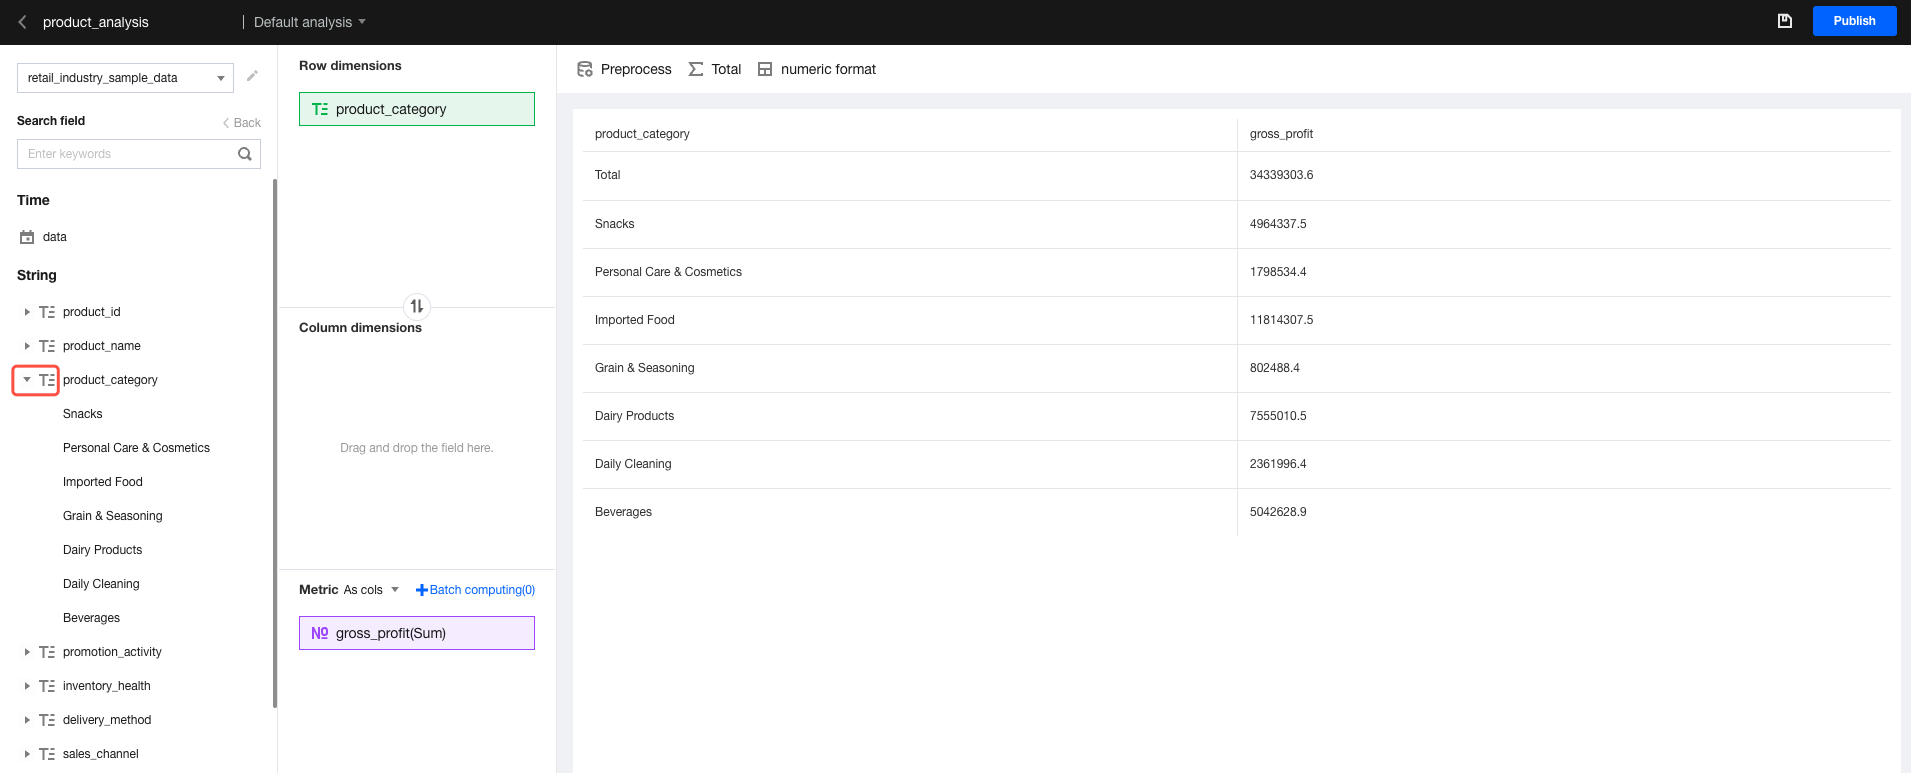
Selecting Dimension Values
Ad-hoc analysis supports selecting dimension value granularities for analysis, helping quickly analyze the core dimension values.
1. Expand dimension values: As shown in the figure below, click the field to expand the dimension value drop-down list of this field.
If many dimension values are available, click Load more at the bottom of the list to display up to 50 dimension values. If the total number of dimension values exceeds 50, we recommend that you manage the dimension values by grouping the values (the grouping feature is under development).
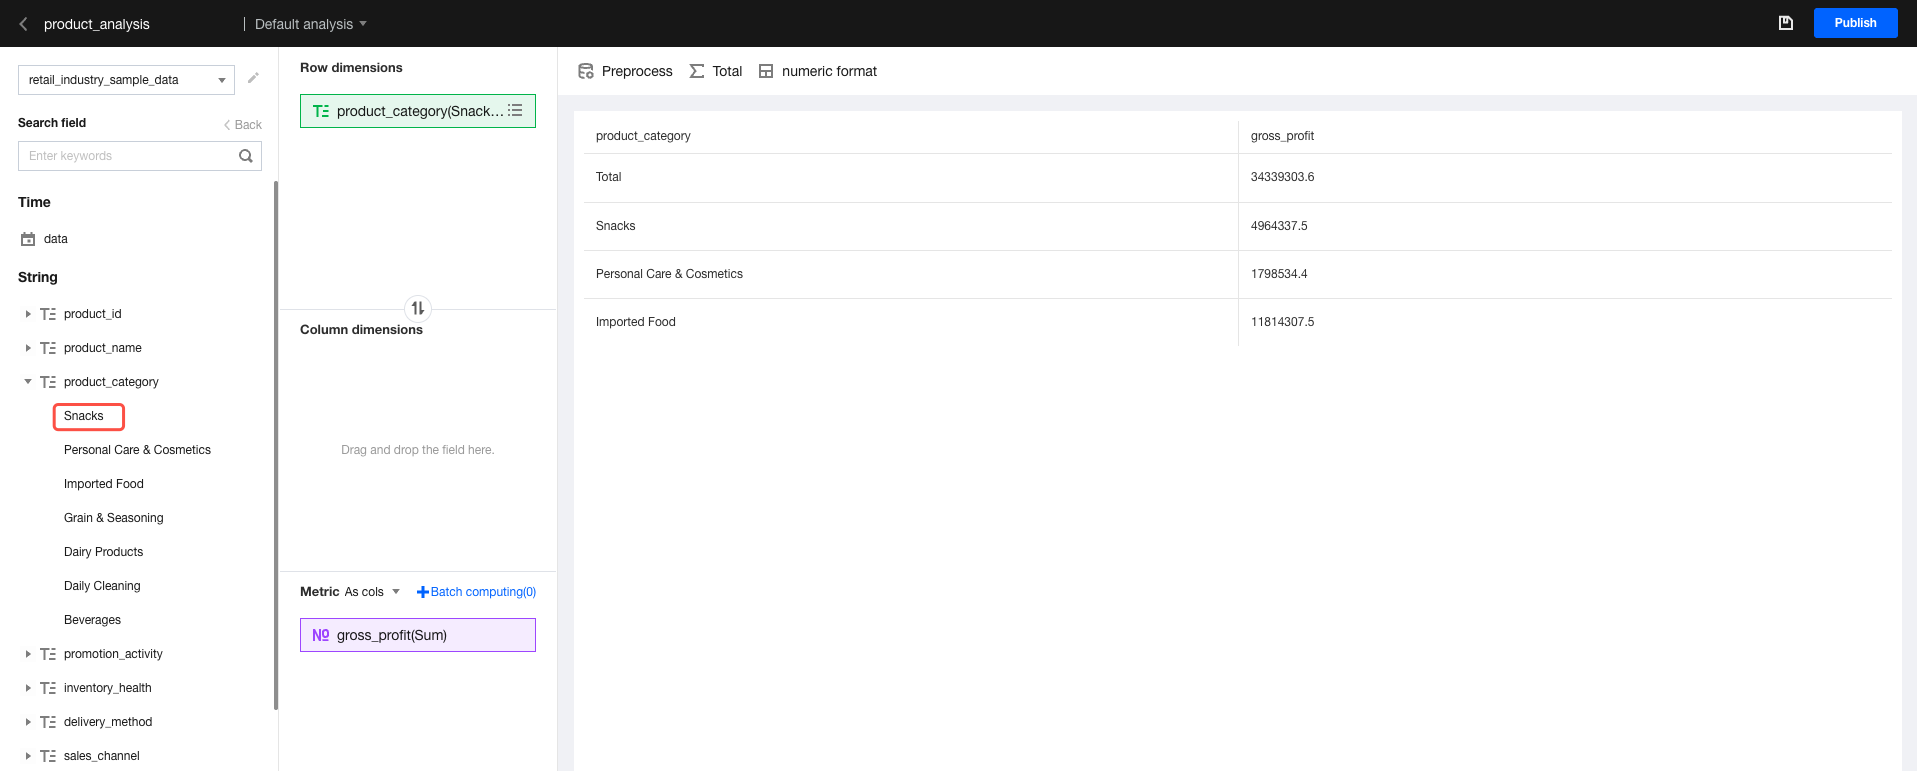
2. Select a single dimension value: Drag and drop a dimension value to the analysis area for single dimension value selection.
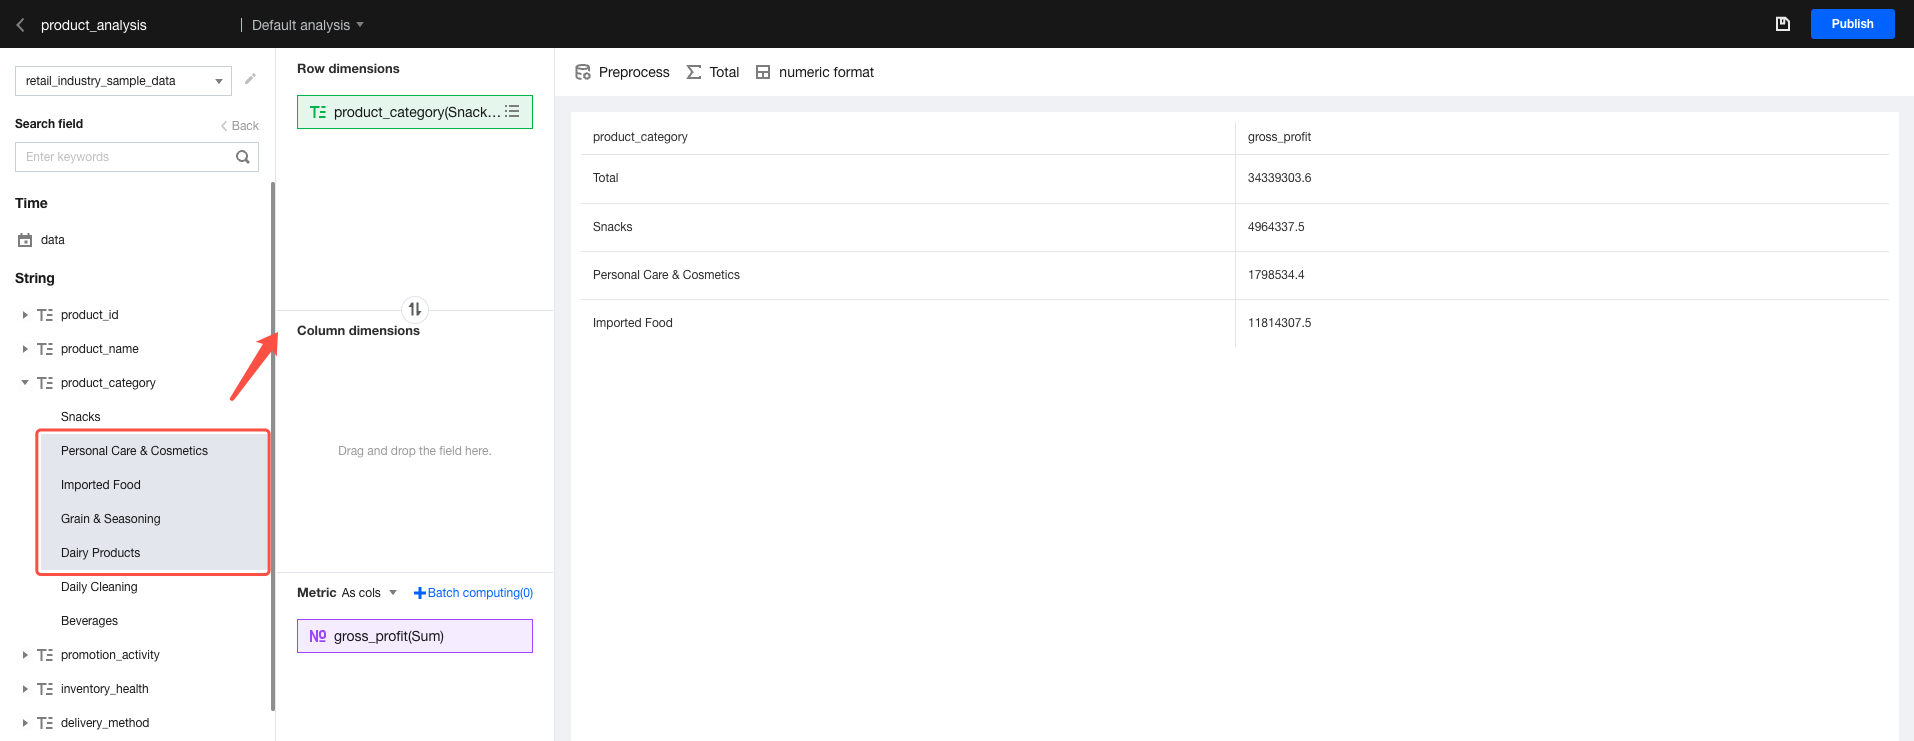
3. Select multiple dimension values: Press and hold the Shift key while selecting multiple dimension values and dragging and dropping the values to the analysis area for multiple dimension value selection.
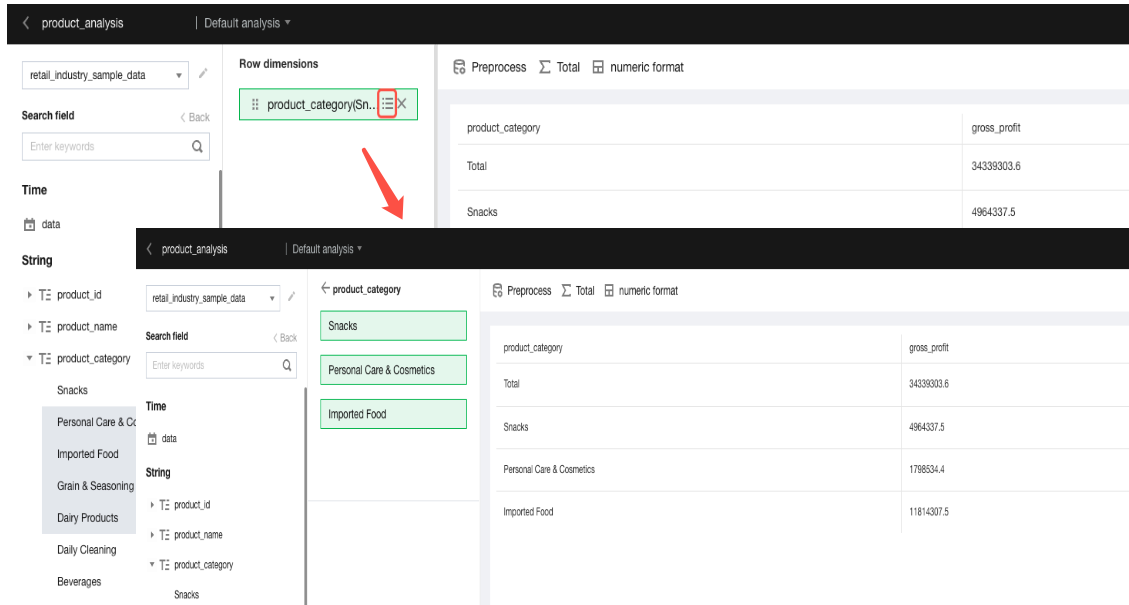
4. Remove dimension values: Click the "Value List" icon of the analysis field to view and remove certain dimension values, as shown in the figure below:
Note:
Duplicate dimension values are automatically collapsed under the corresponding field in the analysis area.
Dimension values and dimension fields cannot be selected and dragged and dropped to the analysis area at the same time.