When data has a cascading relationship (such as province, city, district), the cascading filter allows you to complete layer-by-layer filtering of multiple fields within one component for an interactive effect.
Edition support: Basic Edition, and Professional Edition.
Prerequisites:
Only text and numeric fields are supported as cascade fields.
Only single-selection cascade is supported.
Sample task: Create a filter to perform sequential filtering of data by "department" > "level" > "employee".
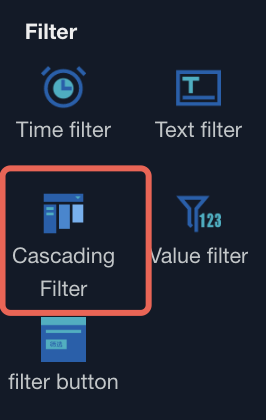
1. Add a cascading filter in the canvas
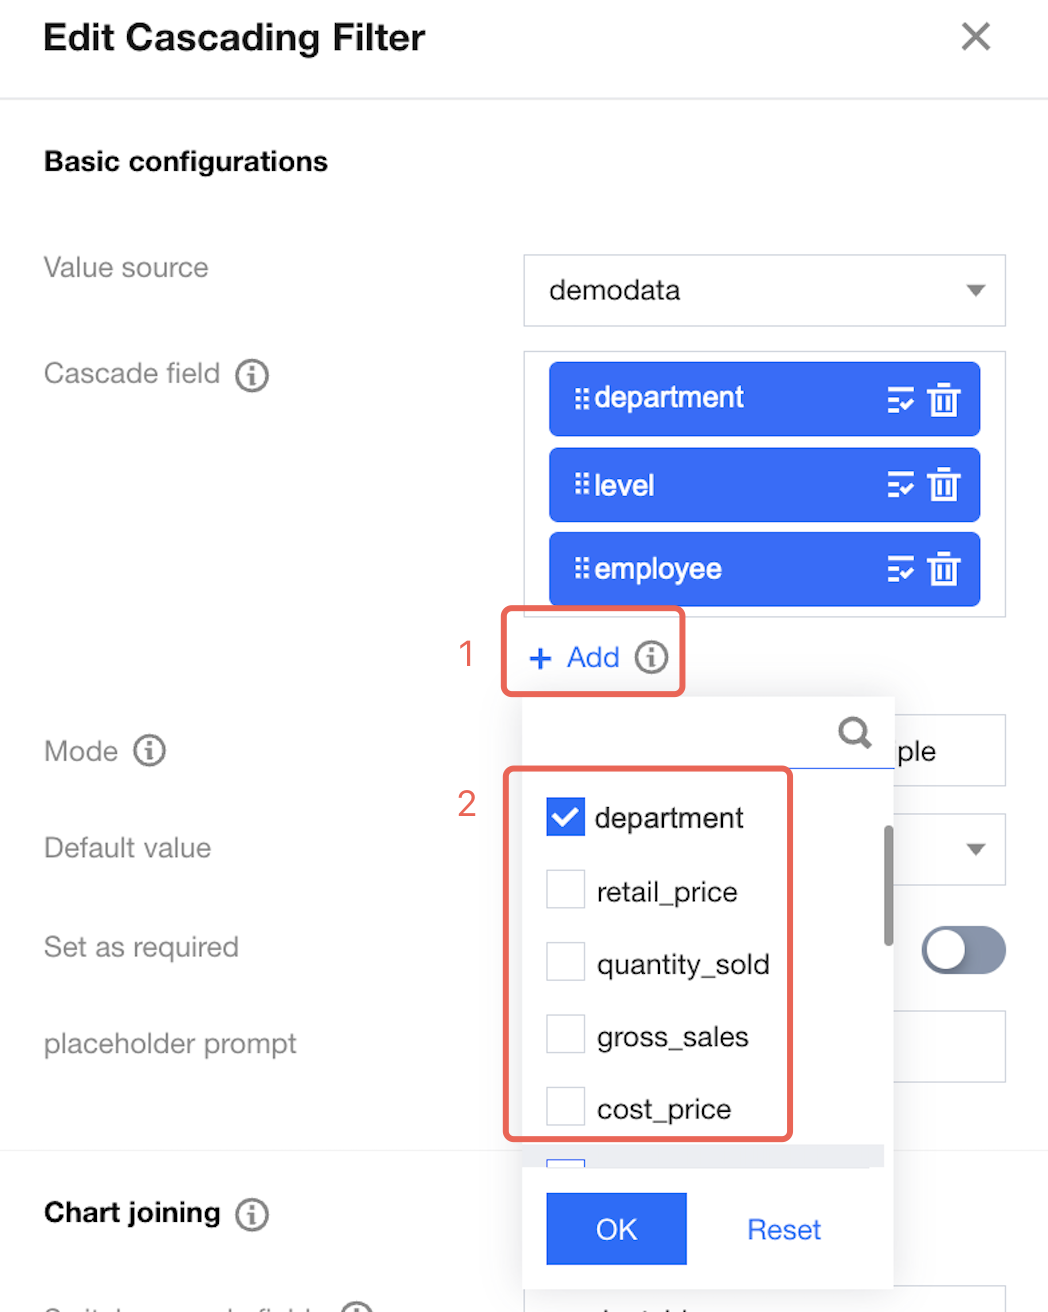
2. Select data tables and fields
Selectable text or numeric field.
Supports up to 10 levels, allowing a maximum of 10 fields to be chosen.
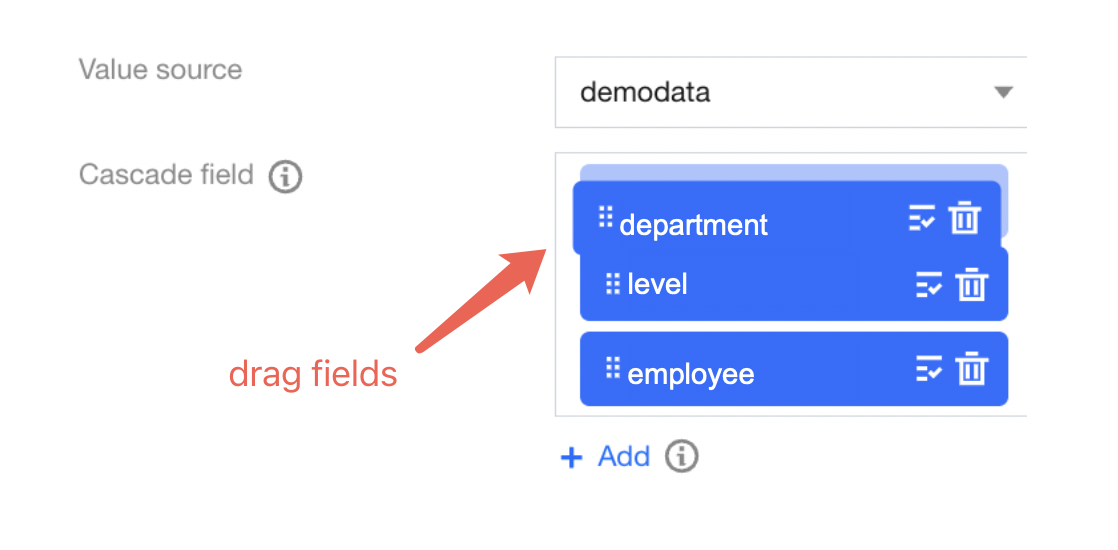
3. Adjust the cascade sequence
After selecting a field, you can drag fields in the cascading field box to adjust the sequence. The actual cascade sequence is read top-to-bottom.
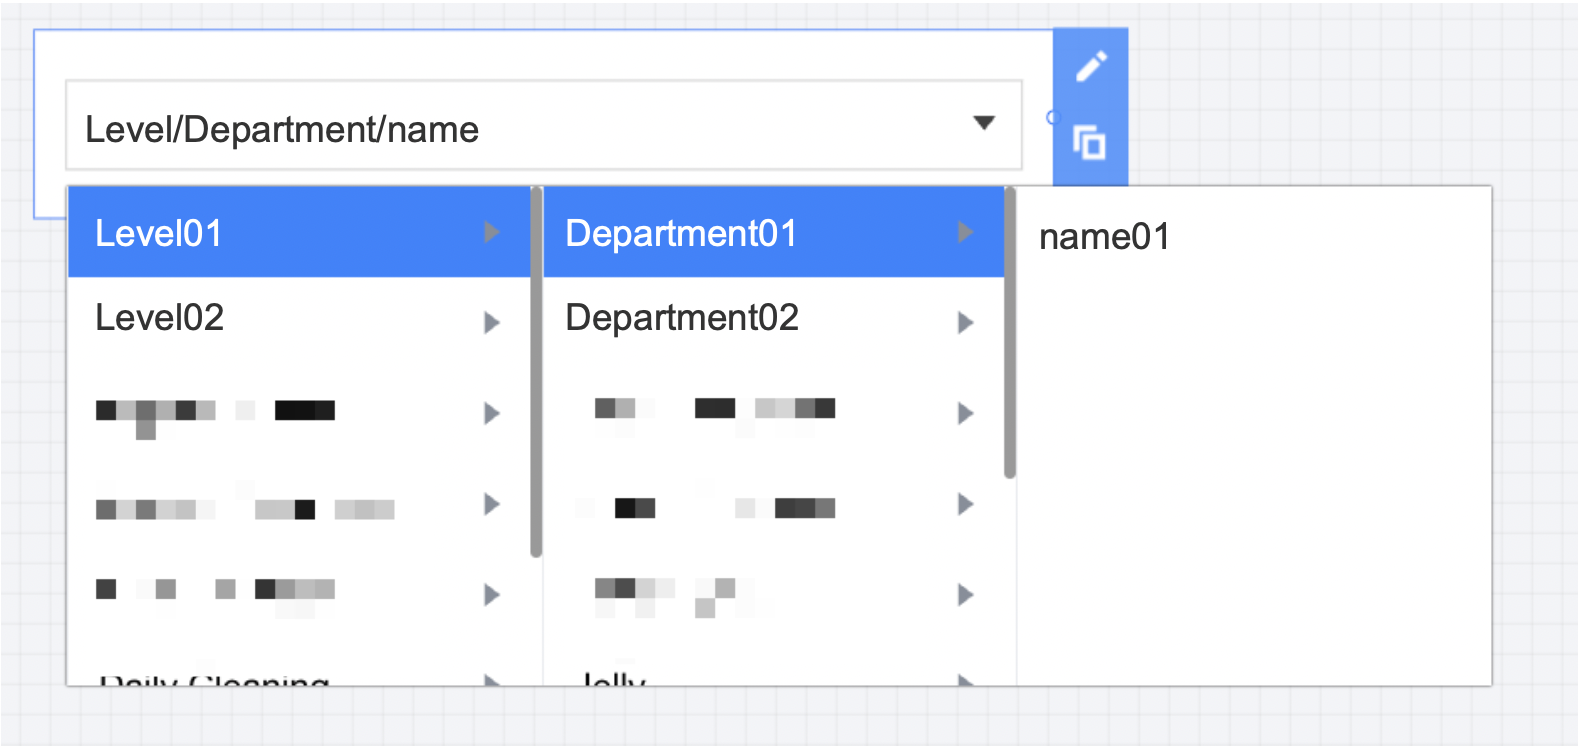
As shown in the figure above, it will form a cascading filter with three levels: position > department > name, as follows:
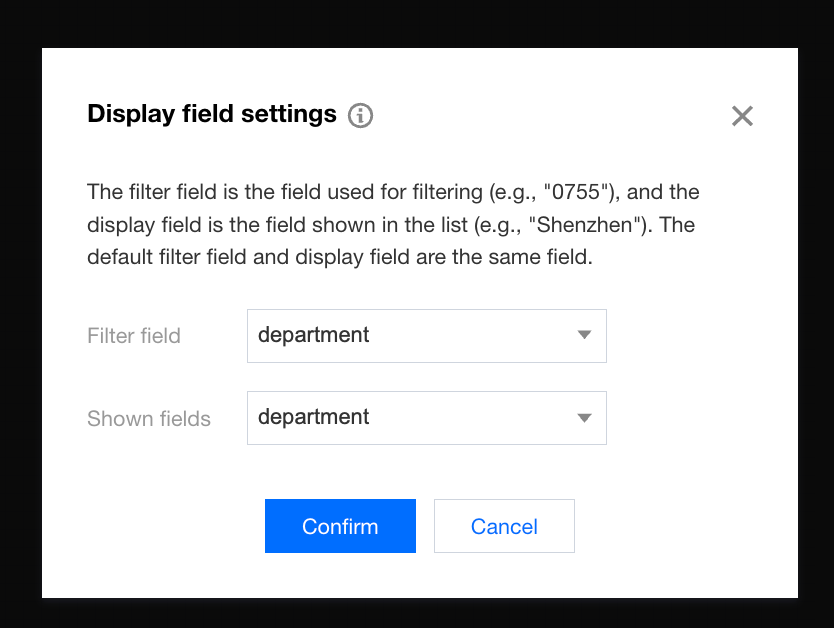
Besides, fields within the cascading frame support separation of display fields and filter fields. For example, the usage scenario could show "Shenzhen" while the actual filter code is "0755".
Click
, and a pop-up settings window for display fields will appear.
The default filter field and display field are the same. As needed, different fields can be set, for example, the display field as "region" and the filter field as "region code".
4. Set the field relations for each cascade
Cascading filtering actually selects multiple fields and corresponding values simultaneously. Unlike the associated component method of ordinary filters, the cascading filter can target one or more fields for association.
Next, suppose you use the cascading filter with the cascade logic "department > position > employee". There are two scenarios:
Scenario one: Hope to filter out all records with employee name "Zhang San" after associating charts
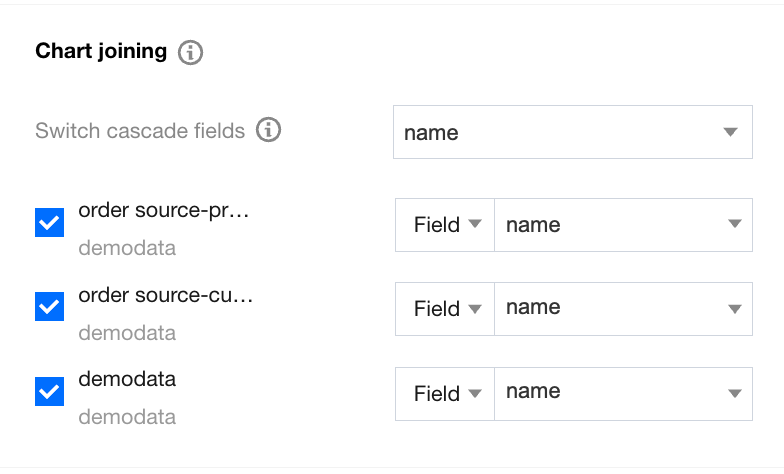
a. Sequentially select associated chart > switch-over cascade field > name;
b. As shown in the figure above, after checking the chart, select the associated field;
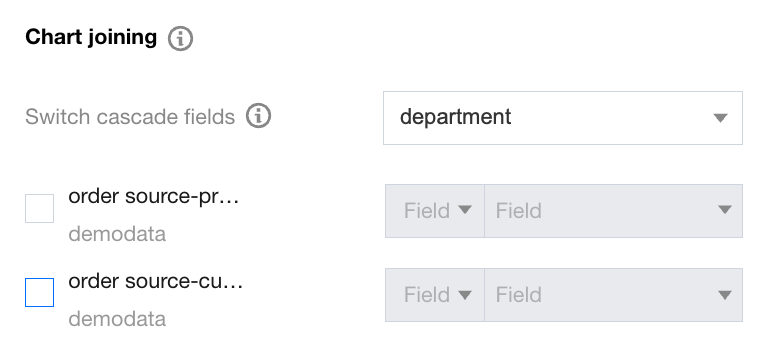
c. Switch to another cascade field and cancel the associated chart (as shown in the figure below, switch to "department" and cancel the associated chart);
d. In the filtering box, sequentially select Product Planning Group > Product > Zhang San. The actual result will appear:
Department: Product Planning Group; Position: Product; Name: Zhang San
You can see that only records with "name=Zhang San" are filtered. If multiple departments have "Zhang San," they will all be filtered out.
Scenario two: Hope to filter out all records of "Zhang San" in the "Product Planning Group" department after associating charts
a. Sequentially select associated chart > switch-over cascade field > name;
b. As shown in the figure above, after checking the chart, select the associated field (such as the "name" field in the associated chart "detailed data");
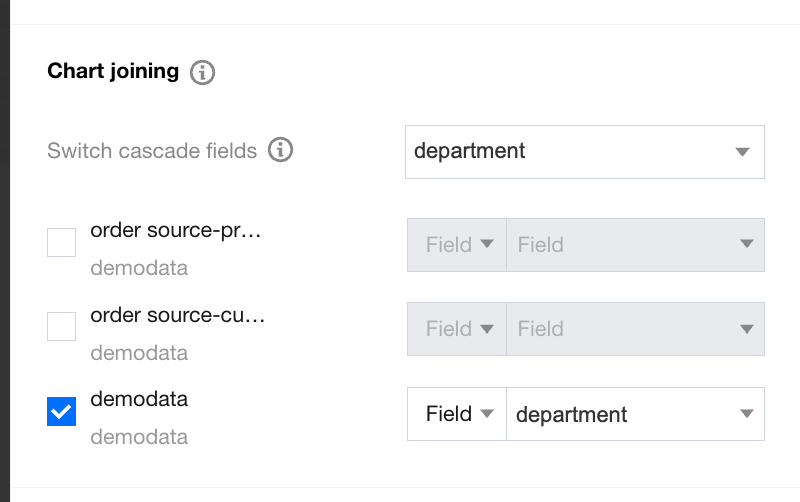
c. Perform the same operation on the "department" and "position" fields to associate them with the chart. Take the cascading field "department" as an example:
d. In the filtering box, sequentially select Product Planning Group > Product > Zhang San. The actual result will appear:
Department: Product Planning Group; Position: Product; Name: Zhang San
You can see that compared to scenario one, the actual filter has three conditions taking effect at the same time. Even if the "Quality Group" department also has a "Zhang San," it will not hit.