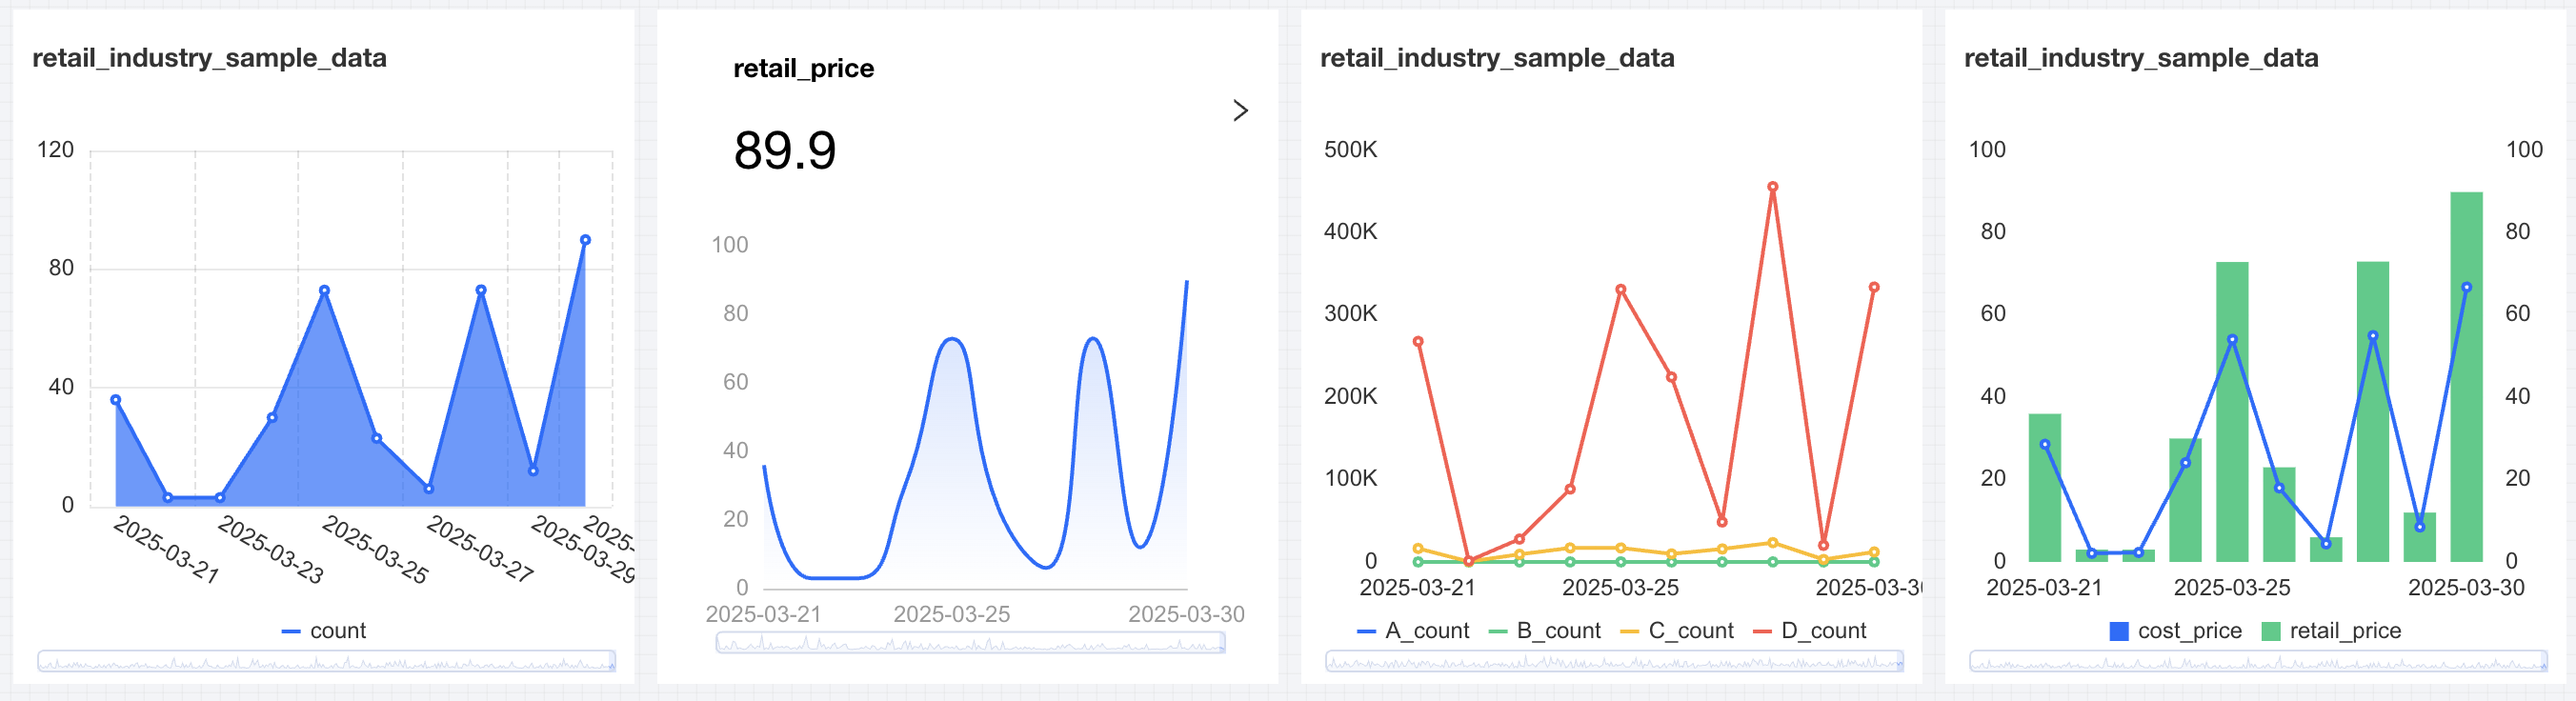
Tencent Cloud Business Intelligence (BI) product's trend charts include line charts, area charts, metric cards & metric trend charts, and bar charts, mainly used for trend analysis of data.
Line Chart
The line chart is primarily used to display data trends at equal time intervals. The following shows sales trend data over time.
Query Condition Settings
Dimension & metric count requirements: dimensions >=1, metrics >=1.
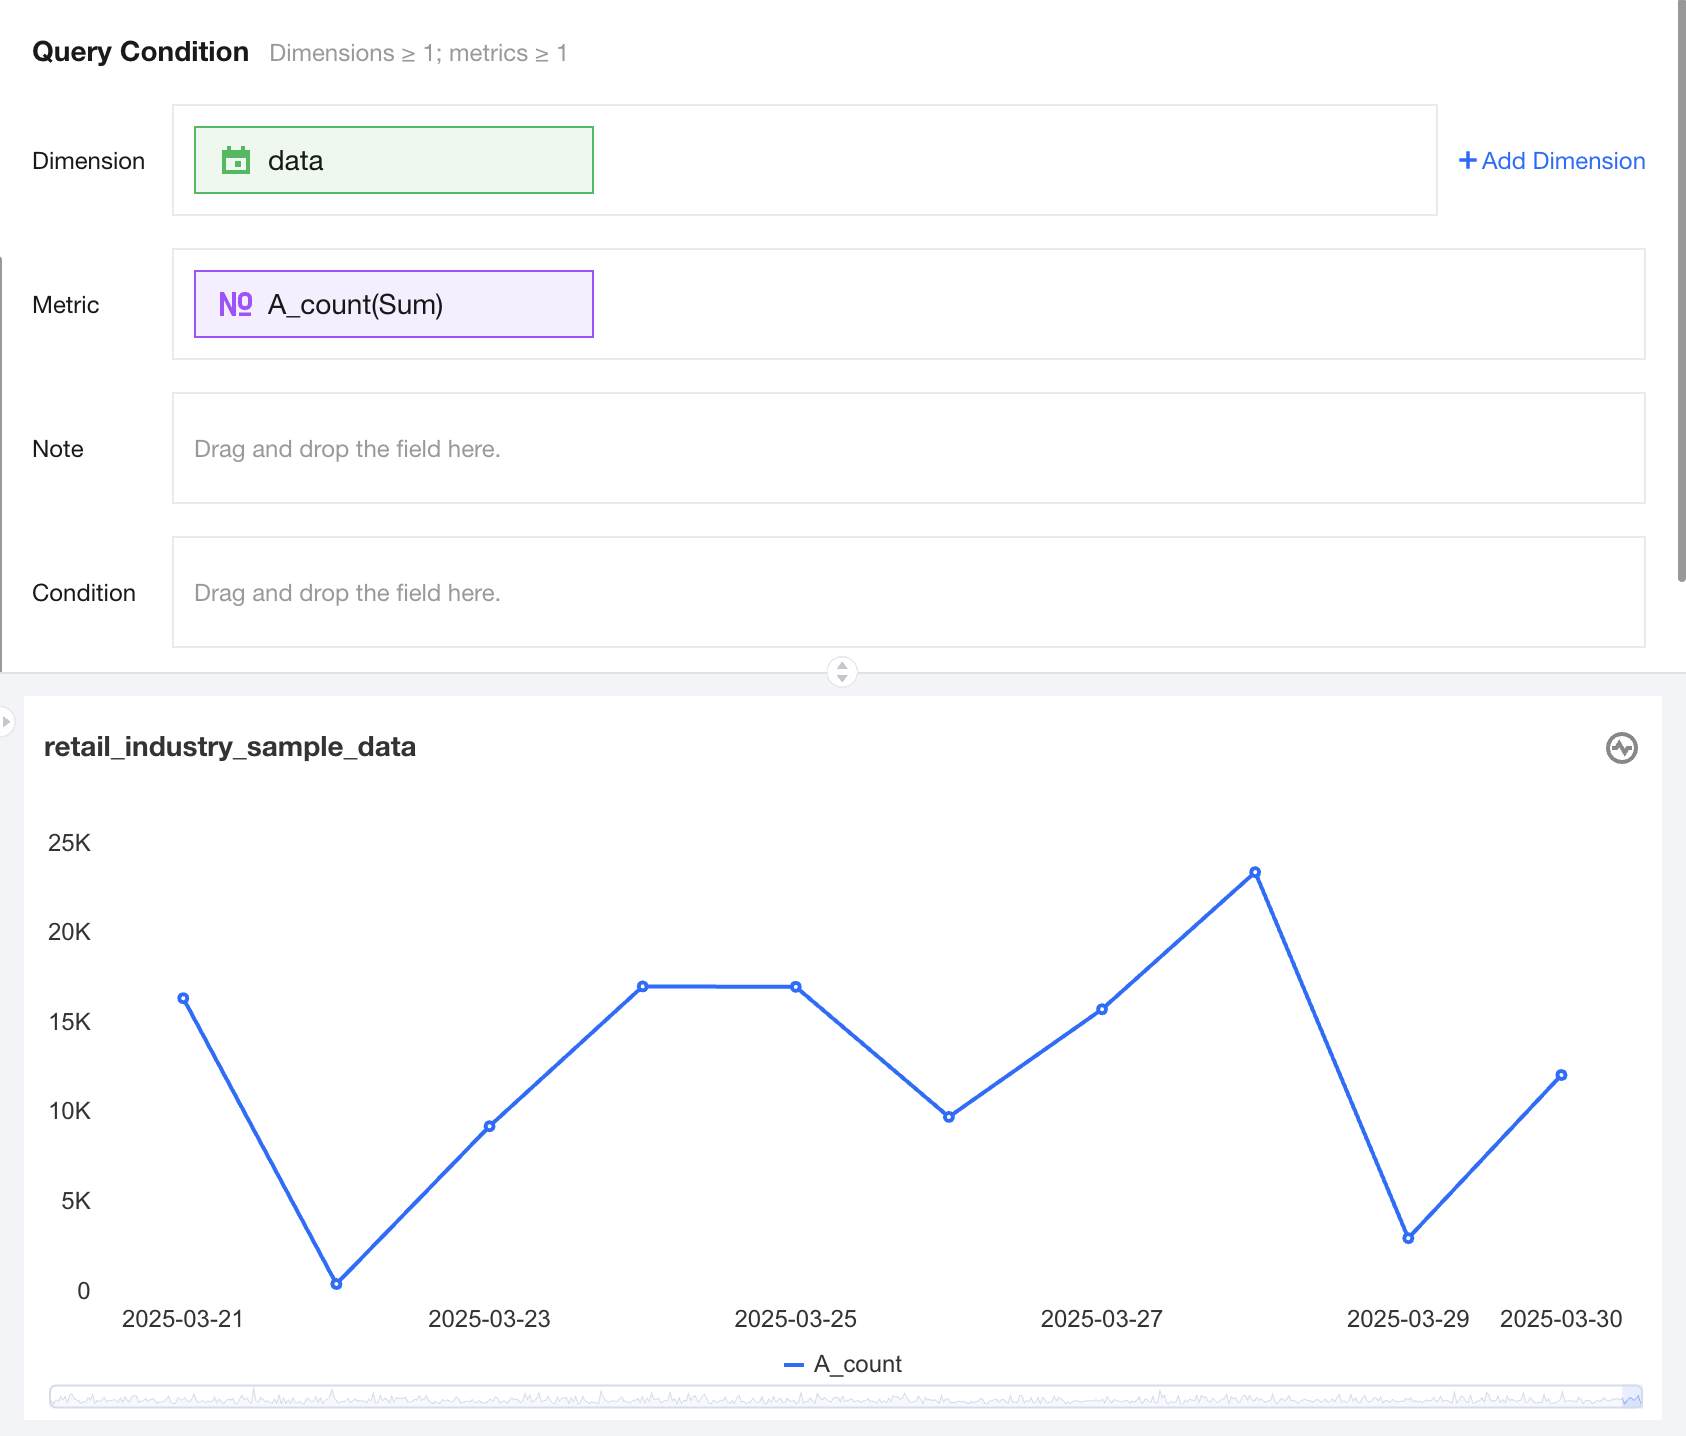
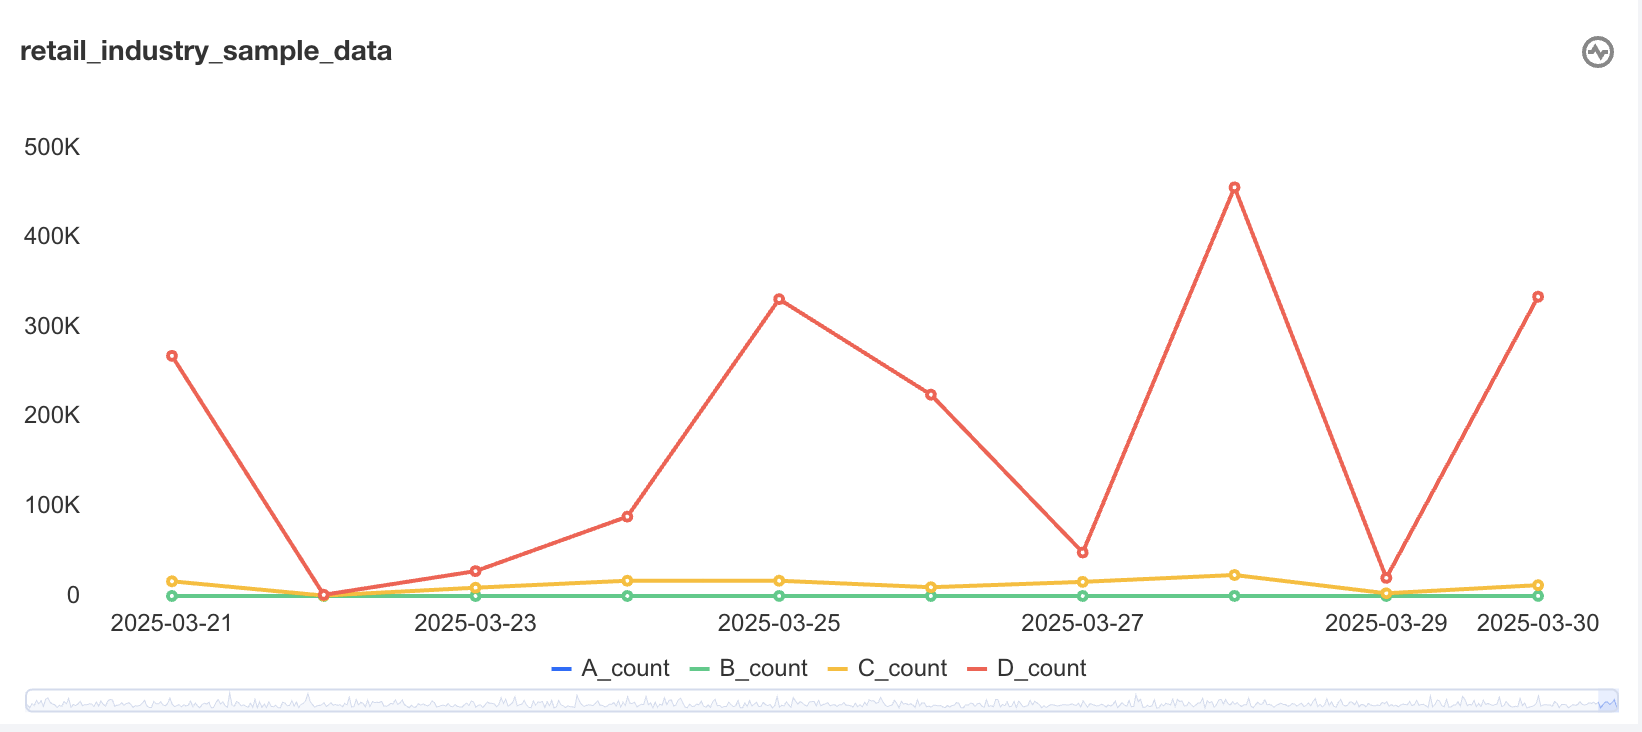
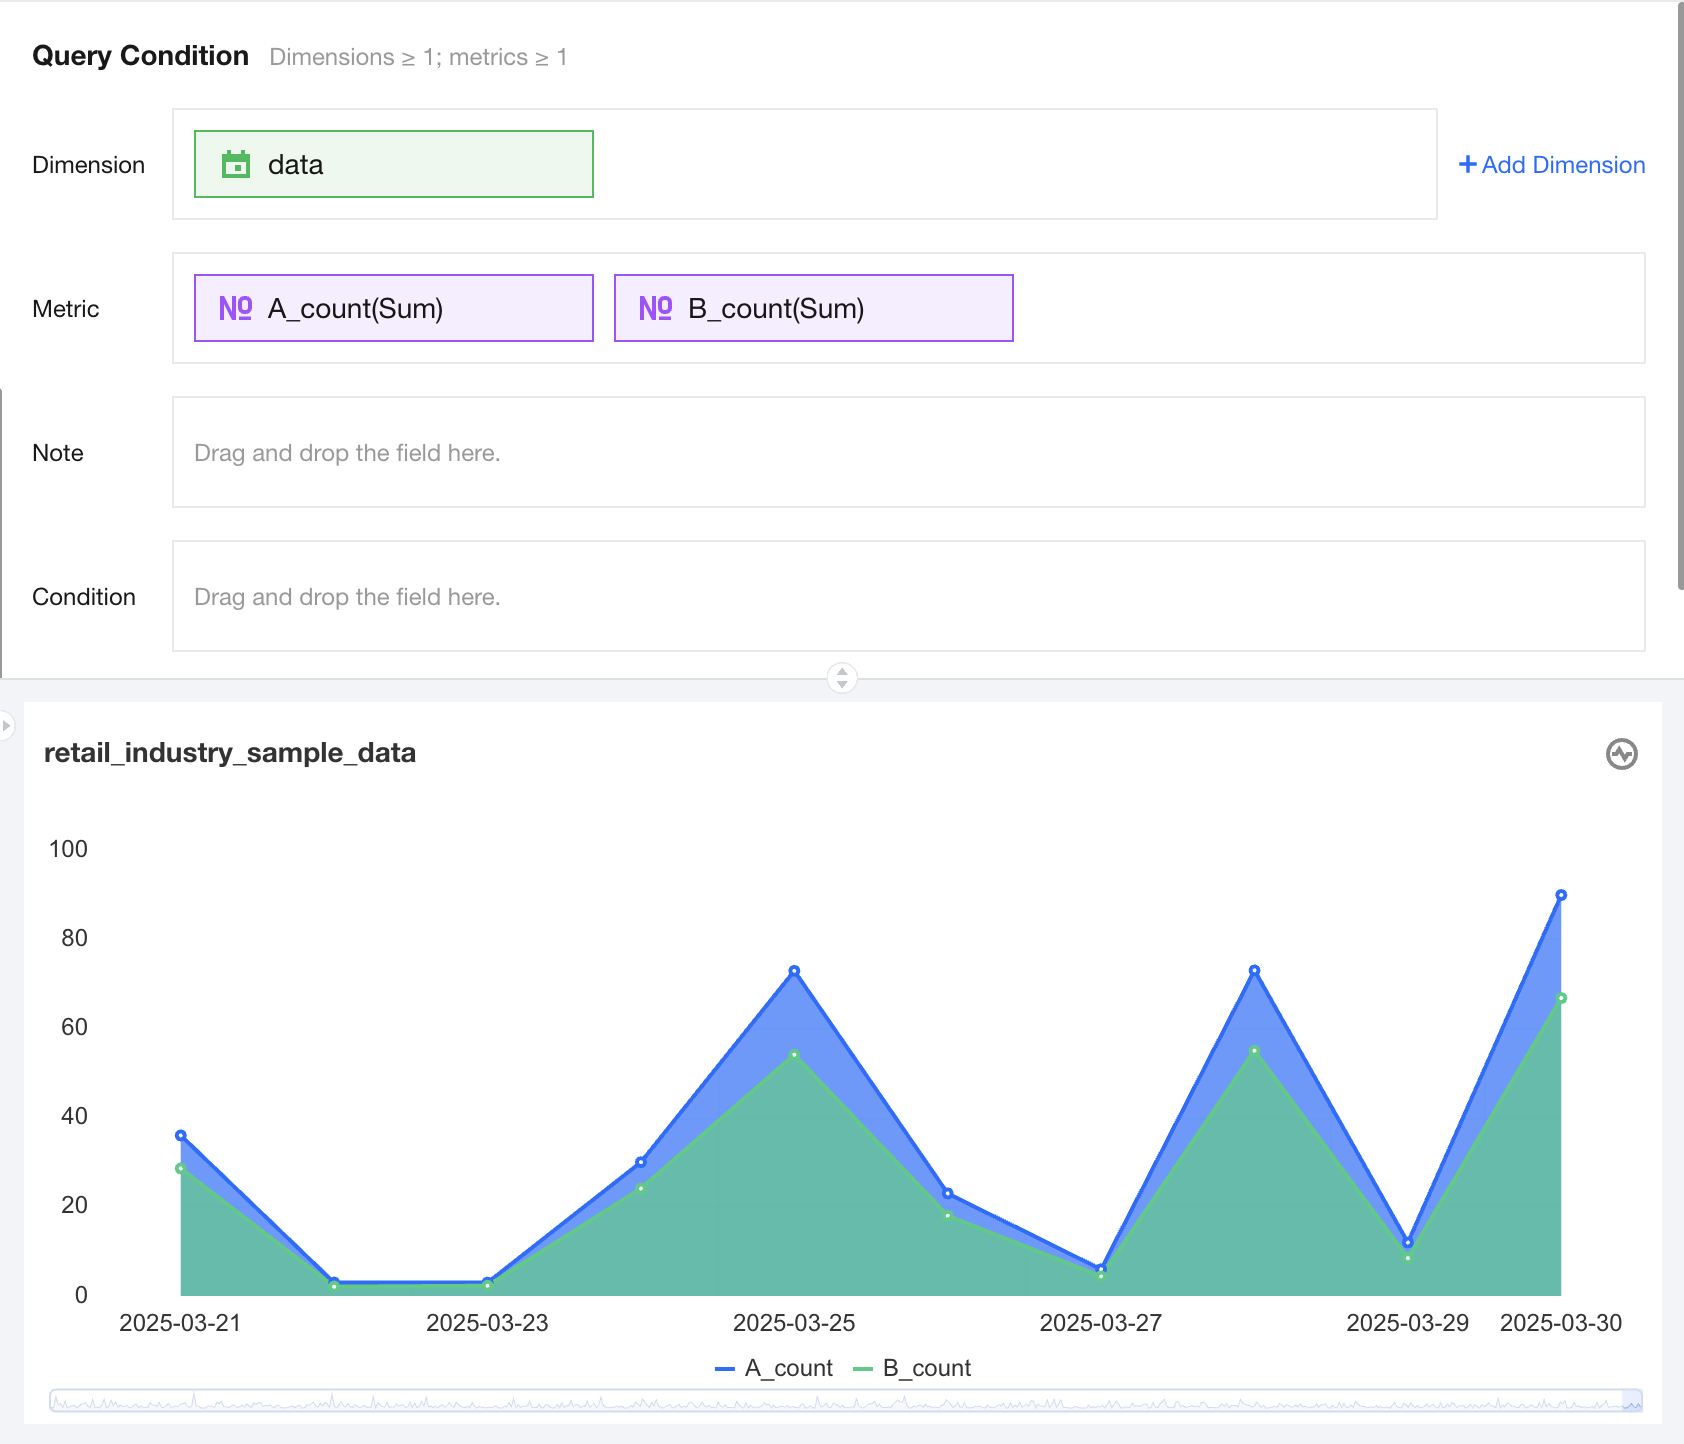
You can further supplement the analysis of existing dimensions by adding a dimension sub-axis. The following shows sales trend data for different categories, where each line represents the sales trend over time for a category name, and each line is distinguished by color.
The condition section allows filtering data by dragging and dropping time, character, or numeric value fields.
The immediate analysis button can trigger the chart's data update display, and you can set the maximum display of XX results (0-10000) on the right.
Component Style Settings
The line chart supports the following component style settings:
Setting Item
Setting Category
Setup Instructions
line type
Line/curve
Customizable line chart line type as Line or curve
Title
Display
Enable/Disable Chart Title Display
Main Title
Set Chart Main Title
horizontal position
Set the horizontal position of the title display, such as left, center, or right.
numeric display
Value Type
Set the numeric display type, with three types to select: 1. Standard numerical value: such as "1211", shown as "1211" 2. Percentage: such as "0.11", shown as "11%" 3. Thousands separator: such as "1211", shown as "1,211"
value unit
Set the numeric display unit, with the following units to select: 1. None 2. Ten thousand: such as "121112", shown as 12.111 ten thousand, analogous for the following units 3. Million 4. Ten million 5. Hundred million 6. One billion 7. Billions of
Decimal places retained
Set the number of decimal places for numeric values, such as "1211.2334". If set to retain 2 decimal places, it will display as "1211.23".
Tag
Display
Enable/Disable Tag Display
data name
If needed, display data name can be enabled
Data value.
If needed, display numeric value can be enabled. Normally, display tag is enabled, and data value must be enabled simultaneously.
Legend
Display
Enable/Disable Legend Display
toward
Set the legend arrangement direction, with horizontal and vertical options
align alignment
Set the legend alignment mode, with left, center, and right options
Position
Set the legend position, with top, center, and bottom options
Area zoom
Intelligent Display Do not display
Intelligent area zoom based on size and dimension count Display chart title: turn on/off
Coordinate axis settings
Display Y-axis
Show/hide Y-axis
Display Y-axis Title
Set whether to display Y-axis Title
Y-axis text count
Set Y-axis text count
Y-axis line count
Set Y-axis line count
Display X-axis
Show/hide X-axis
Display X-axis title
Set whether to display X-axis title
X-axis text count
Set X-axis text count
X-axis line count
Set X-axis line count
Area Chart
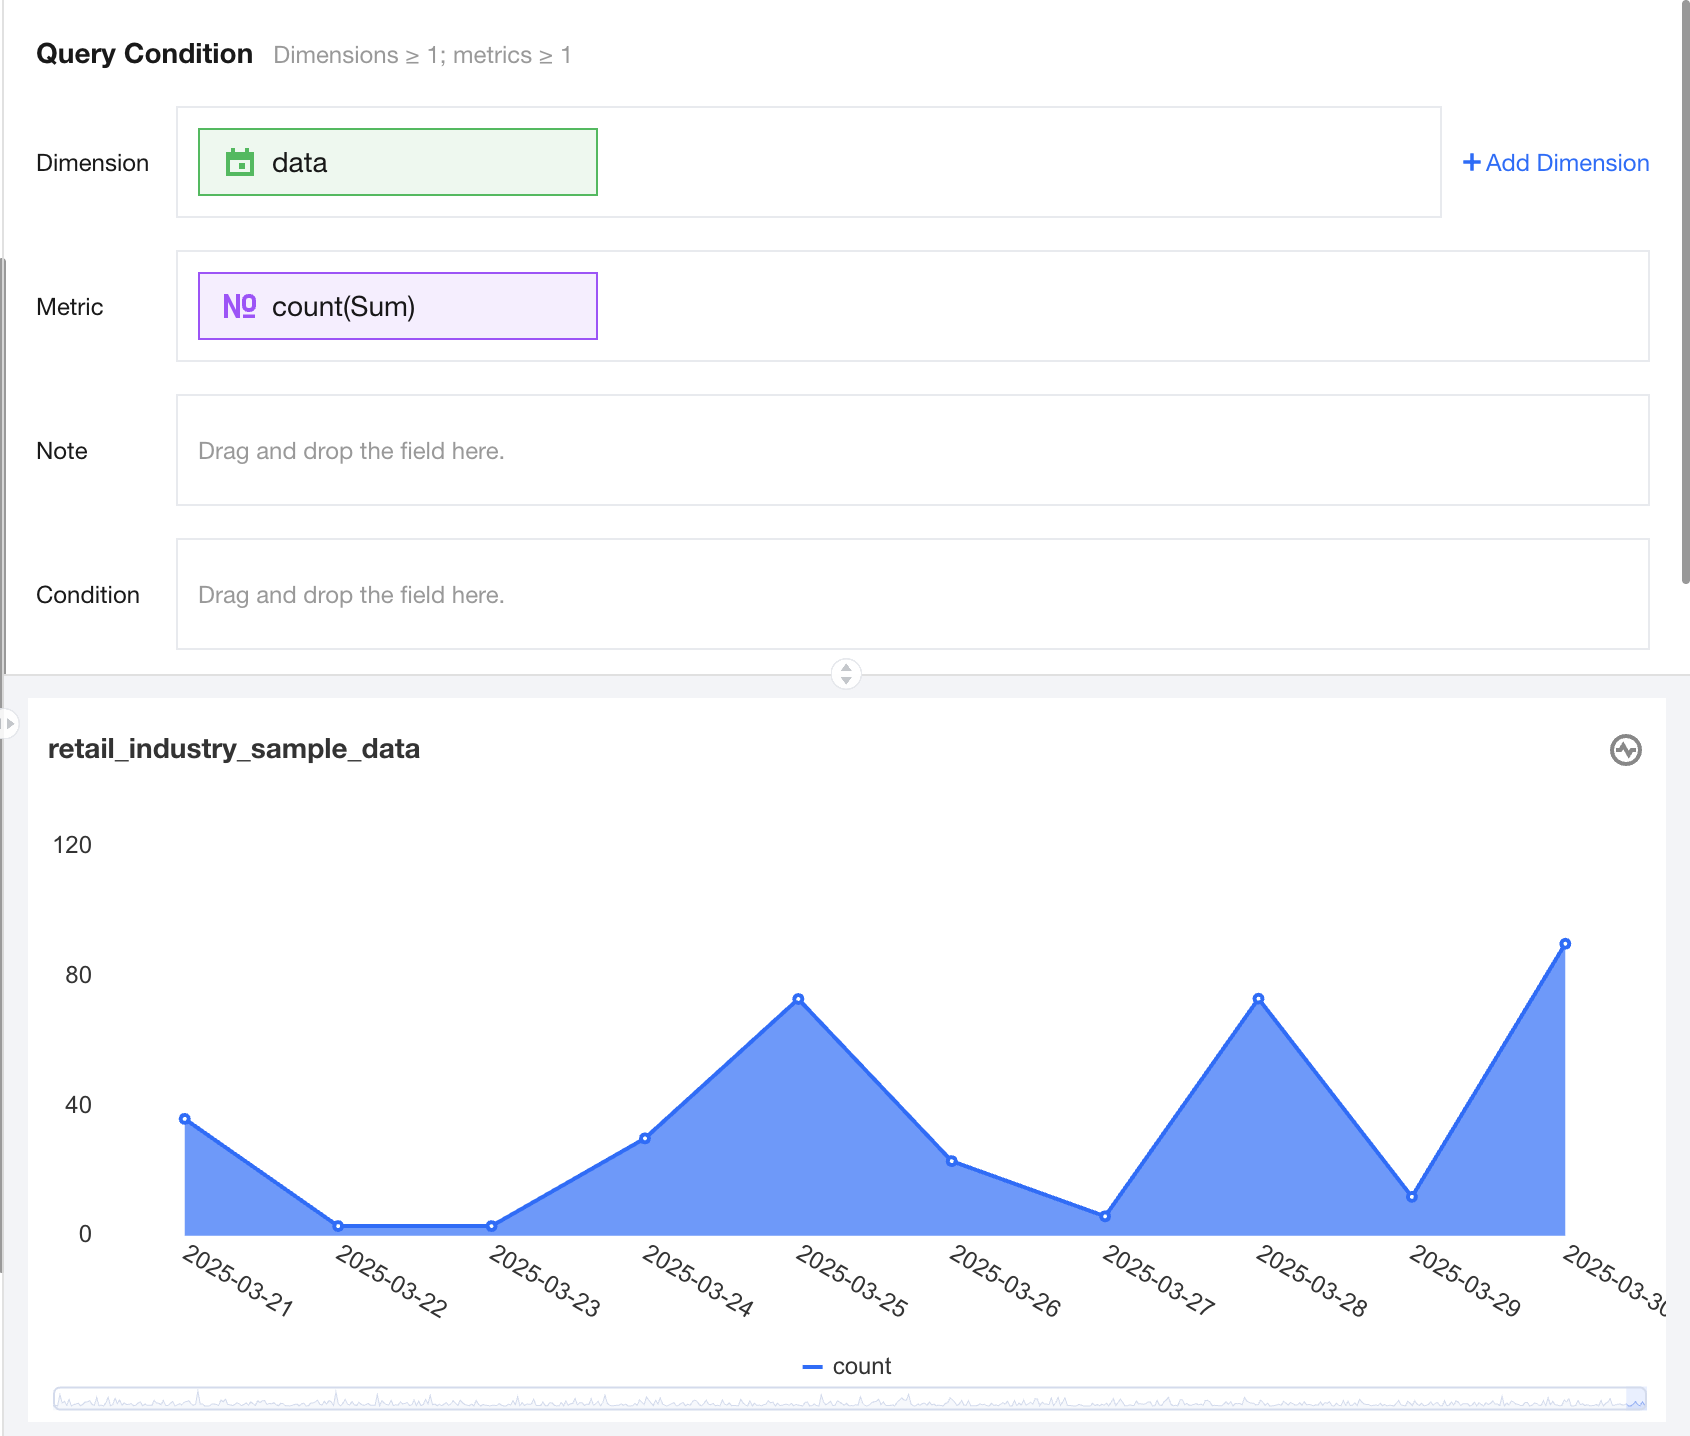
The area chart is mainly used to display data trends and the proportion of area they occupy within a certain period. The following shows sales trend data over time.
Query Condition Settings
Dimensions & Metrics Requirements: Dimensions >=1, Metrics >=1.
You can perform supplementary analysis on existing dimensions by adding a dimension sub-axis. The following shows sales trend data for different categories. Each Line Area represents a category's sales trend over time, with each Line Area distinguished by color.
The condition section allows filtering data by dragging and dropping time, character, or numeric value fields.
The immediate analysis button can trigger the chart's data update display, and you can set the maximum display of XX results (0-10000) on the right.
Component Style Settings
The area chart supports the following component style settings.
Setting Item
Setting Category
Setup Instructions
line type
Line/curve
Customizable line chart line type as Line or curve
Title
Display
Enable/Disable Chart Title Display
Main Title
Set Chart Main Title
horizontal position
Set the horizontal position of the title display, such as left, center, or right.
numeric display
Value Type
Set the numeric display type, with three types to select: 1. Standard numerical value: such as "1211", shown as "1211" 2. Percentage: such as "0.11", shown as "11%" 3. Thousands separator: such as "1211", shown as "1,211"
value unit
Set the numeric display unit, with the following units to select: 1. None 2. Ten thousand: such as "121112", shown as 12.111 ten thousand, analogous for the following units 3. Million 4. Ten million 5. Hundred million 6. One billion 7. Billions of
Decimal places retained
Set the number of decimal places for numeric values, such as "1211.2334". If set to retain 2 decimal places, it will display as "1211.23".
Tag
Display
Enable/Disable Tag Display
data name
If needed, display data name can be enabled
Data value.
If needed, display numeric value can be enabled. Normally, display tag is enabled, and data value must be enabled simultaneously.
Legend
Display
Enable/Disable Legend Display
toward
Set the legend arrangement direction, with horizontal and vertical options
align alignment
Set the legend alignment mode, with left, center, and right options
Position
Set the legend position, with top, center, and bottom options
Area zoom
Intelligent Display Do not display
Intelligent area zoom based on size and dimension count Display chart title: turn on/off
Coordinate axis settings
Display Y-axis
Show/hide Y-axis
Display Y-axis Title
Set whether to display Y-axis Title
Y-axis text count
Set Y-axis text count
Y-axis line count
Set Y-axis line count
Display X-axis
Show/hide X-axis
Display X-axis title
Set whether to display X-axis title
X-axis text count
Set X-axis text count
X-axis line count
Set X-axis line count
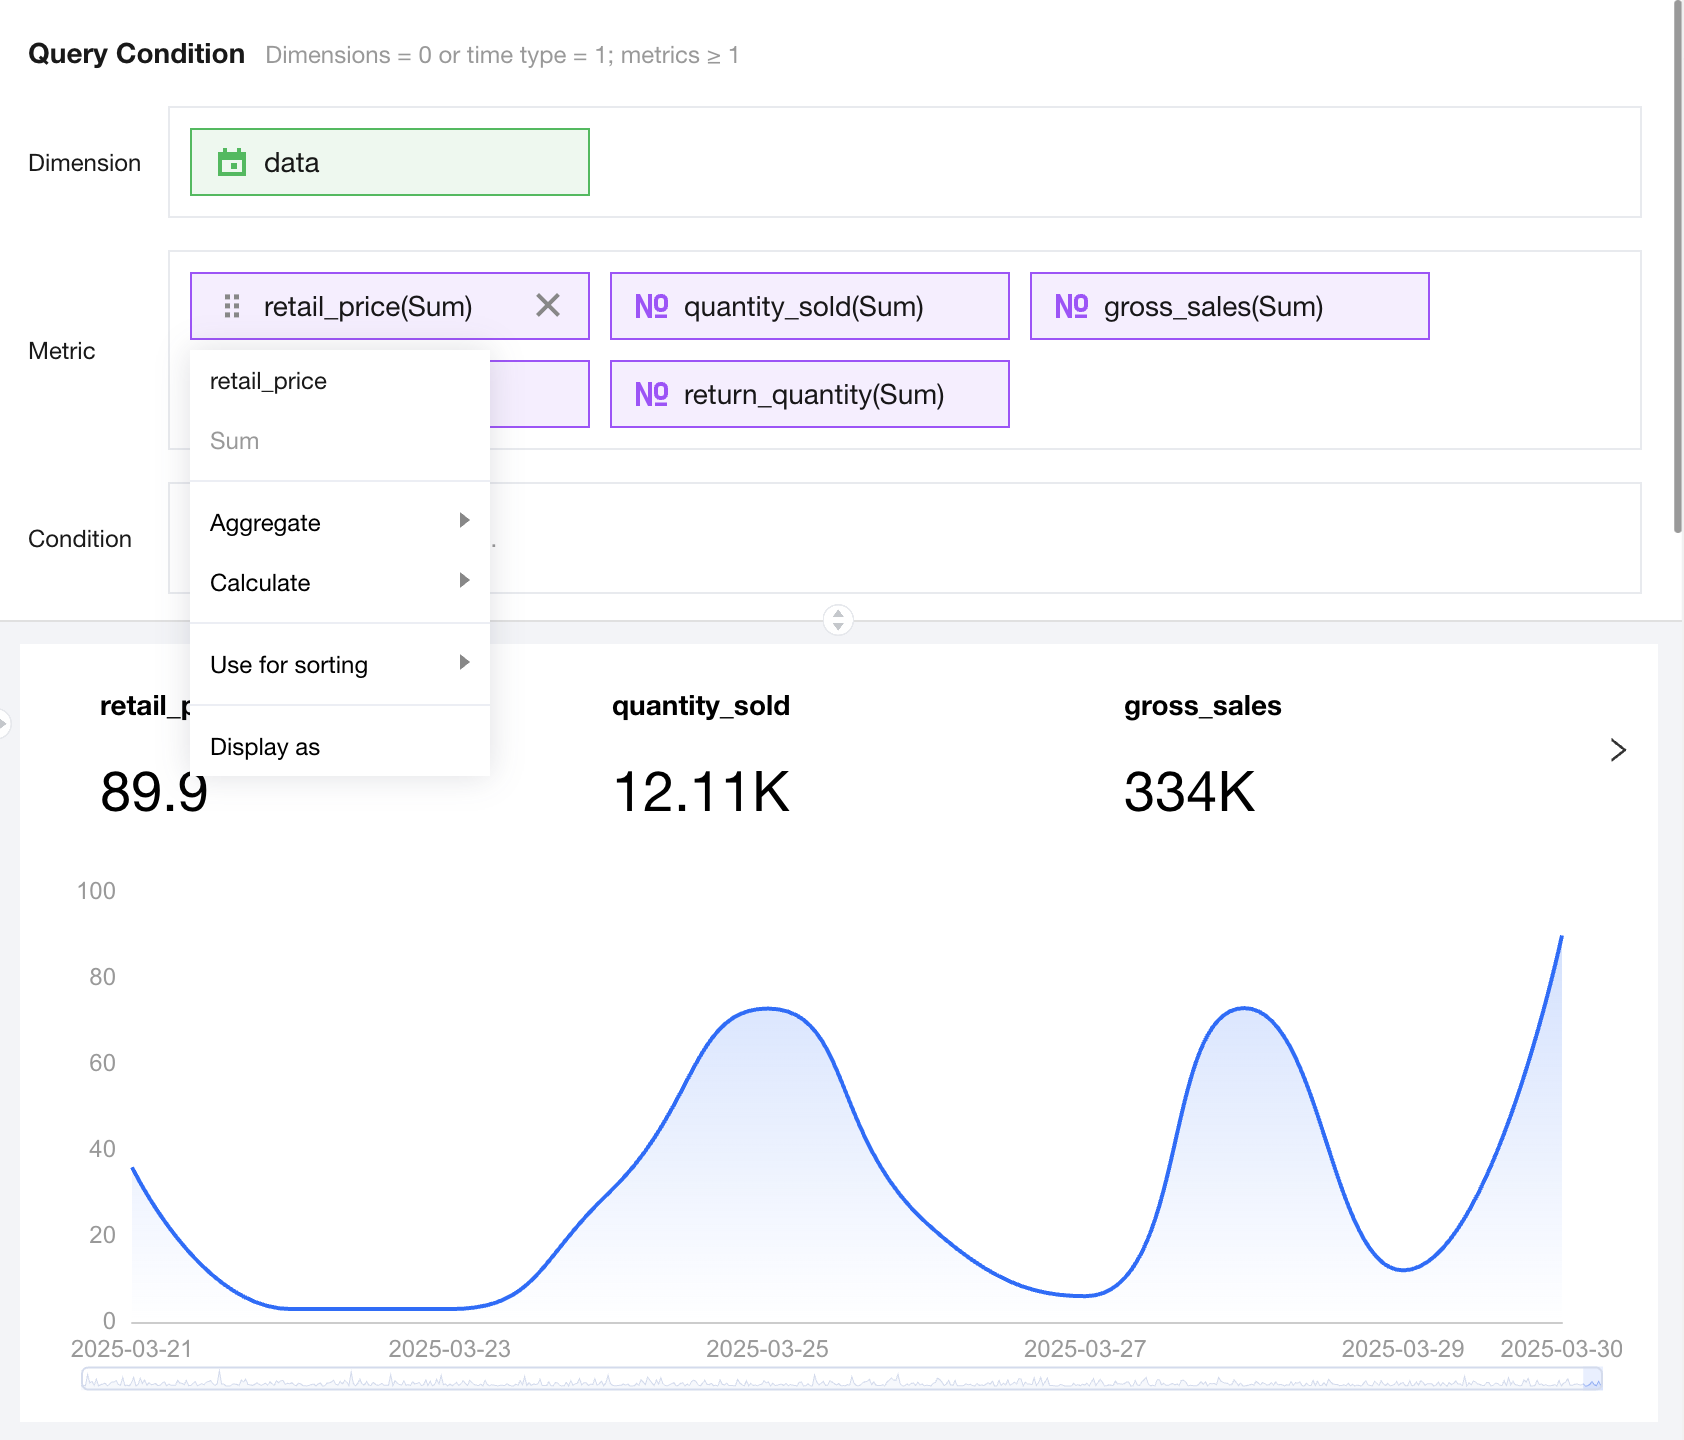
Metric Card & Metric Trend Chart
The indicator trend chart is often used to show changes in multiple metrics for a period of time. It helps quickly determine whether there is a business anomaly based on metric changes. As shown in the figure below, the statistics display the total sales volume metric data.
Query Condition Settings
Dimension & metric count requirements: dimension=0 or 1 time type, metrics≥1.
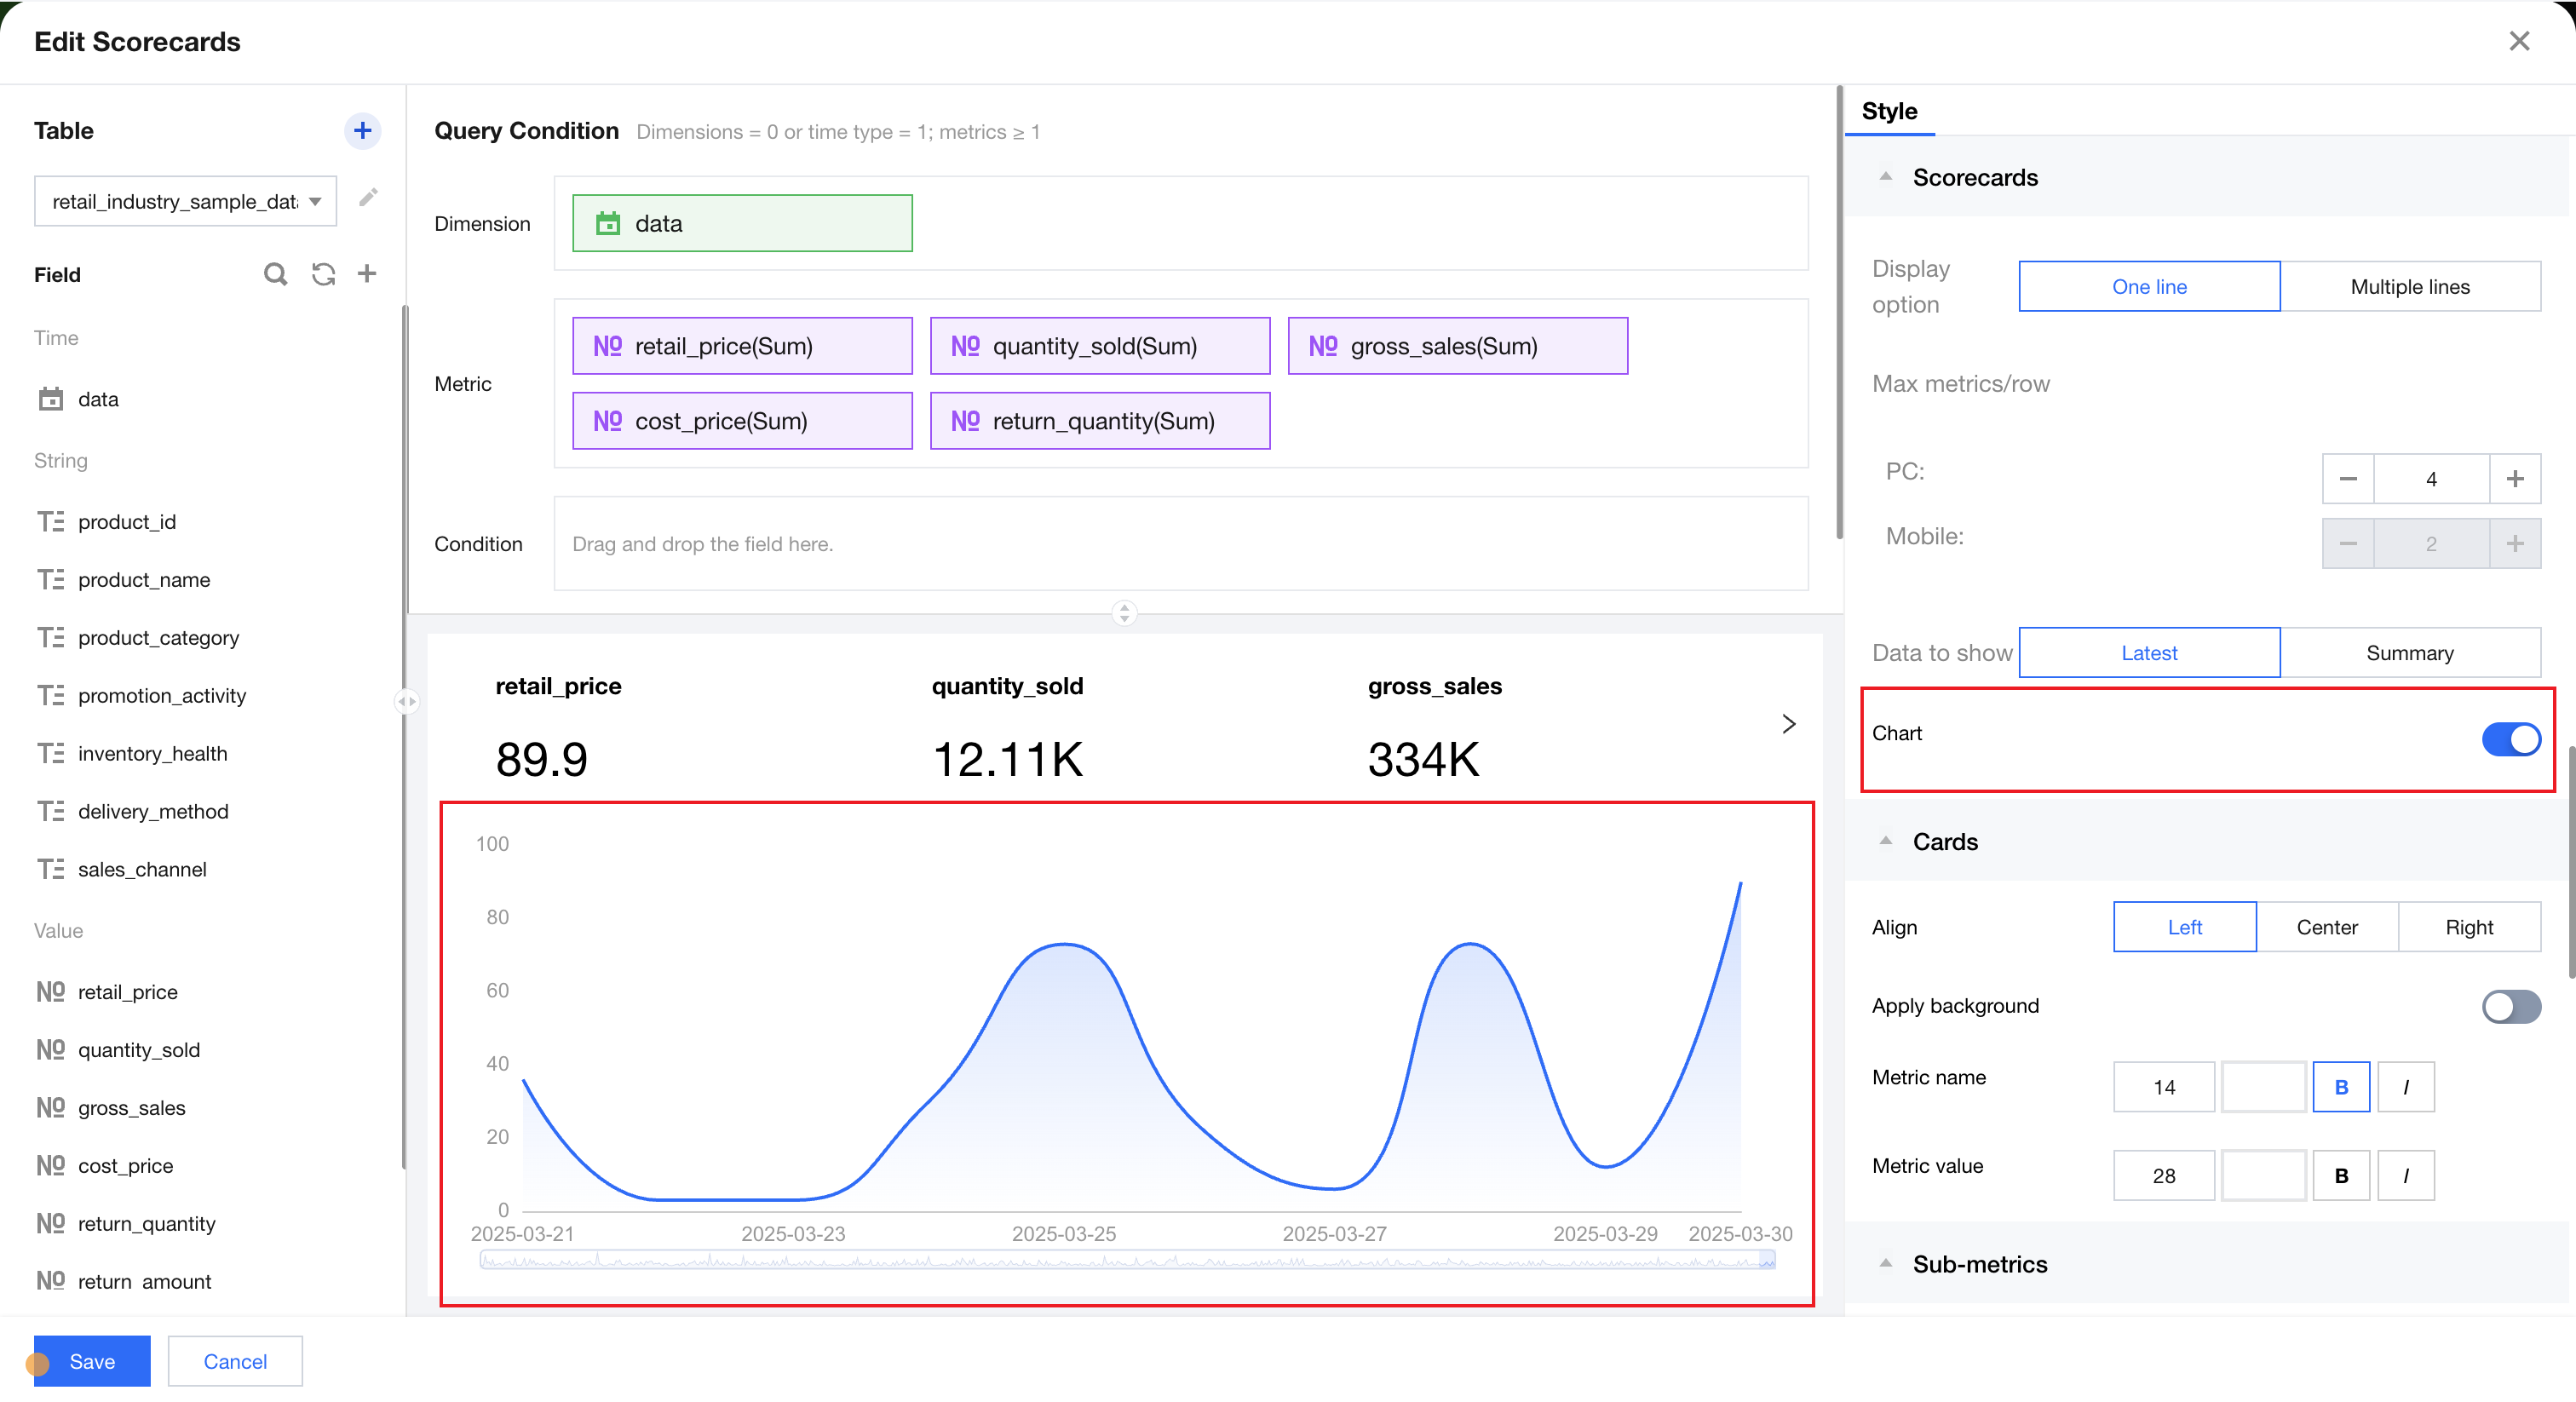
A time type field can be added to the dimension. Enabling the trend chart in the style allows adding trend chart data below the metric card, as shown in the figure below, which displays the monthly trend data of the sales metric.
The condition section allows filtering data by dragging and dropping time, character, or numeric value fields.
The immediate analysis button can trigger the chart's data update display, and you can set the maximum display of XX results (0-10000) on the right.
Style Settings
The metric card supports the following component style settings:
Setting Item
Setting Category
Setup Instructions
alignment mode
Left-aligned/Centered/Right-aligned
Set the display position of metric card metrics to left-aligned/centered/right-aligned
trend chart
Enable / Disable
Enable / Disable metric trend chart
indicator display
Latest Summary
When the dimension area is configured with a time field, you can set metrics to show the latest metric data or aggregated data.
Rendering Method
carousel
Set the rendering method to carousel/block-level
Title
Display
Enable/Disable Chart Title Display
Main Title
Set Chart Main Title
horizontal position
Set the horizontal position of the title display, such as left, center, or right.
numeric display
Value Type
Set the numeric display type, with three types to select: 1. Standard numerical value: such as "1211", shown as "1211" 2. Percentage: such as "0.11", shown as "11%" 3. Thousands separator: such as "1211", shown as "1,211"
value unit
Set the numeric display unit, with the following units to select: 1. None 2. Ten thousand: such as "121112", shown as 12.111 ten thousand, analogous for the following units 3. Million 4. Ten million 5. Hundred million 6. One billion 7. Billions of
Decimal places retained
Set the number of decimal places for numeric values, such as "1211.2334". If set to retain 2 decimal places, it will display as "1211.23".
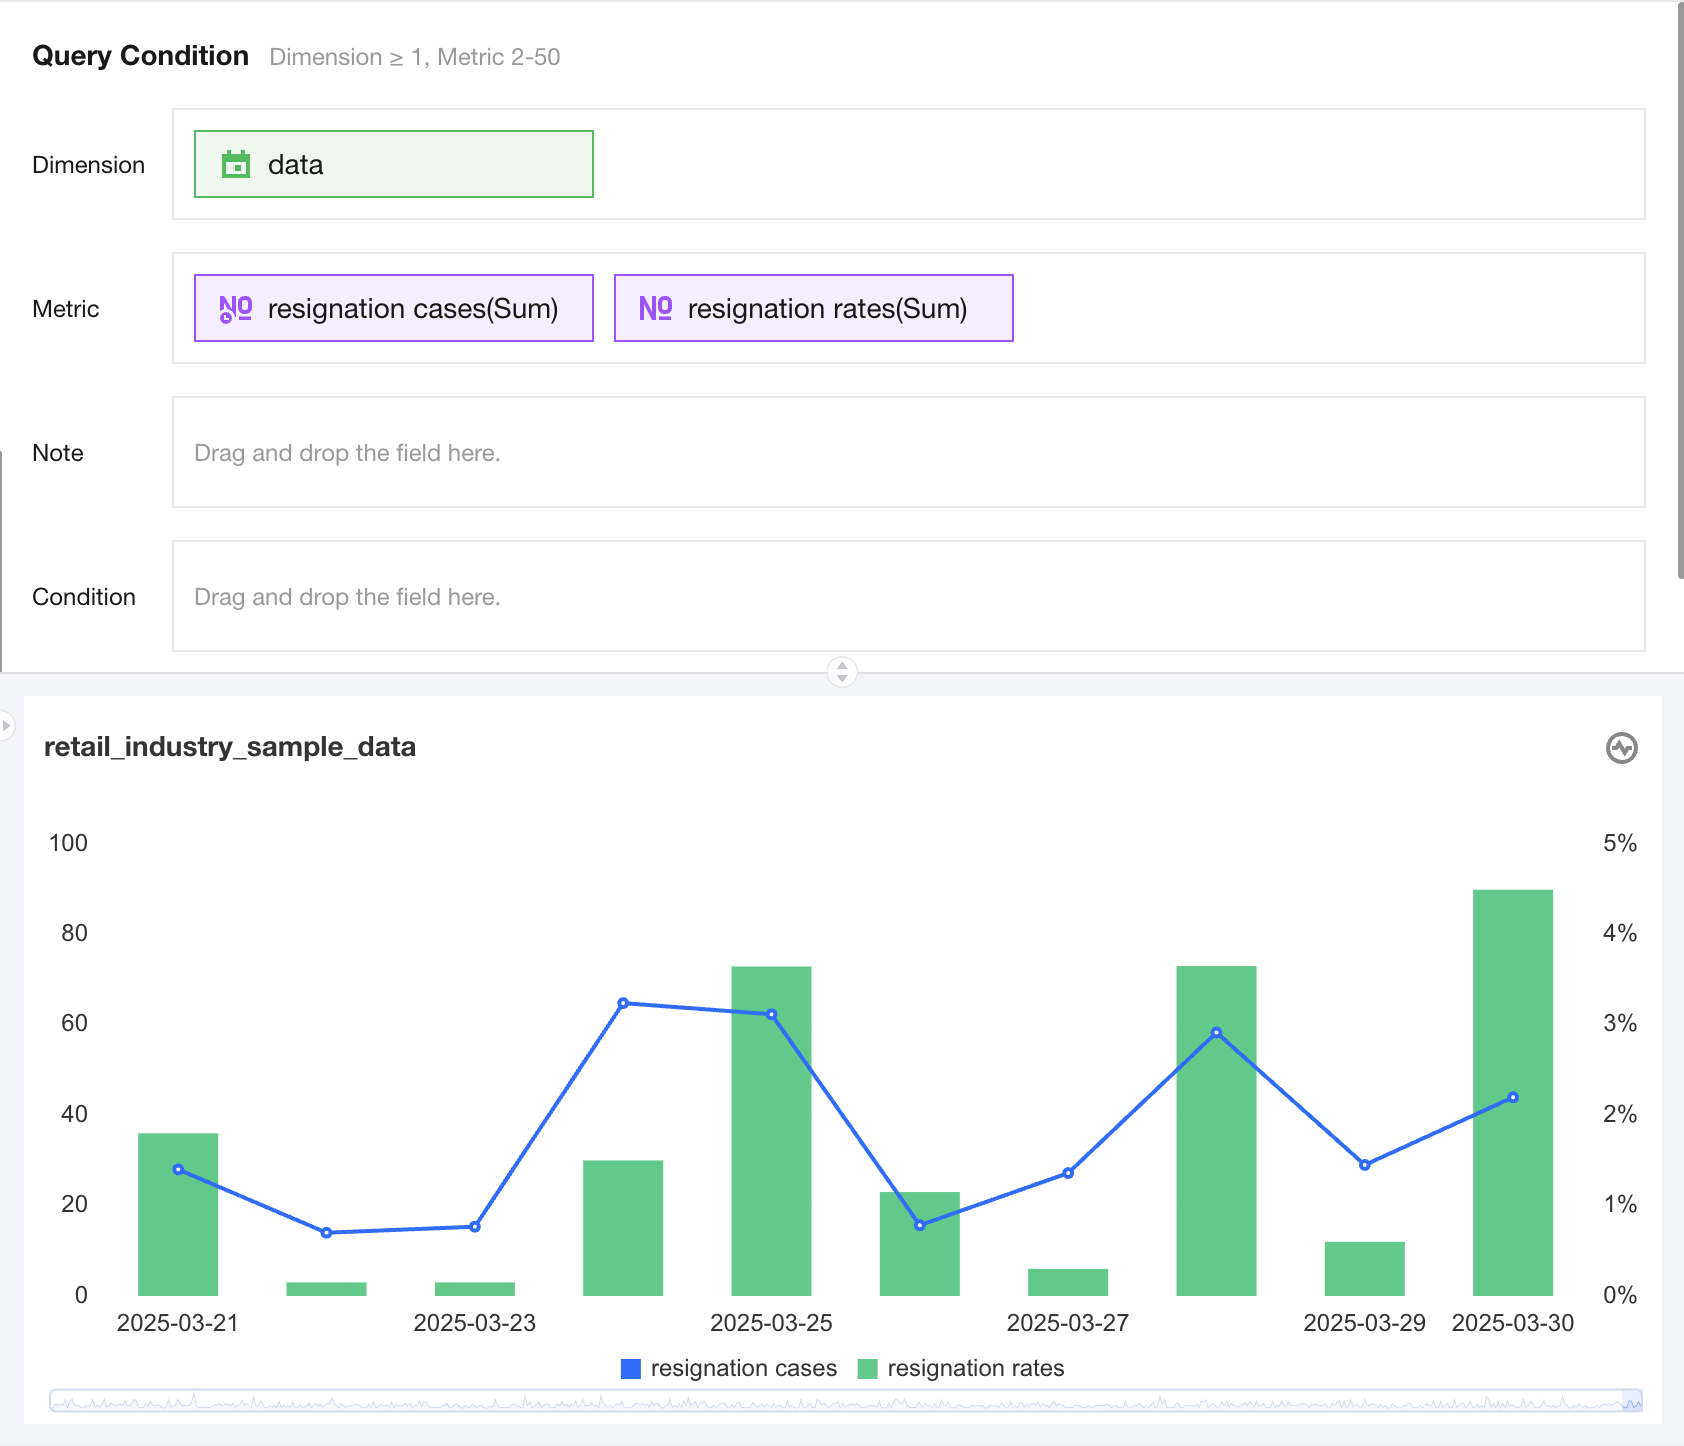
Mixed column and line chart
Bar charts are mainly used to show data of different scales through dual axes. They support composite line and bar charts in complex scenarios, such as the left axis showing resignation cases and the right axis displaying resignation rates.
Query Condition Settings
Dimension & metric count requirements: dimension >=1, metrics 2-6. Conditions can be filtered by dragging and dropping time, character, or numeric value fields in the condition section. The immediate analysis button triggers chart data update display, with maximum display of XX results (0-1000) configurable on the right.
Style Settings
Setting Item
Setting Category
Setup Instructions
line type
Line/curve
Set area chart line type as Line or curve
Combo chart settings
Line/Bar
Set metrics display type to Line/Bar
Title
Display
Enable/Disable Chart Title Display
Main Title
Set Chart Main Title
horizontal position
Set the horizontal position of the title display, such as left, center, or right.
numeric display
Value Type
Set the numeric display type, with three types to select: 1. Standard numerical value: such as "1211", shown as "1211" 2. Percentage: such as "0.11", shown as "11%" 3. Thousands separator: such as "1211", shown as "1,211"
value unit
Set the numeric display unit, with the following units to select: 1. None 2. Ten thousand: such as "121112", shown as 12.111 ten thousand, analogous for the following units 3. Million 4. Ten million 5. Hundred million 6. One billion 7. Billions of
Decimal places retained
Set the number of decimal places for numeric values, such as "1211.2334". If set to retain 2 decimal places, it will display as "1211.23".
Tag
Display
Enable/Disable Tag Display
data name
If needed, display data name can be enabled
Data value.
If needed, display numeric value can be enabled. Normally, display tag is enabled, and data value must be enabled simultaneously.
Legend
Display
Enable/Disable Legend Display
toward
Set the legend arrangement direction, with horizontal and vertical options
align alignment
Set the legend alignment mode, with left, center, and right options
Position
Set the legend position, with top, center, and bottom options
Area zoom
Intelligent Display Do not display
Intelligent area zoom based on size and dimension count Display chart title: turn on/off
Coordinate axis settings
Display X-axis
Show/hide X-axis
Display X-axis title
Set whether to display X-axis title
X-axis text count
Set X-axis text count
X-axis line count
Set X-axis line count
Display content
Support setting whether to display axis title, axis text
Coordinate format
Support setting the text format of the coordinate axis based on the current axis metric. The numeric format of axis text will display according to the metric format.
Coordinate value interval
Support setting the minimum and maximum value of the coordinate axis, for example, to show only sales data between 1 million and 3 million.
Number of intervals
Support setting how many intervals to retain between the minimum and maximum values of the coordinate axis. The larger the value, the smaller the distance between intervals.