tencent cloud

Tencent Cloud Observability Platform

Release Notes and Announcements
Release Notes
Product Introduction
Overview
Strengths
Basic Features
Basic Concepts
Use Cases
Use Limits
Purchase Guide
Tencent Cloud Product Monitoring
Application Performance Management
Mobile App Performance Monitoring
Real User Monitoring
Cloud Automated Testing
Prometheus Monitoring
Grafana
EventBridge
PTS
Quick Start
Monitoring Overview
Instance Group
Tencent Cloud Product Monitoring
Application Performance Management
Real User Monitoring
Cloud Automated Testing
Performance Testing Service
Prometheus Getting Started
Grafana
Dashboard Creation
EventBridge
Alarm Service
Cloud Product Monitoring
Tencent Cloud Service Metrics
Operation Guide
CVM Agents
Cloud Product Monitoring Integration with Grafana
Troubleshooting
Practical Tutorial
Application Performance Management
Product Introduction
Access Guide
Operation Guide
Practical Tutorial
Parameter Information
FAQs
Mobile App Performance Monitoring
Overview
Operation Guide
Access Guide
Practical Tutorial
Tencent Cloud Real User Monitoring
Product Introduction
Operation Guide
Connection Guide
FAQs
Cloud Automated Testing
Product Introduction
Operation Guide
FAQs
Performance Testing Service
Overview
Operation Guide
Practice Tutorial
JavaScript API List
FAQs
Prometheus Monitoring
Product Introduction
Access Guide
Operation Guide
Practical Tutorial
Terraform
FAQs
Grafana
Product Introduction
Operation Guide
Guide on Grafana Common Features
FAQs
Dashboard
Overview
Operation Guide
Alarm Management
Console Operation Guide
Troubleshooting
FAQs
EventBridge
Product Introduction
Operation Guide
Practical Tutorial
FAQs
Report Management
FAQs
General
Alarm Service
Concepts
Monitoring Charts
CVM Agents
Dynamic Alarm Threshold
CM Connection to Grafana
Documentation Guide
Related Agreements
Application Performance Management Service Level Agreement
APM Privacy Policy
APM Data Processing And Security Agreement
RUM Service Level Agreement
Mobile Performance Monitoring Service Level Agreement
Cloud Automated Testing Service Level Agreement
Prometheus Service Level Agreement
TCMG Service Level Agreements
PTS Service Level Agreement
PTS Use Limits
Cloud Monitor Service Level Agreement
API Documentation
History
Introduction
API Category
Making API Requests
Monitoring Data Query APIs
Alarm APIs
Legacy Alert APIs
Notification Template APIs
TMP APIs
Grafana Service APIs
Event Center APIs
TencentCloud Managed Service for Prometheus APIs
Monitoring APIs
Data Types
Error Codes
Glossary

Free Trial Introduction

PDF
Focus Mode
Font Size
Last updated: 2024-10-14 09:39:12
TencentCloud Managed Service for Prometheus (TMP) offers a 15-day free trial to help new users understand and use Prometheus. This trial is supported in multiple cities, both domestically and internationally. You are welcome to experience it.

Directions

1. log in to TMP Console.
2. On the Prometheus monitoring page, click Free trial to jump to the corresponding purchase page.
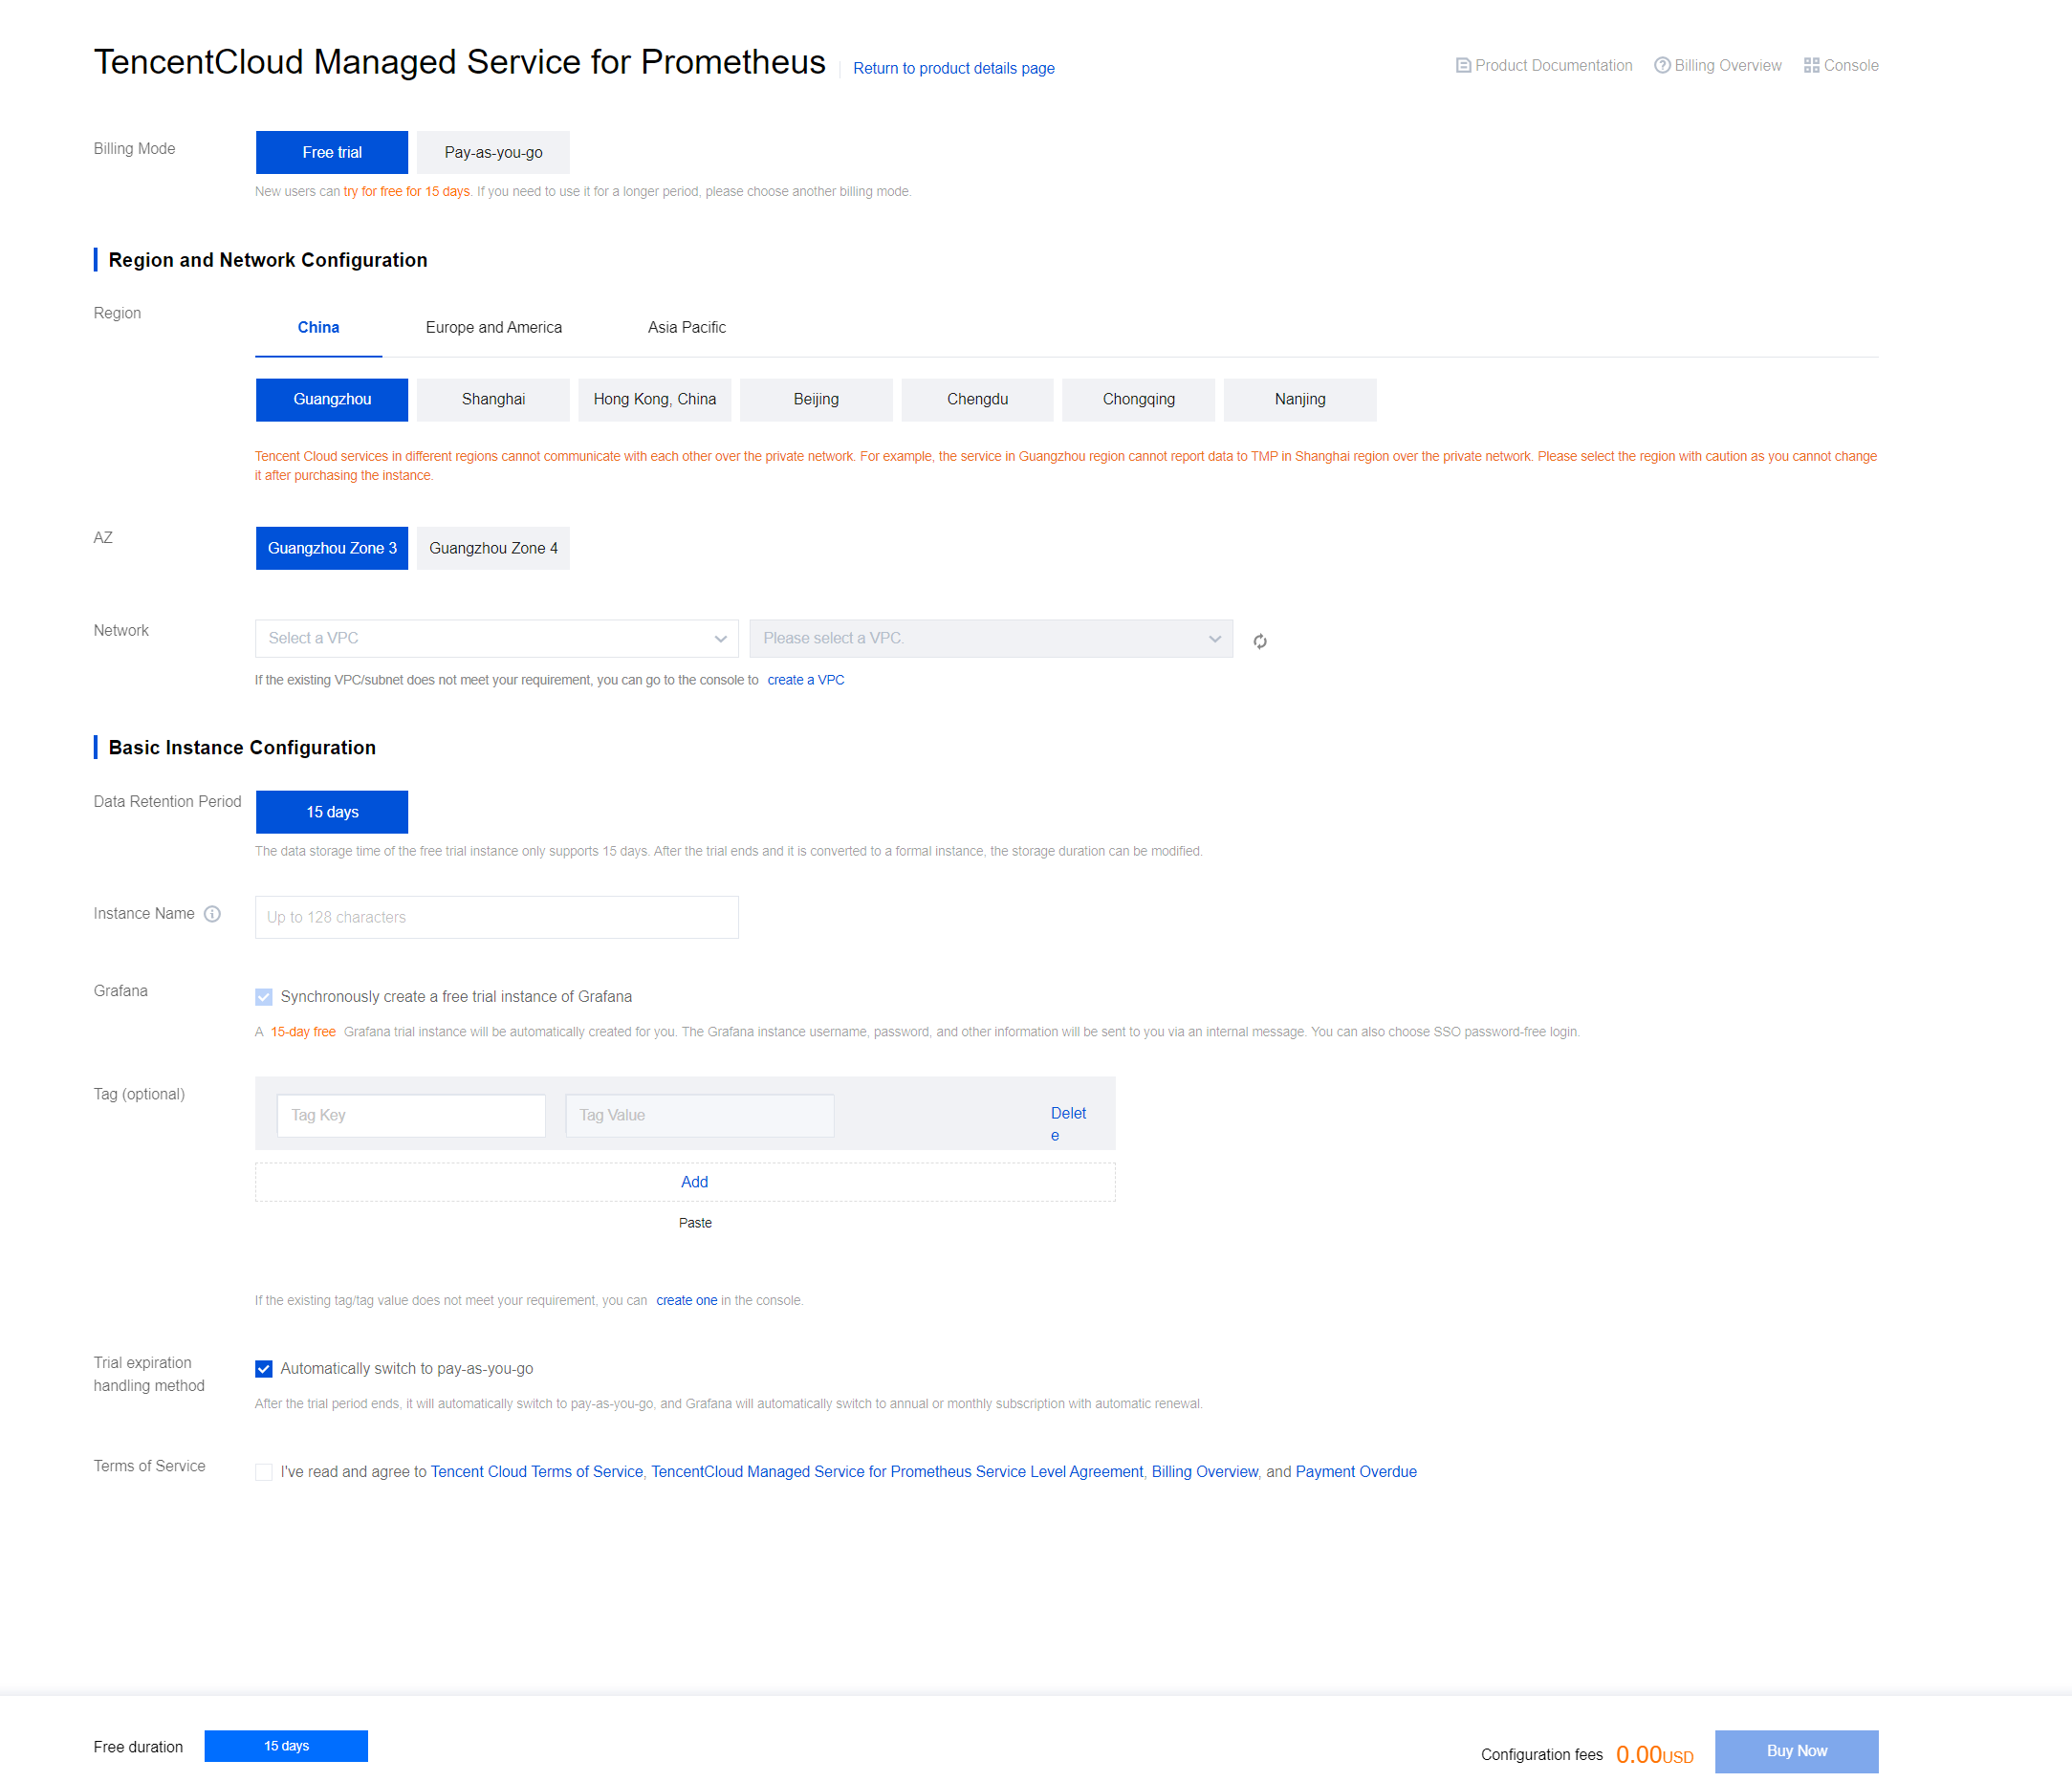
3. On the purchase page, fill in the required information, select terms and conditions, and click Buy Now to start the trial.


Configuration Instructions

Configuration Type
Configuration Item
Description
Billing mode
Free trial
New users can enjoy a 15-day free trial. If you need to use it for a longer period, please choose a different billing model.
Data storage duration
15 days
The data storage period for the free trial instance is limited to 15 days. After the trial and conversion to a formal instance, the storage duration can be modified.
Grafana
Create free trial Grafana instances simultaneously
Selected by default. A free 15-day Grafana trial instance will be automatically created for you. Grafana instance username, password, and other information will be sent to you via the Message Center. You can also choose SSO for password-free login.
Trial expiry handling method
Automatically convert to Pay-As-You-Go
Selected by default. The trial will automatically convert to a Pay-As-You-Go model after the trial, and Grafana will switch to an annual/monthly automatic renewal.
If you deselect it manually, the service will be stopped upon expiration.
Note:
The maximum limit for Series of the free trial instance is 2 million, and the total data points reported per second cannot exceed 100,000. For more detailed limit descriptions, see Related Limits.

Instance Information

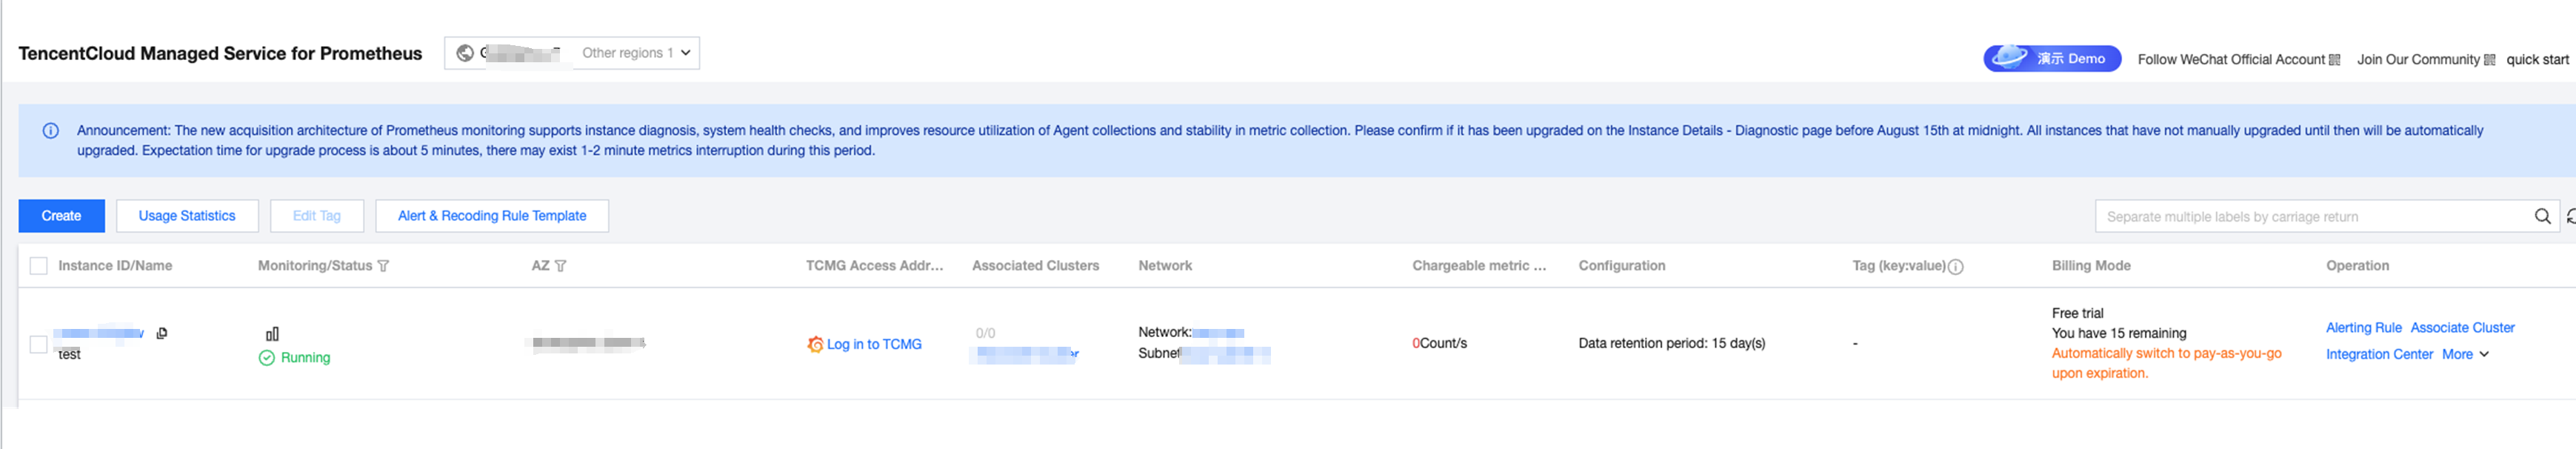
1. After successfully purchasing the instance, you can be redirected to the instance list page, as shown in the figure below:


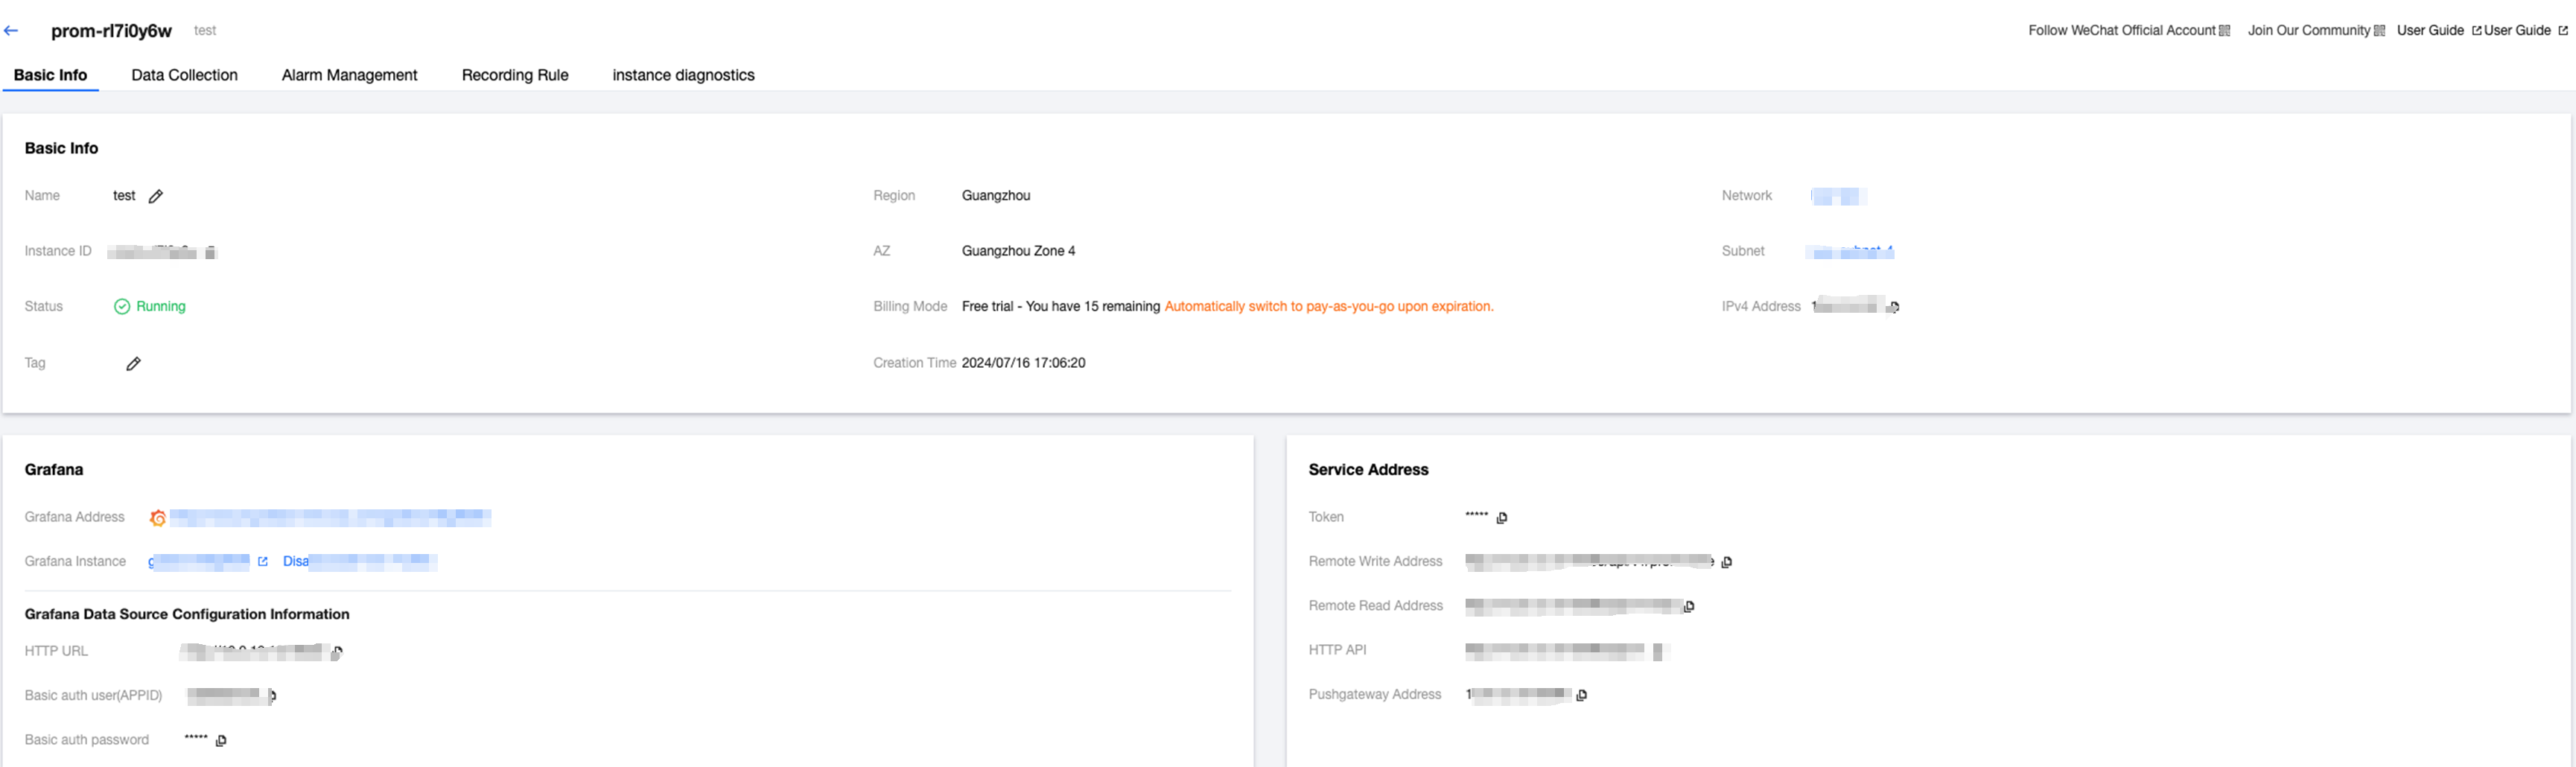
2. Click the instance ID/name to enter the instance details page.


Help and Support

Was this page helpful?

Help us improve! Rate your documentation experience in 5 mins.

Feedback