tencent cloud

Tencent Cloud Observability Platform

Release Notes and Announcements
Release Notes
Product Introduction
Overview
Strengths
Basic Features
Basic Concepts
Use Cases
Use Limits
Purchase Guide
Tencent Cloud Product Monitoring
Application Performance Management
Mobile App Performance Monitoring
Real User Monitoring
Cloud Automated Testing
Prometheus Monitoring
Grafana
EventBridge
PTS
Quick Start
Monitoring Overview
Instance Group
Tencent Cloud Product Monitoring
Application Performance Management
Real User Monitoring
Cloud Automated Testing
Performance Testing Service
Prometheus Getting Started
Grafana
Dashboard Creation
EventBridge
Alarm Service
Cloud Product Monitoring
Tencent Cloud Service Metrics
Operation Guide
CVM Agents
Cloud Product Monitoring Integration with Grafana
Troubleshooting
Practical Tutorial
Application Performance Management
Product Introduction
Access Guide
Operation Guide
Practical Tutorial
Parameter Information
FAQs
Mobile App Performance Monitoring
Overview
Operation Guide
Access Guide
Practical Tutorial
Tencent Cloud Real User Monitoring
Product Introduction
Operation Guide
Connection Guide
FAQs
Cloud Automated Testing
Product Introduction
Operation Guide
FAQs
Performance Testing Service
Overview
Operation Guide
Practice Tutorial
JavaScript API List
FAQs
Prometheus Monitoring
Product Introduction
Access Guide
Operation Guide
Practical Tutorial
Terraform
FAQs
Grafana
Product Introduction
Operation Guide
Guide on Grafana Common Features
FAQs
Dashboard
Overview
Operation Guide
Alarm Management
Console Operation Guide
Troubleshooting
FAQs
EventBridge
Product Introduction
Operation Guide
Practical Tutorial
FAQs
Report Management
FAQs
General
Alarm Service
Concepts
Monitoring Charts
CVM Agents
Dynamic Alarm Threshold
CM Connection to Grafana
Documentation Guide
Related Agreements
Application Performance Management Service Level Agreement
APM Privacy Policy
APM Data Processing And Security Agreement
RUM Service Level Agreement
Mobile Performance Monitoring Service Level Agreement
Cloud Automated Testing Service Level Agreement
Prometheus Service Level Agreement
TCMG Service Level Agreements
PTS Service Level Agreement
PTS Use Limits
Cloud Monitor Service Level Agreement
API Documentation
History
Introduction
API Category
Making API Requests
Monitoring Data Query APIs
Alarm APIs
Legacy Alert APIs
Notification Template APIs
TMP APIs
Grafana Service APIs
Event Center APIs
TencentCloud Managed Service for Prometheus APIs
Monitoring APIs
Data Types
Error Codes
Glossary

Data Overview

PDF
Focus Mode
Font Size
Last updated: 2024-11-01 19:29:52
This document describes how to view the data overview.

Prerequisites

Directions

1. Log in to the RUM console.
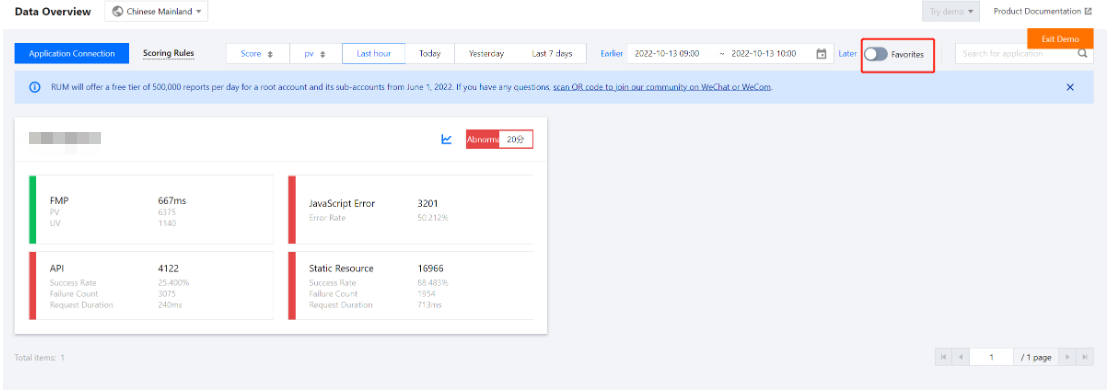
2. On the left sidebar, click Data Overview to enter the data overview page.
3. On the data overview page, you can view the key metric information and overall application score, including PV, FMP, JavaScript errors/error rate, as well as success rate, failure rate, and duration of API or static resource requests. You can toggle on Favorites on the right of the score to favorite the application panel and view all favorited panels quickly. The panels are sorted by the favorite time.


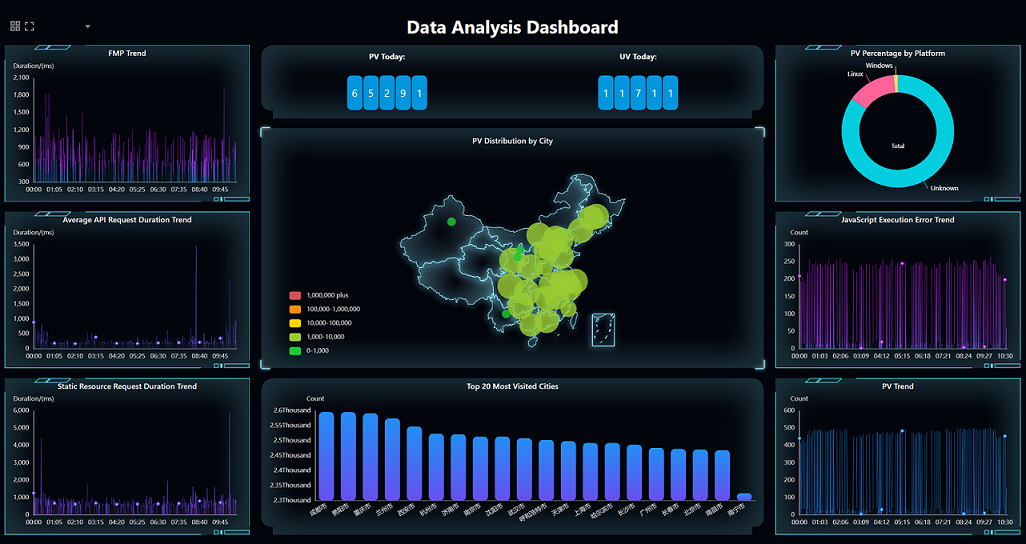
Data Analysis Dashboard

On the data overview page, you can click the line chart icon

in each project module to view the data analysis dashboard.


Scoring rules

The scoring rules and percentage vary by metric as detailed below:
Scoring Metric
Scoring Rules
Percentage
Page error rate (page errors/page opens)
1. If the error rate is not greater than 0.5%, the score will be 100.
2. If the error rate ranges from 0.5% to 10%, the score will be 100 - 10 * error rate.
3. If the error rate is not less than 10%, the score will be 0.
30%
Average page open duration
1. If the duration is not greater than 1,000 ms, the score will be 100.
2. If the duration is greater than 1,000 ms by N 100 ms, the score will be 100 - 10 * N, and the lowest score can be 0.
10%
API success rate (successful API access requests/total access requests)
Same as the rules for the page error rate.
30%
Average API access duration
Same as the rules for the average page open duration.
5%
Static resource request success rate (successful static resource requests/total requests)
Same as the rules for the page error rate.
20%
Average static resource request duration
Same as the rules for the average page open duration.
5%

Descriptions of key application metric colors

Metric Name
Green
Orange
Red
Gray
firstScreenTime
Duration ≤ 1000 ms
1000 ms ≤ duration ≤ 3000 ms
Duration > 3000 ms
Information loss
JavaScript error rate
Error rate ≤ 0.5%
0.5% < error rate < 10%
Error rate ≥ 10%
Information loss
API success rate
Success rate > 99.5%
90% ≤ success rate ≤ 99.5%
Success rate < 90%
Information loss
Static resource success rate
Success rate > 99.5%
90% ≤ success rate ≤ 99.5%
Success rate < 90%
Information loss


Help and Support

Was this page helpful?

Help us improve! Rate your documentation experience in 5 mins.

Feedback