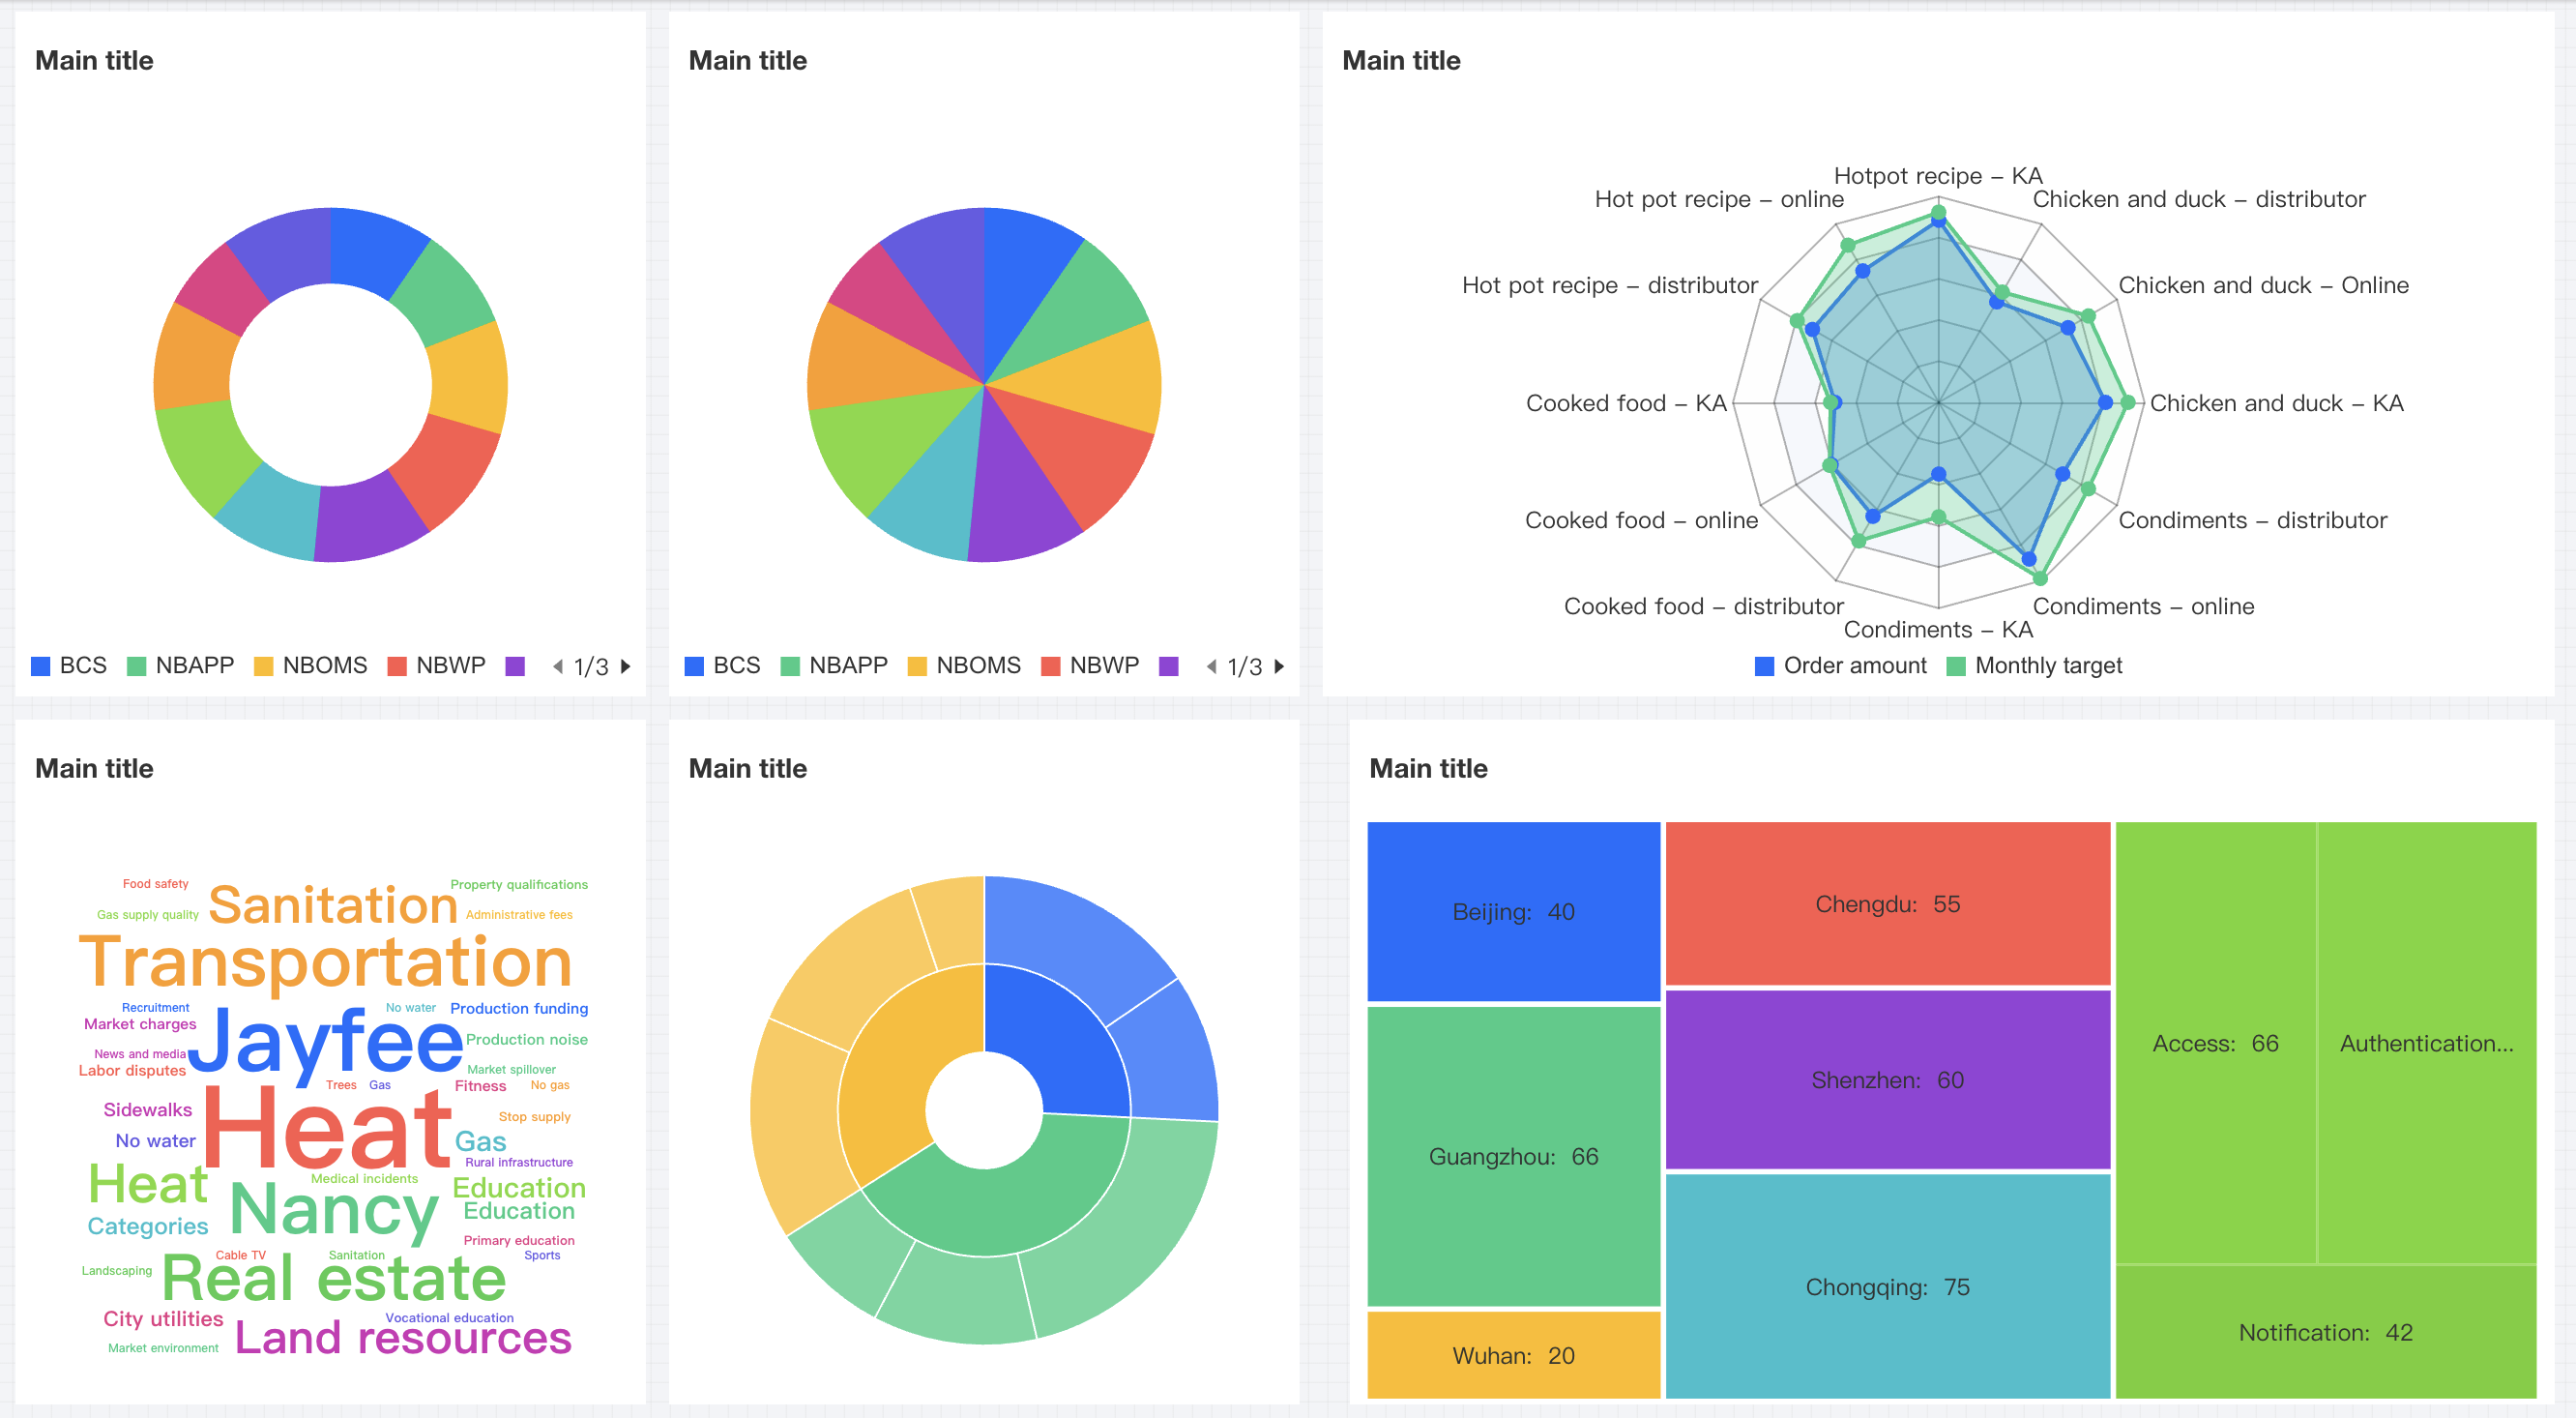
Tencent Cloud Business Intelligence (BI) product supports distribution-type charts, including doughnut charts, pie charts, radar charts, word cloud diagrams, Sunburst Charts, and rectangular tree diagrams. They are mainly used to display size distribution and percentage of total values in data.
Donut Chart
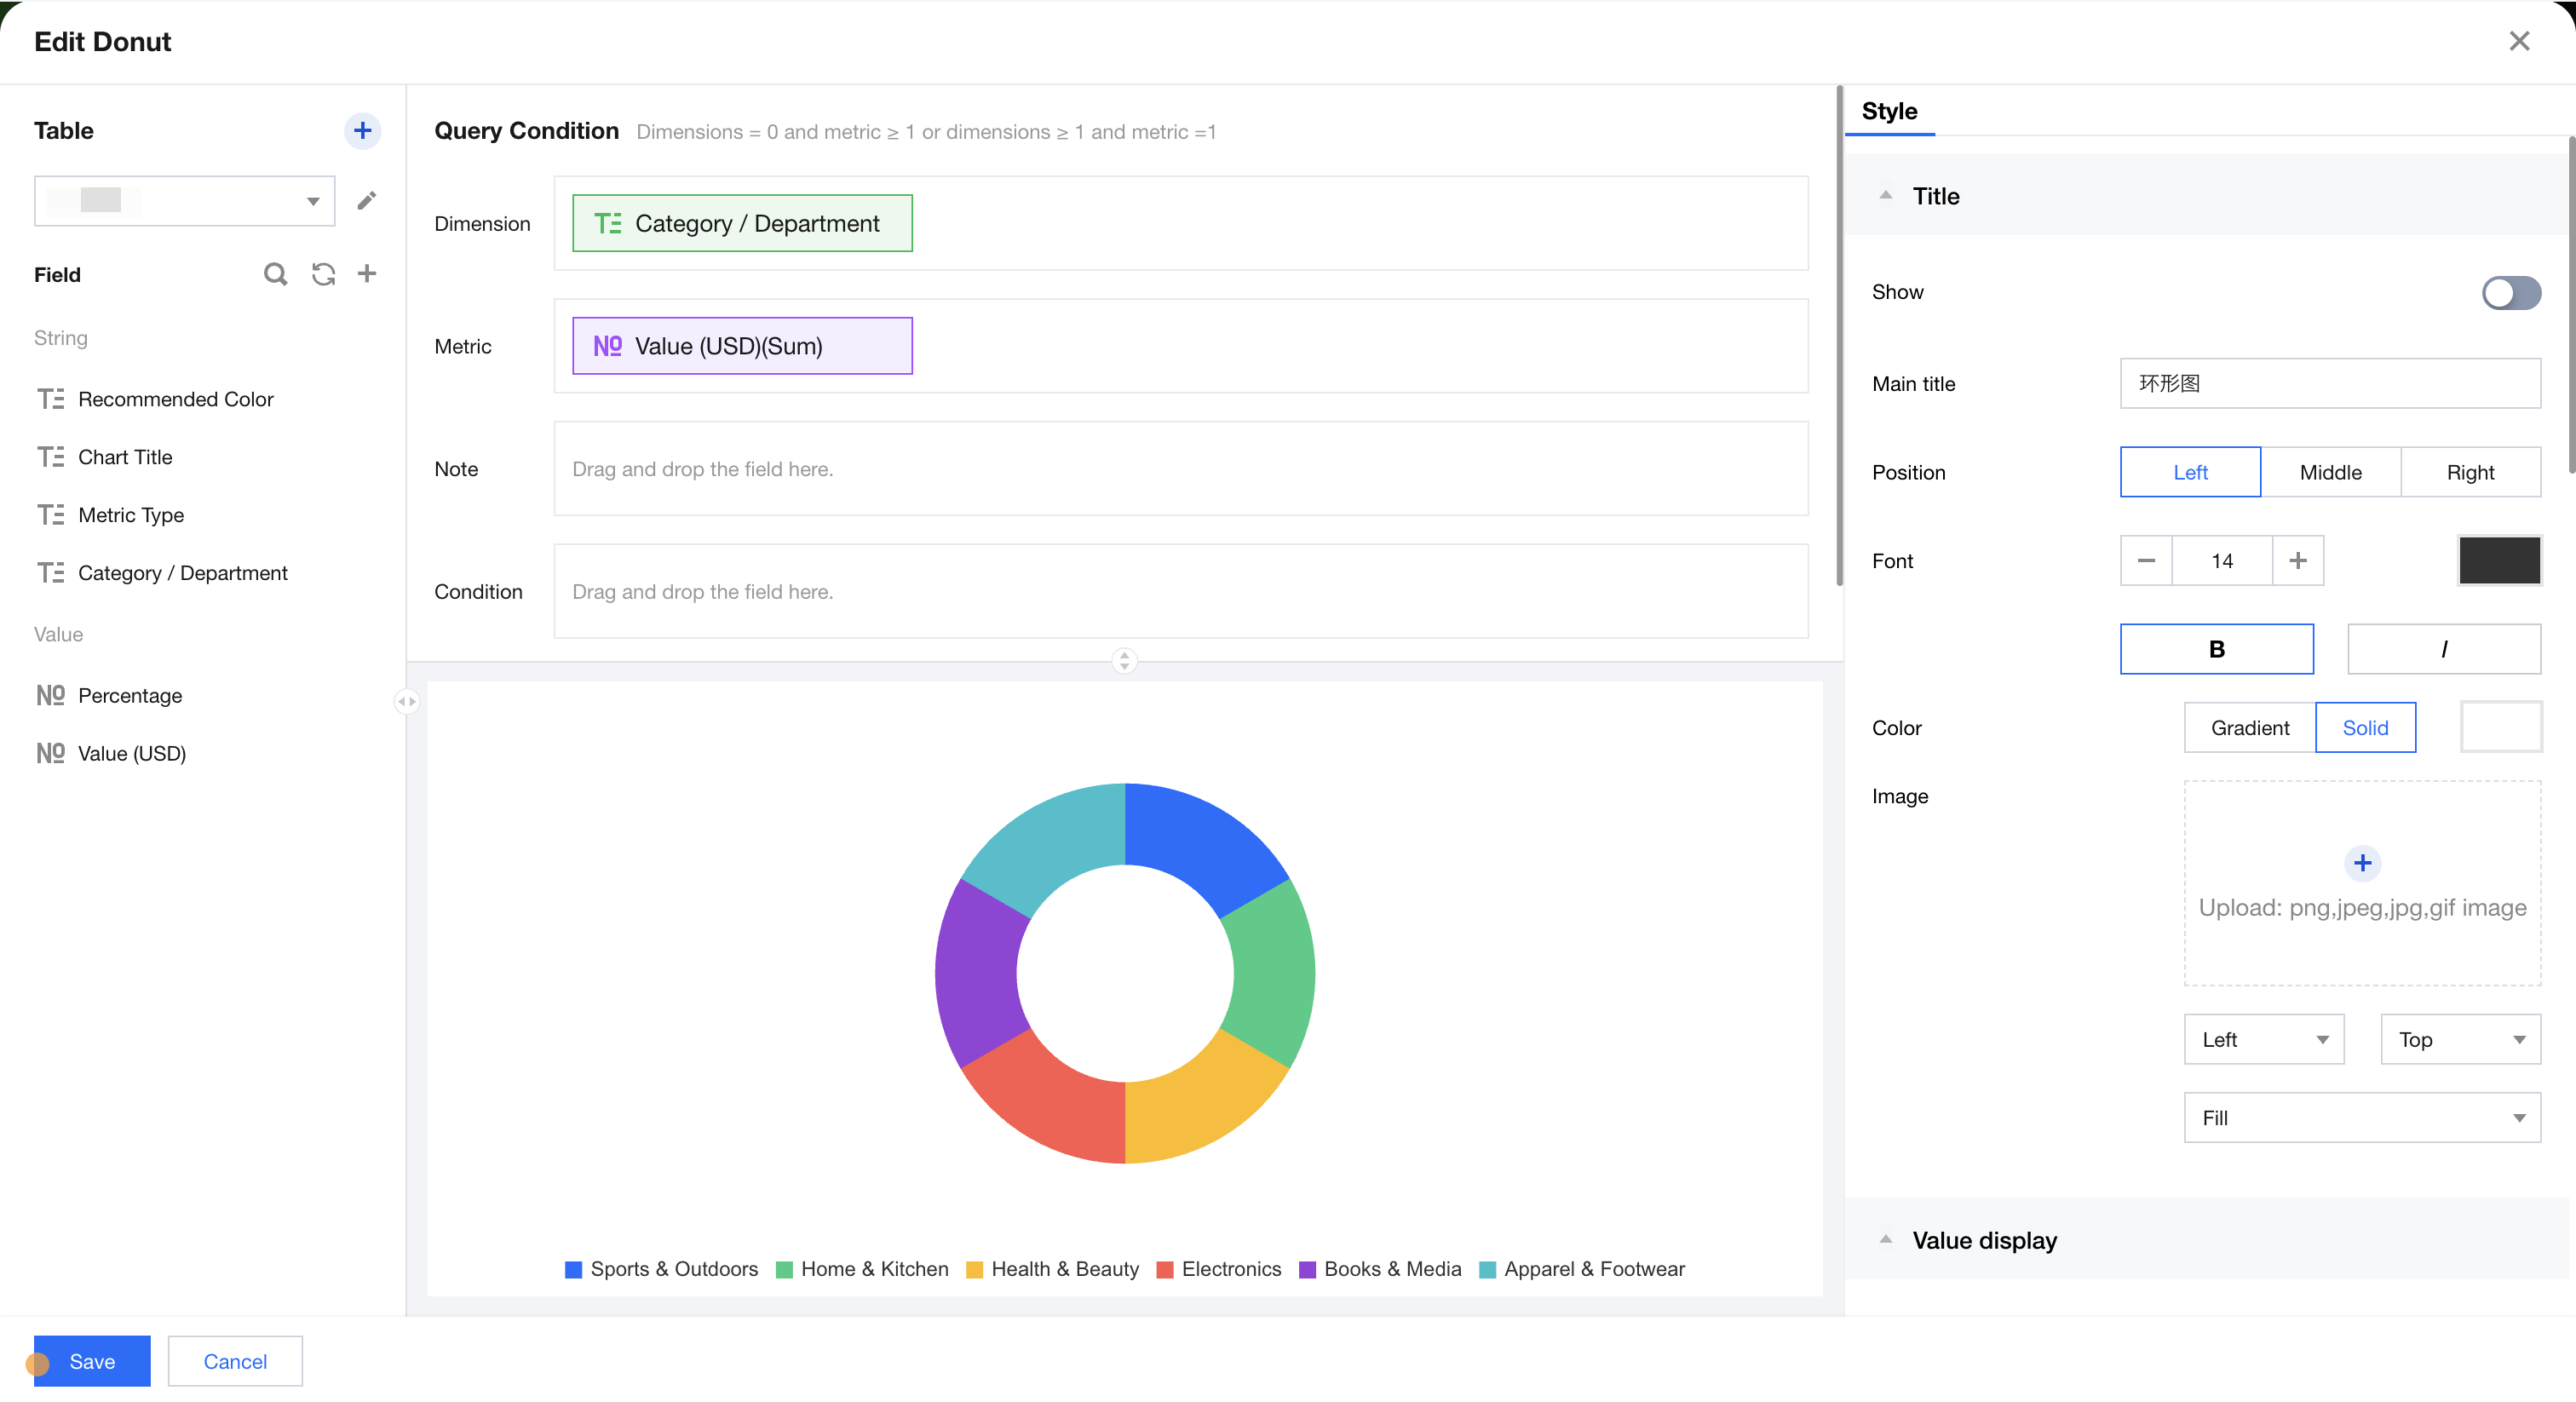
The donut chart is primarily used for showing the size and percentage of total values in data. As shown below, it displays sales distribution data across different categories.
Query Condition Settings
Dimensionality & metric count requirements: dimensionality=0, metrics≥1 or dimensionality≥1, metrics=1. Conditional filtering can be performed by dragging and dropping time, character, or numeric value fields in the condition area. The immediate analysis button triggers chart data updates, with a maximum display of XX results (0-10000) configurable on the right.
Component Style Settings
The donut chart supports the following style settings:
Setting Item
Classification Settings
Setup Instructions
Title
Display
Enable/disable chart title display
Main Title
Set Chart Main Title
horizontal position
Set the horizontal position of the title display, such as left, center, or right.
numeric display
Value Type
Set the numeric display type, with three types to select: 1. Standard numerical value: for example "1211" shows as "1211" 2. Percentage: for example "0.11" shows as "11%" 3. Thousands separator: for example "1211" shows as "1,211"
value unit
Set the value unit, with the following ontions: 1, None 2, Ten thousand: for example. "121112" shows as 12,111 Ten thousand. 3, Million 4, Ten million 5. Hundred million 6. One billion 7. Ten Billion
Decimal places retained
Set the number of decimal places for numeric values. For example, "1211.2334" shows as "1211.23" when set to retain 2 decimal places.
Tags
Display
Enable/disable tag display
data name
To display the data name, you can enable it.
Data value.
To display the numeric value, you can enable it. Normally, enable the tag display, which requires turning on the data value simultaneously.
Percentage
To display percentage data, you can enable it.
Legend
Display
Enable/disable legend display
toward
Set the legend arrangement direction, with horizontal and vertical options
align alignment
Set the legend alignment mode, with left, center, and right options
Position
Set the legend position, with top, center, and bottom options
Pie chart
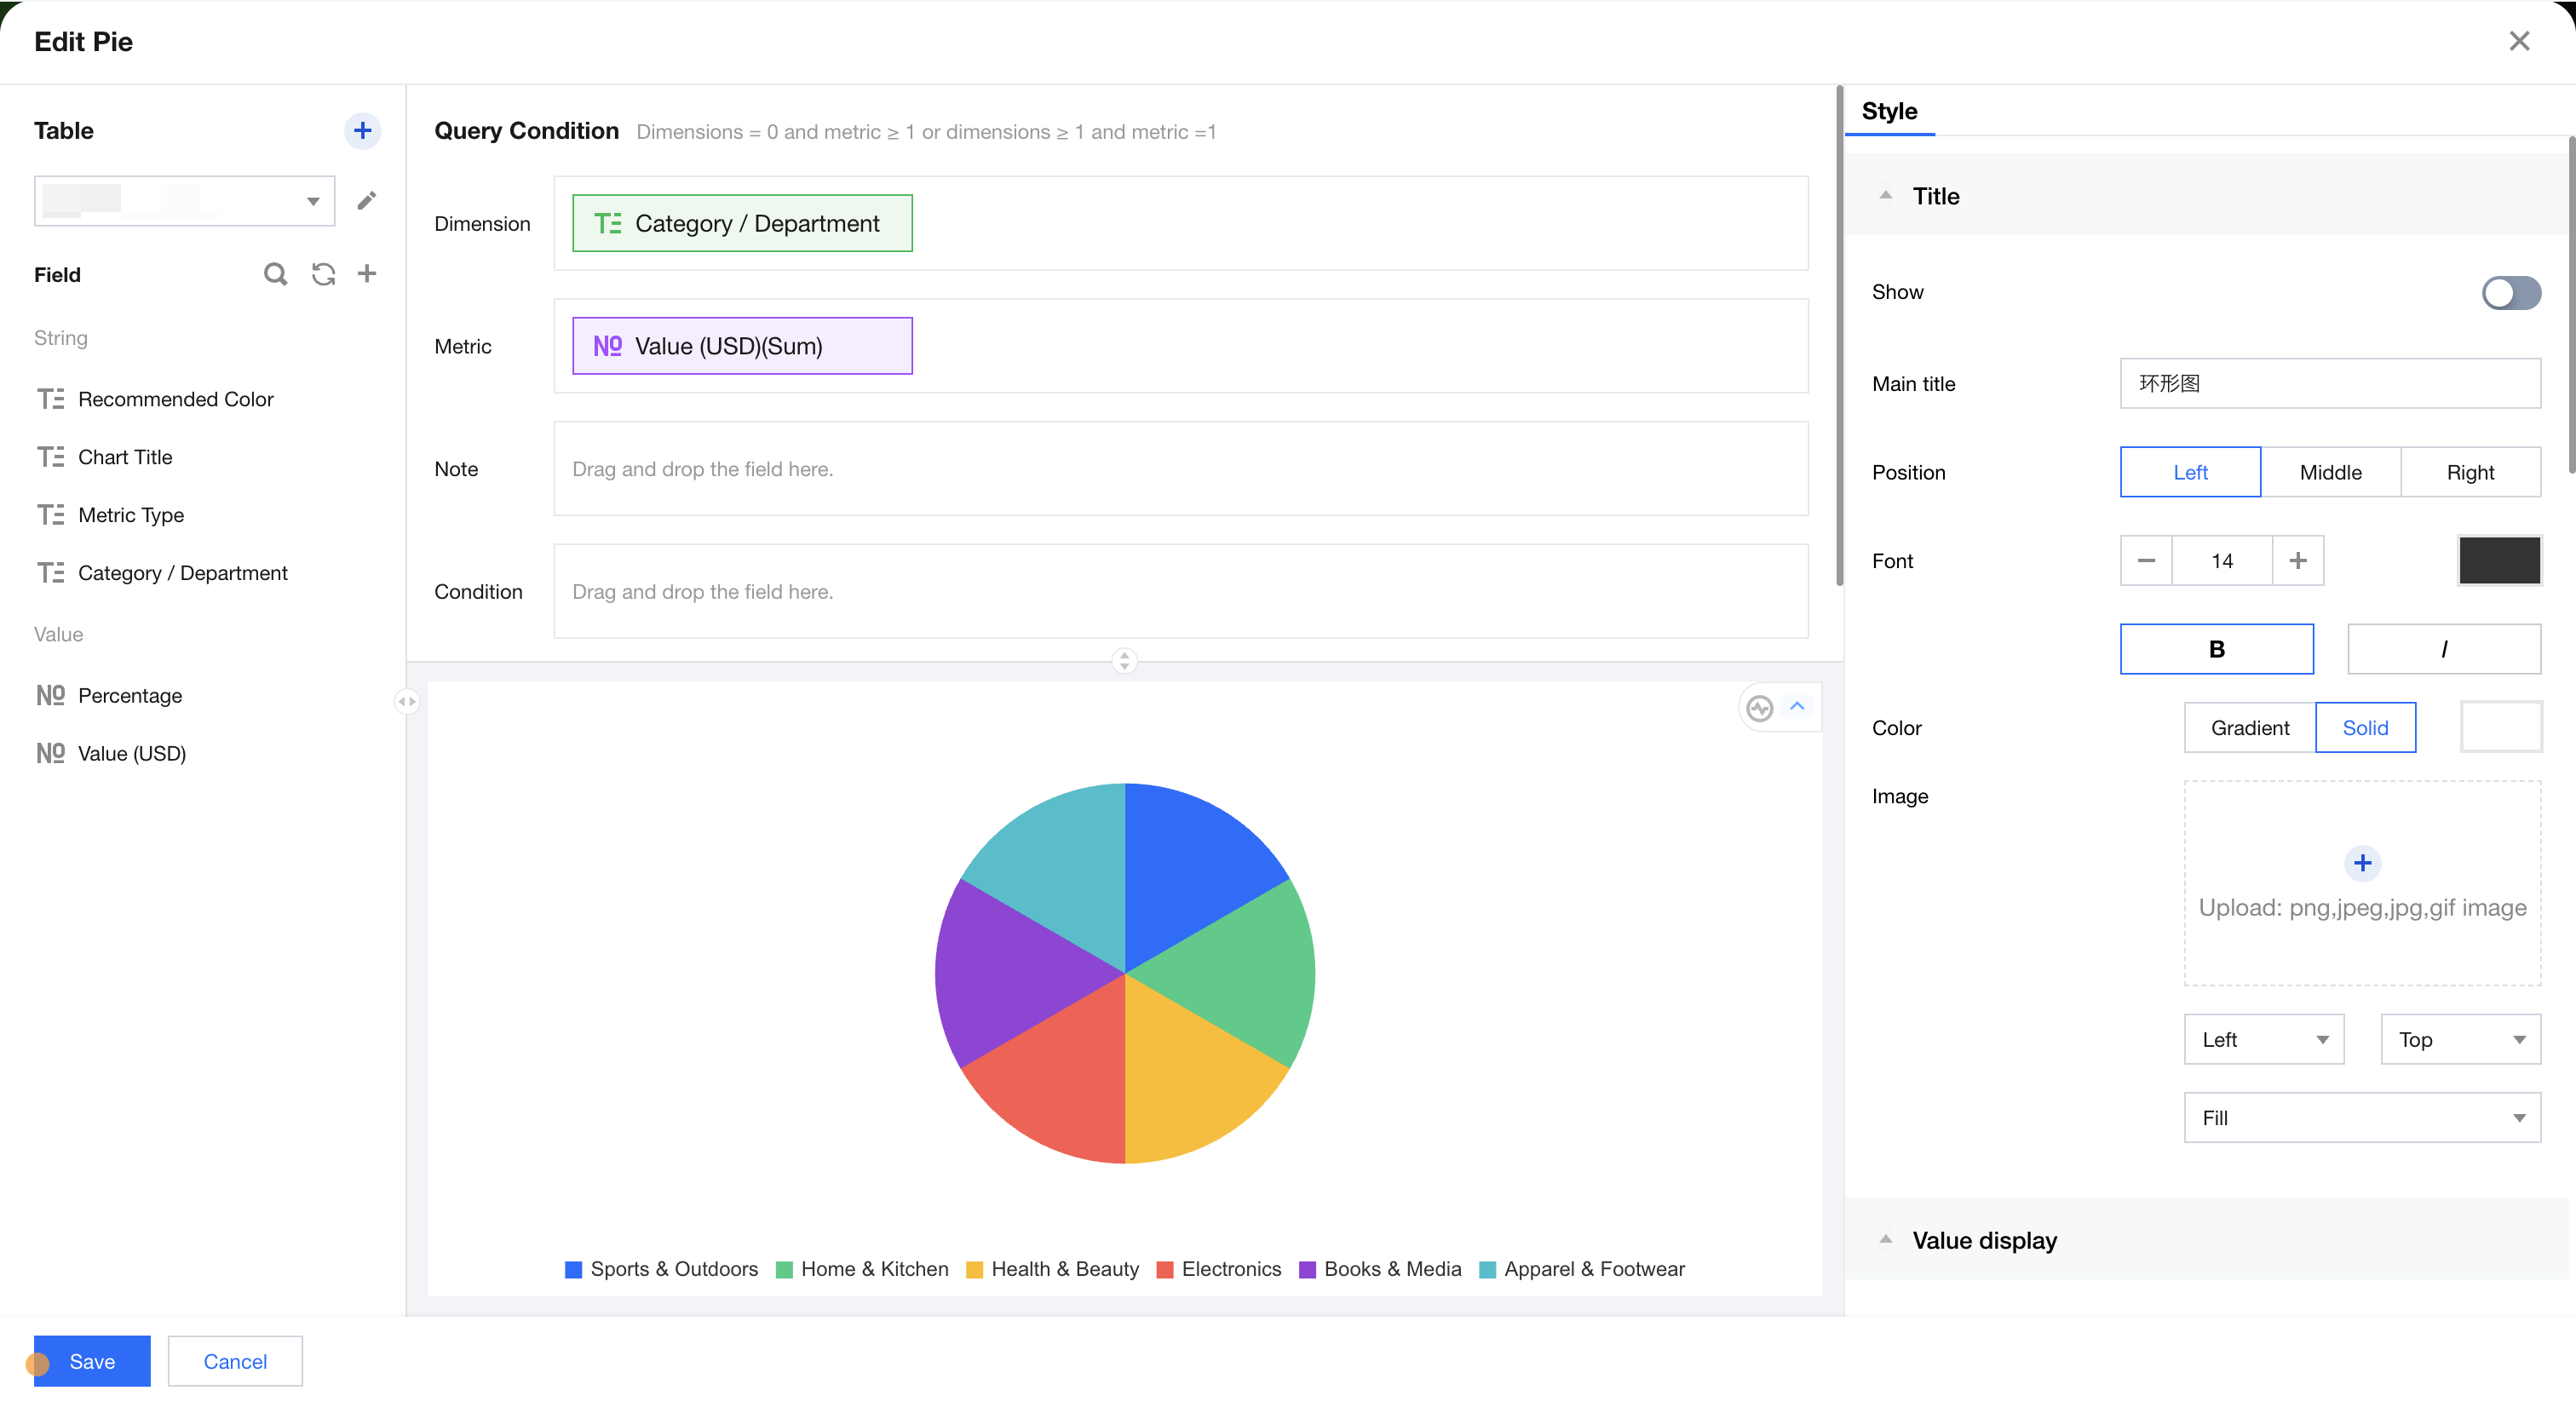
The pie chart is primarily used for showing the size and percentage of total values in data. As shown below, it displays sales distribution data across different categories.
Query Condition Settings
Dimensionality & metric count requirements: dimensionality=0, metrics≥1 or dimensionality≥1, metrics=1. Conditional filtering can be performed by dragging and dropping time, character, or numeric value fields in the condition area. The immediate analysis button triggers chart data updates, with a maximum display of XX results (0-10000) configurable on the right.
Component Style Settings
The pie chart supports the following style settings:
Setting Item
Classification Settings
Setup Instructions
Title
Display
Enable/disable chart title display
Main Title
Set Chart Main Title
horizontal position
Set the horizontal position of the title display, such as left, center, or right.
numeric display
Value Type
Set the numeric display type, with three types to select: 1. Standard numerical value: for example "1211" shows as "1211" 2. Percentage: for example "0.11" shows as "11%" 3. Thousands separator: for example "1211" shows as "1,211"
value unit
Set the value unit, with the following ontions: 1, None 2, Ten thousand: for example. "121112" shows as 12,111 Ten thousand. 3, Million 4, Ten million 5. Hundred million 6. One billion 7. Ten Billion
Decimal places retained
Set the number of decimal places for numeric values. For example, "1211.2334" shows as "1211.23" when set to retain 2 decimal places.
Tags
Display
Enable/disable tag display
data name
To display the data name, you can enable it.
Data value.
To display the numeric value, you can enable it. Normally, enable the tag display, which requires turning on the data value simultaneously.
Percentage
To display percentage data, you can enable it.
Legend
Display
Enable/disable legend display
toward
Set the legend arrangement direction, with horizontal and vertical options
align alignment
Set the legend alignment mode, with left, center, and right options
Position
Set the legend position, with top, center, and bottom options
Radar Chart
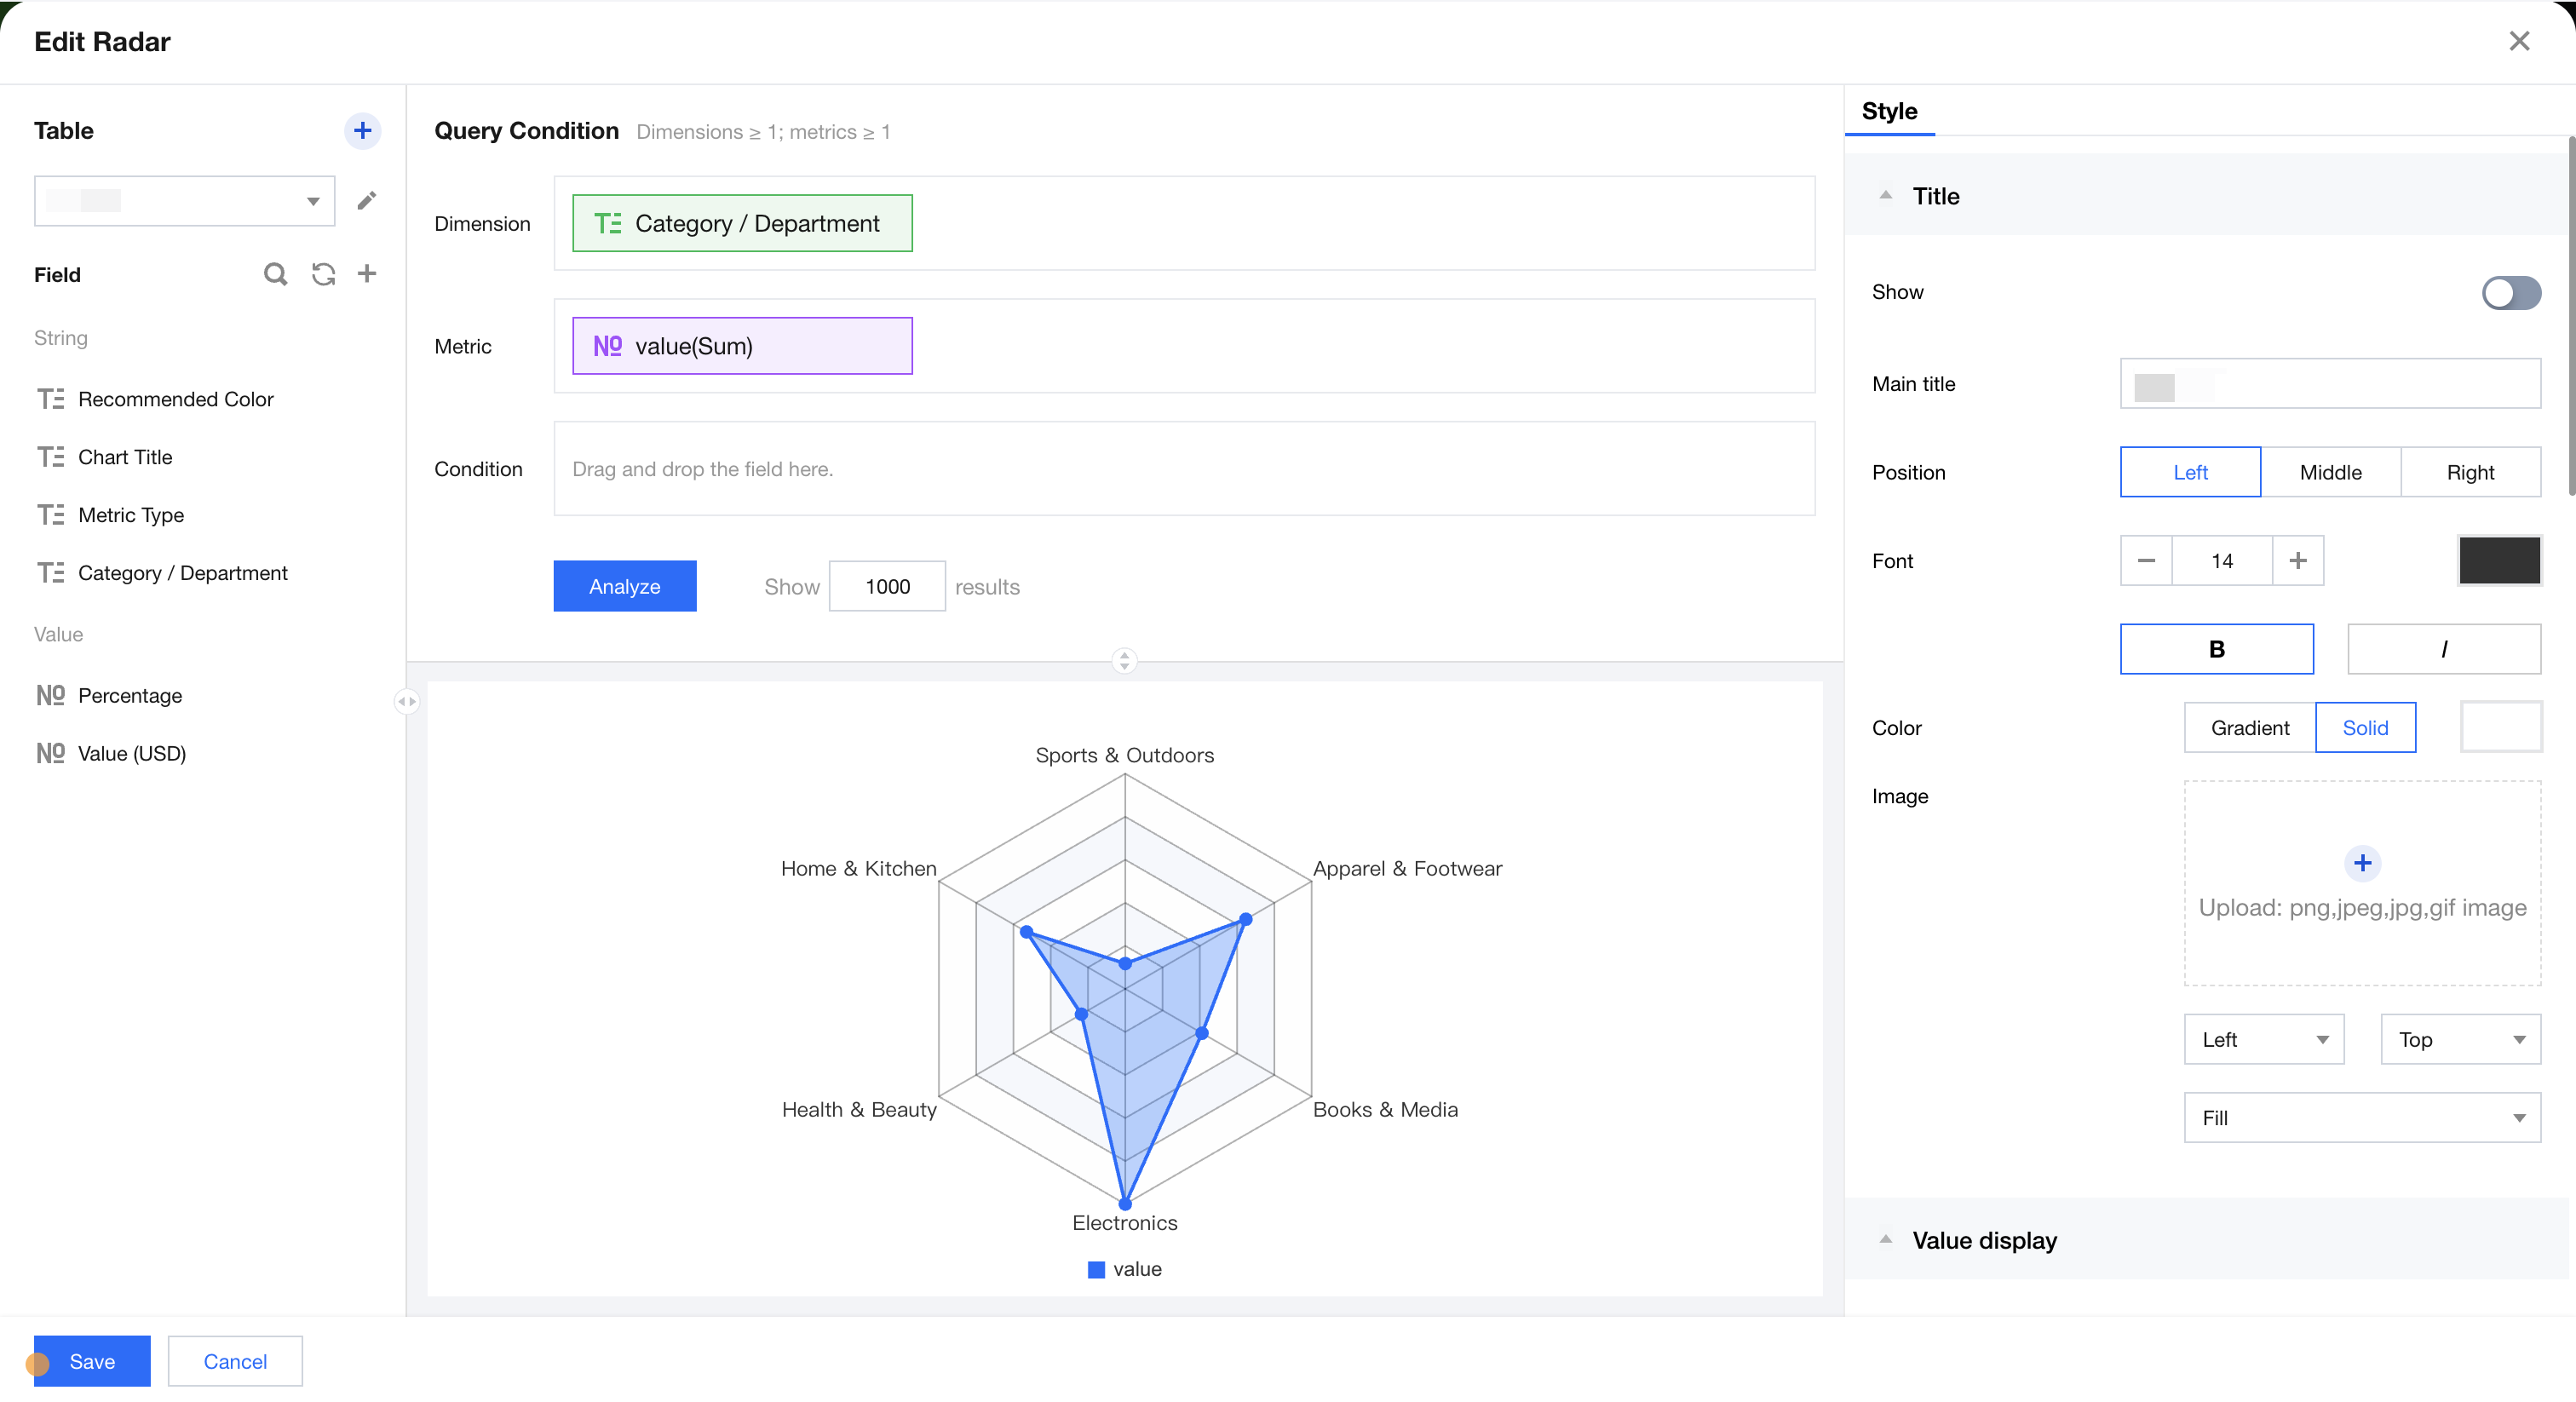
The radar chart is mainly used to display analysis results of numbers or ratios, showing the distribution of dimension values. As shown below, it displays sales distribution data across different categories.
Query Condition Settings
Dimensionality & metric count requirements: dimensions ≥1, metrics ≥1. The condition area allows conditional filtering of data by dragging and dropping time, character, or numeric value fields. The immediate analysis button can trigger chart data update display, while the maximum display of XX results (0-10000) can be set on the right.
Component Style Settings
The radar chart supports the following style settings:
Setting Item
Classification Settings
Setup Instructions
Title
Display
Enable/disable chart title display
Main Title
Set Chart Main Title
horizontal position
Set the horizontal position of the title display, such as left, center, or right.
numeric display
Value Type
Set the numeric display type, with three types to select: 1. Standard numerical value: for example "1211" shows as "1211" 2. Percentage: for example "0.11" shows as "11%" 3. Thousands separator: for example "1211" shows as "1,211"
value unit
Set the value unit, with the following ontions: 1, None 2, Ten thousand: for example. "121112" shows as 12,111 Ten thousand. 3, Million 4, Ten million 5. Hundred million 6. One billion 7. Ten Billion
Decimal places retained
Set the number of decimal places for numeric values. For example, "1211.2334" shows as "1211.23" when set to retain 2 decimal places.
Tags
Display
Enable/disable tag display
data name
To display the data name, you can enable it.
Data value.
To display the numeric value, you can enable it. Normally, enable the tag display, which requires turning on the data value simultaneously.
Percentage
To display percentage data, you can enable it.
Legend
Display
Enable/disable legend display
toward
Set the legend arrangement direction, with horizontal and vertical options
align alignment
Set the legend alignment mode, with left, center, and right options
Position
Set the legend position, with top, center, and bottom options
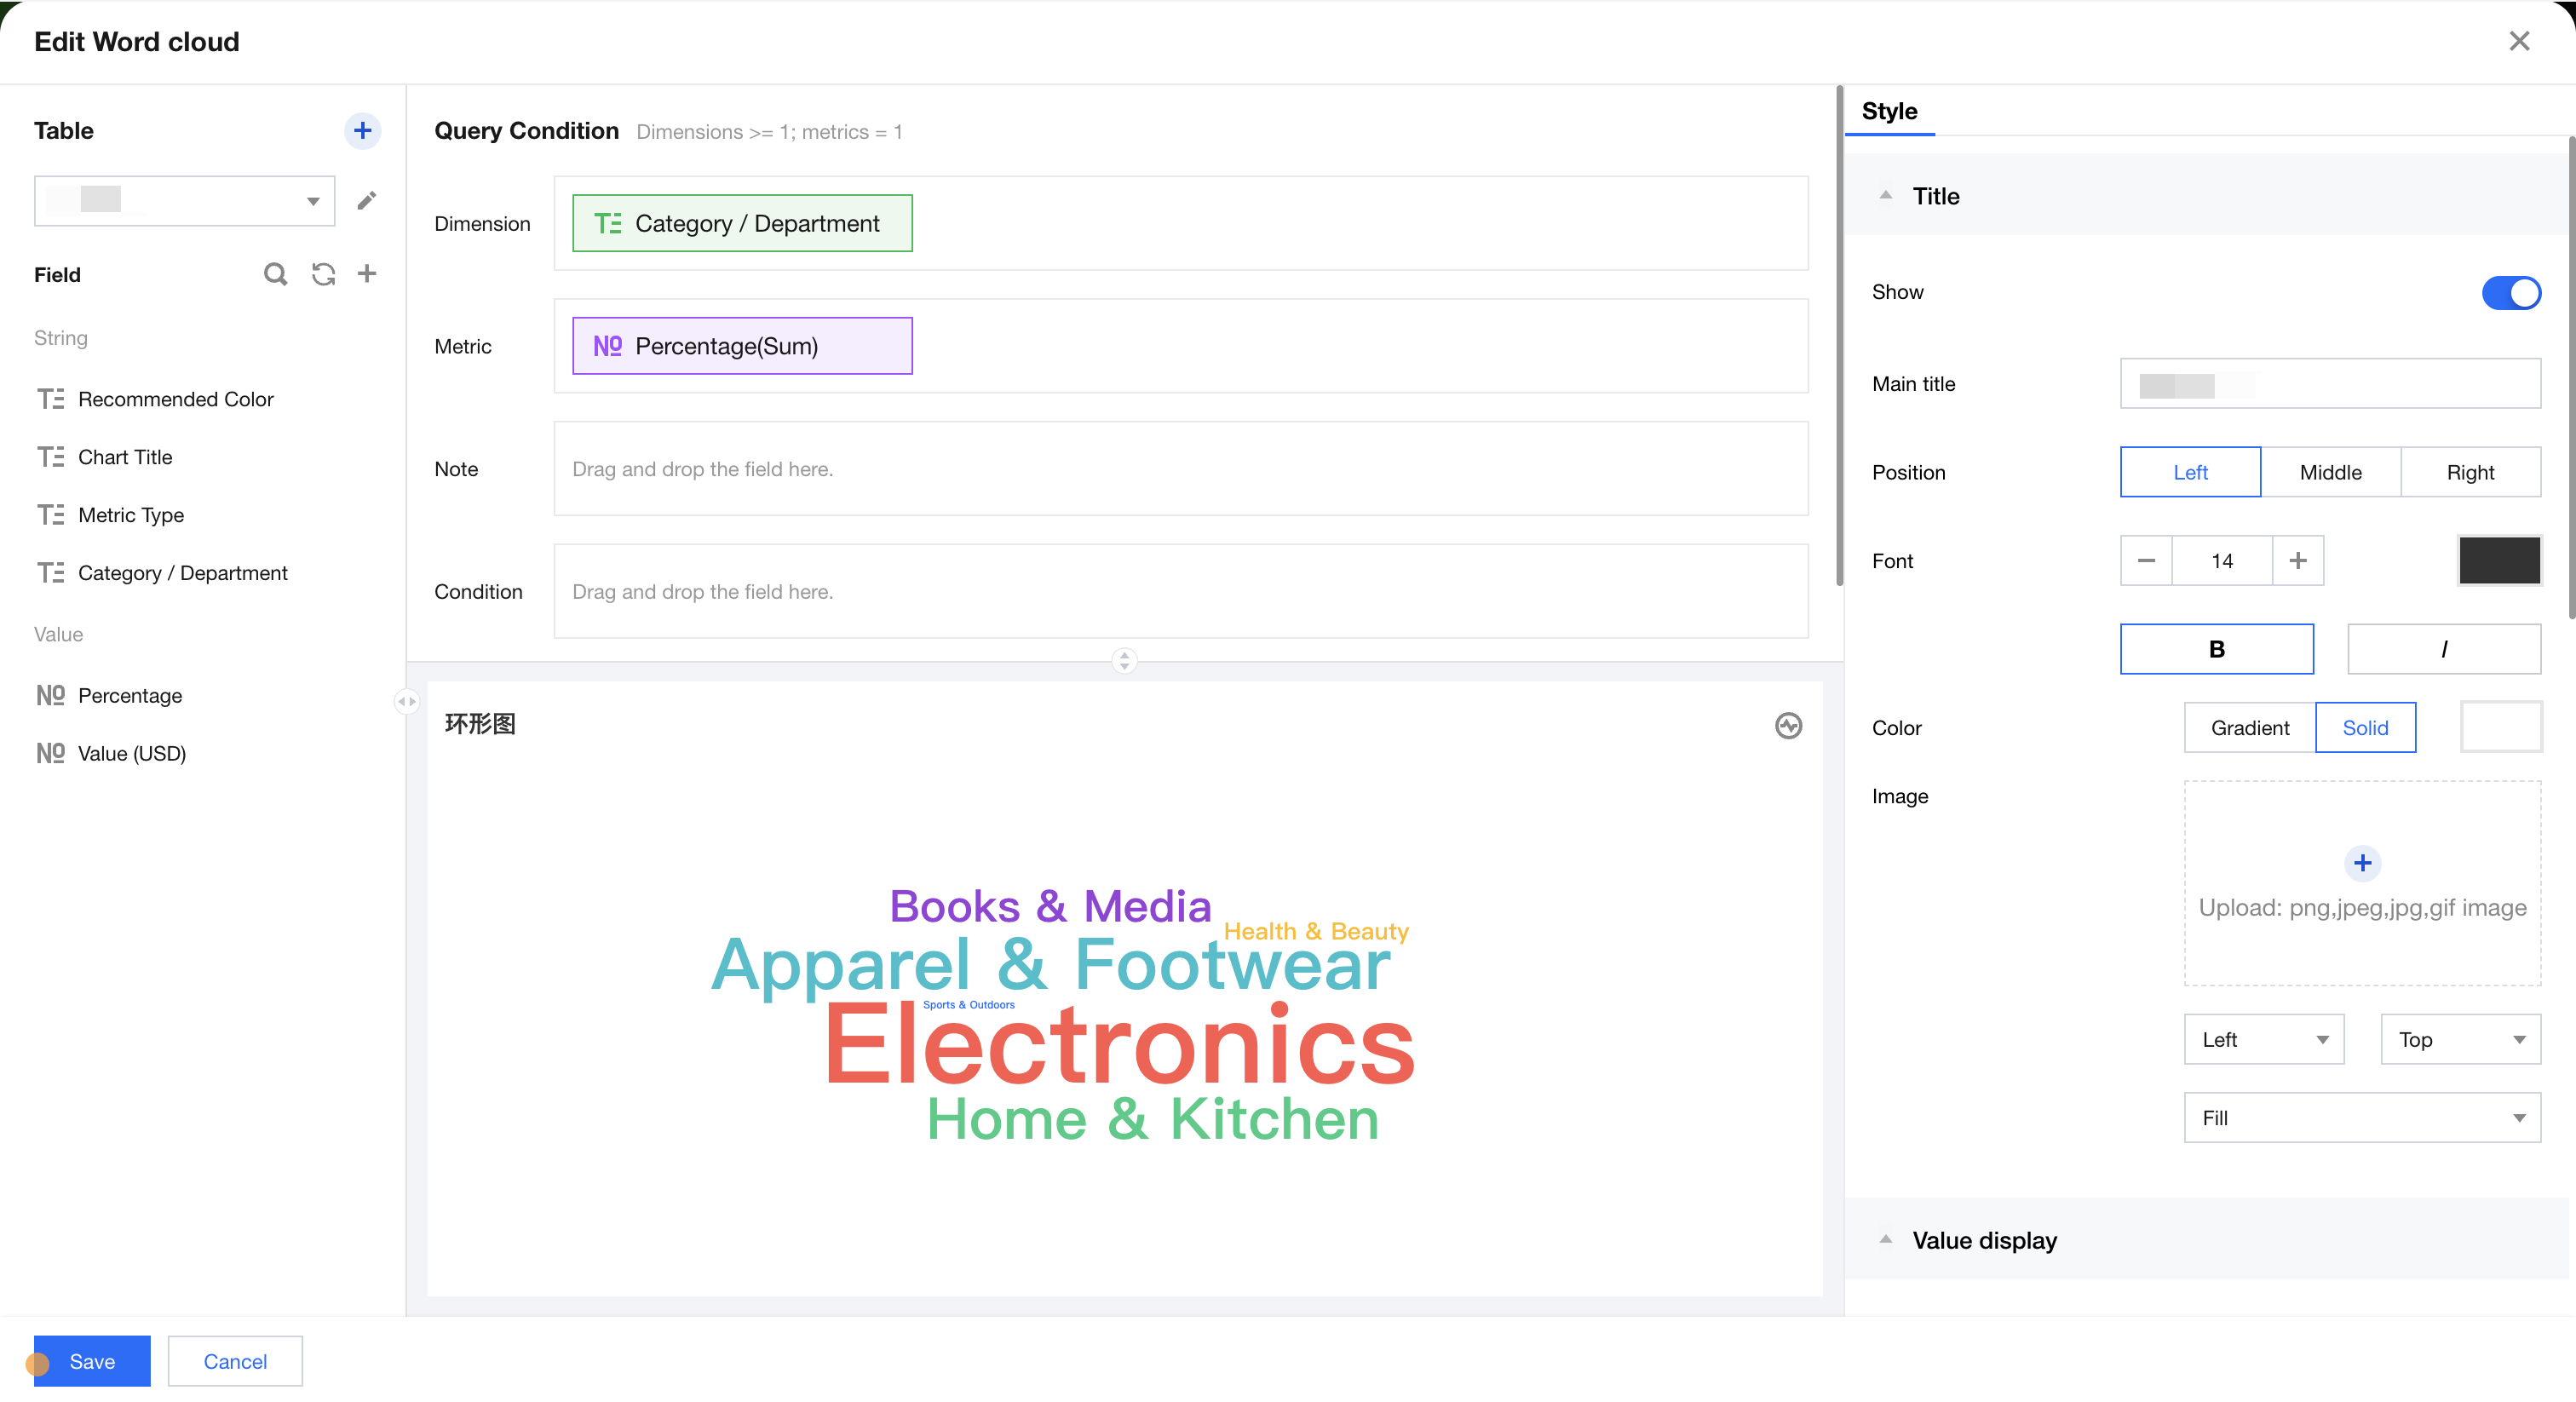
Word Cloud
Word cloud diagrams are mainly used to produce user profiles and user tags. As shown below, the sales distribution data of different categories is displayed.
Query Condition Settings
Dimensionality & metric count requirements: dimension ≥1, metric=1. Conditional filtering can be performed by dragging and dropping time, character, or numeric value fields in the condition area. The immediate analysis button triggers the chart's data update display, and the maximum display of XX results (0-10000) can be set on the right.
Component Style Settings
Word cloud diagram supports the following style settings:
Setting Item
Classification Settings
Setup Instructions
Title
Display
Enable/disable chart title display
Main Title
Set Chart Main Title
horizontal position
Set the horizontal position of the title display, such as left, center, or right.
numeric display
Value Type
Set the numeric display type, with three types to select: 1. Standard numerical value: for example "1211" shows as "1211" 2. Percentage: for example "0.11" shows as "11%" 3. Thousands separator: for example "1211" shows as "1,211"
value unit
Set the value unit, with the following ontions: 1, None 2, Ten thousand: for example. "121112" shows as 12,111 Ten thousand. 3, Million 4, Ten million 5. Hundred million 6. One billion 7. Ten Billion
Decimal places retained
Set the number of decimal places for numeric values. For example, "1211.2334" shows as "1211.23" when set to retain 2 decimal places.
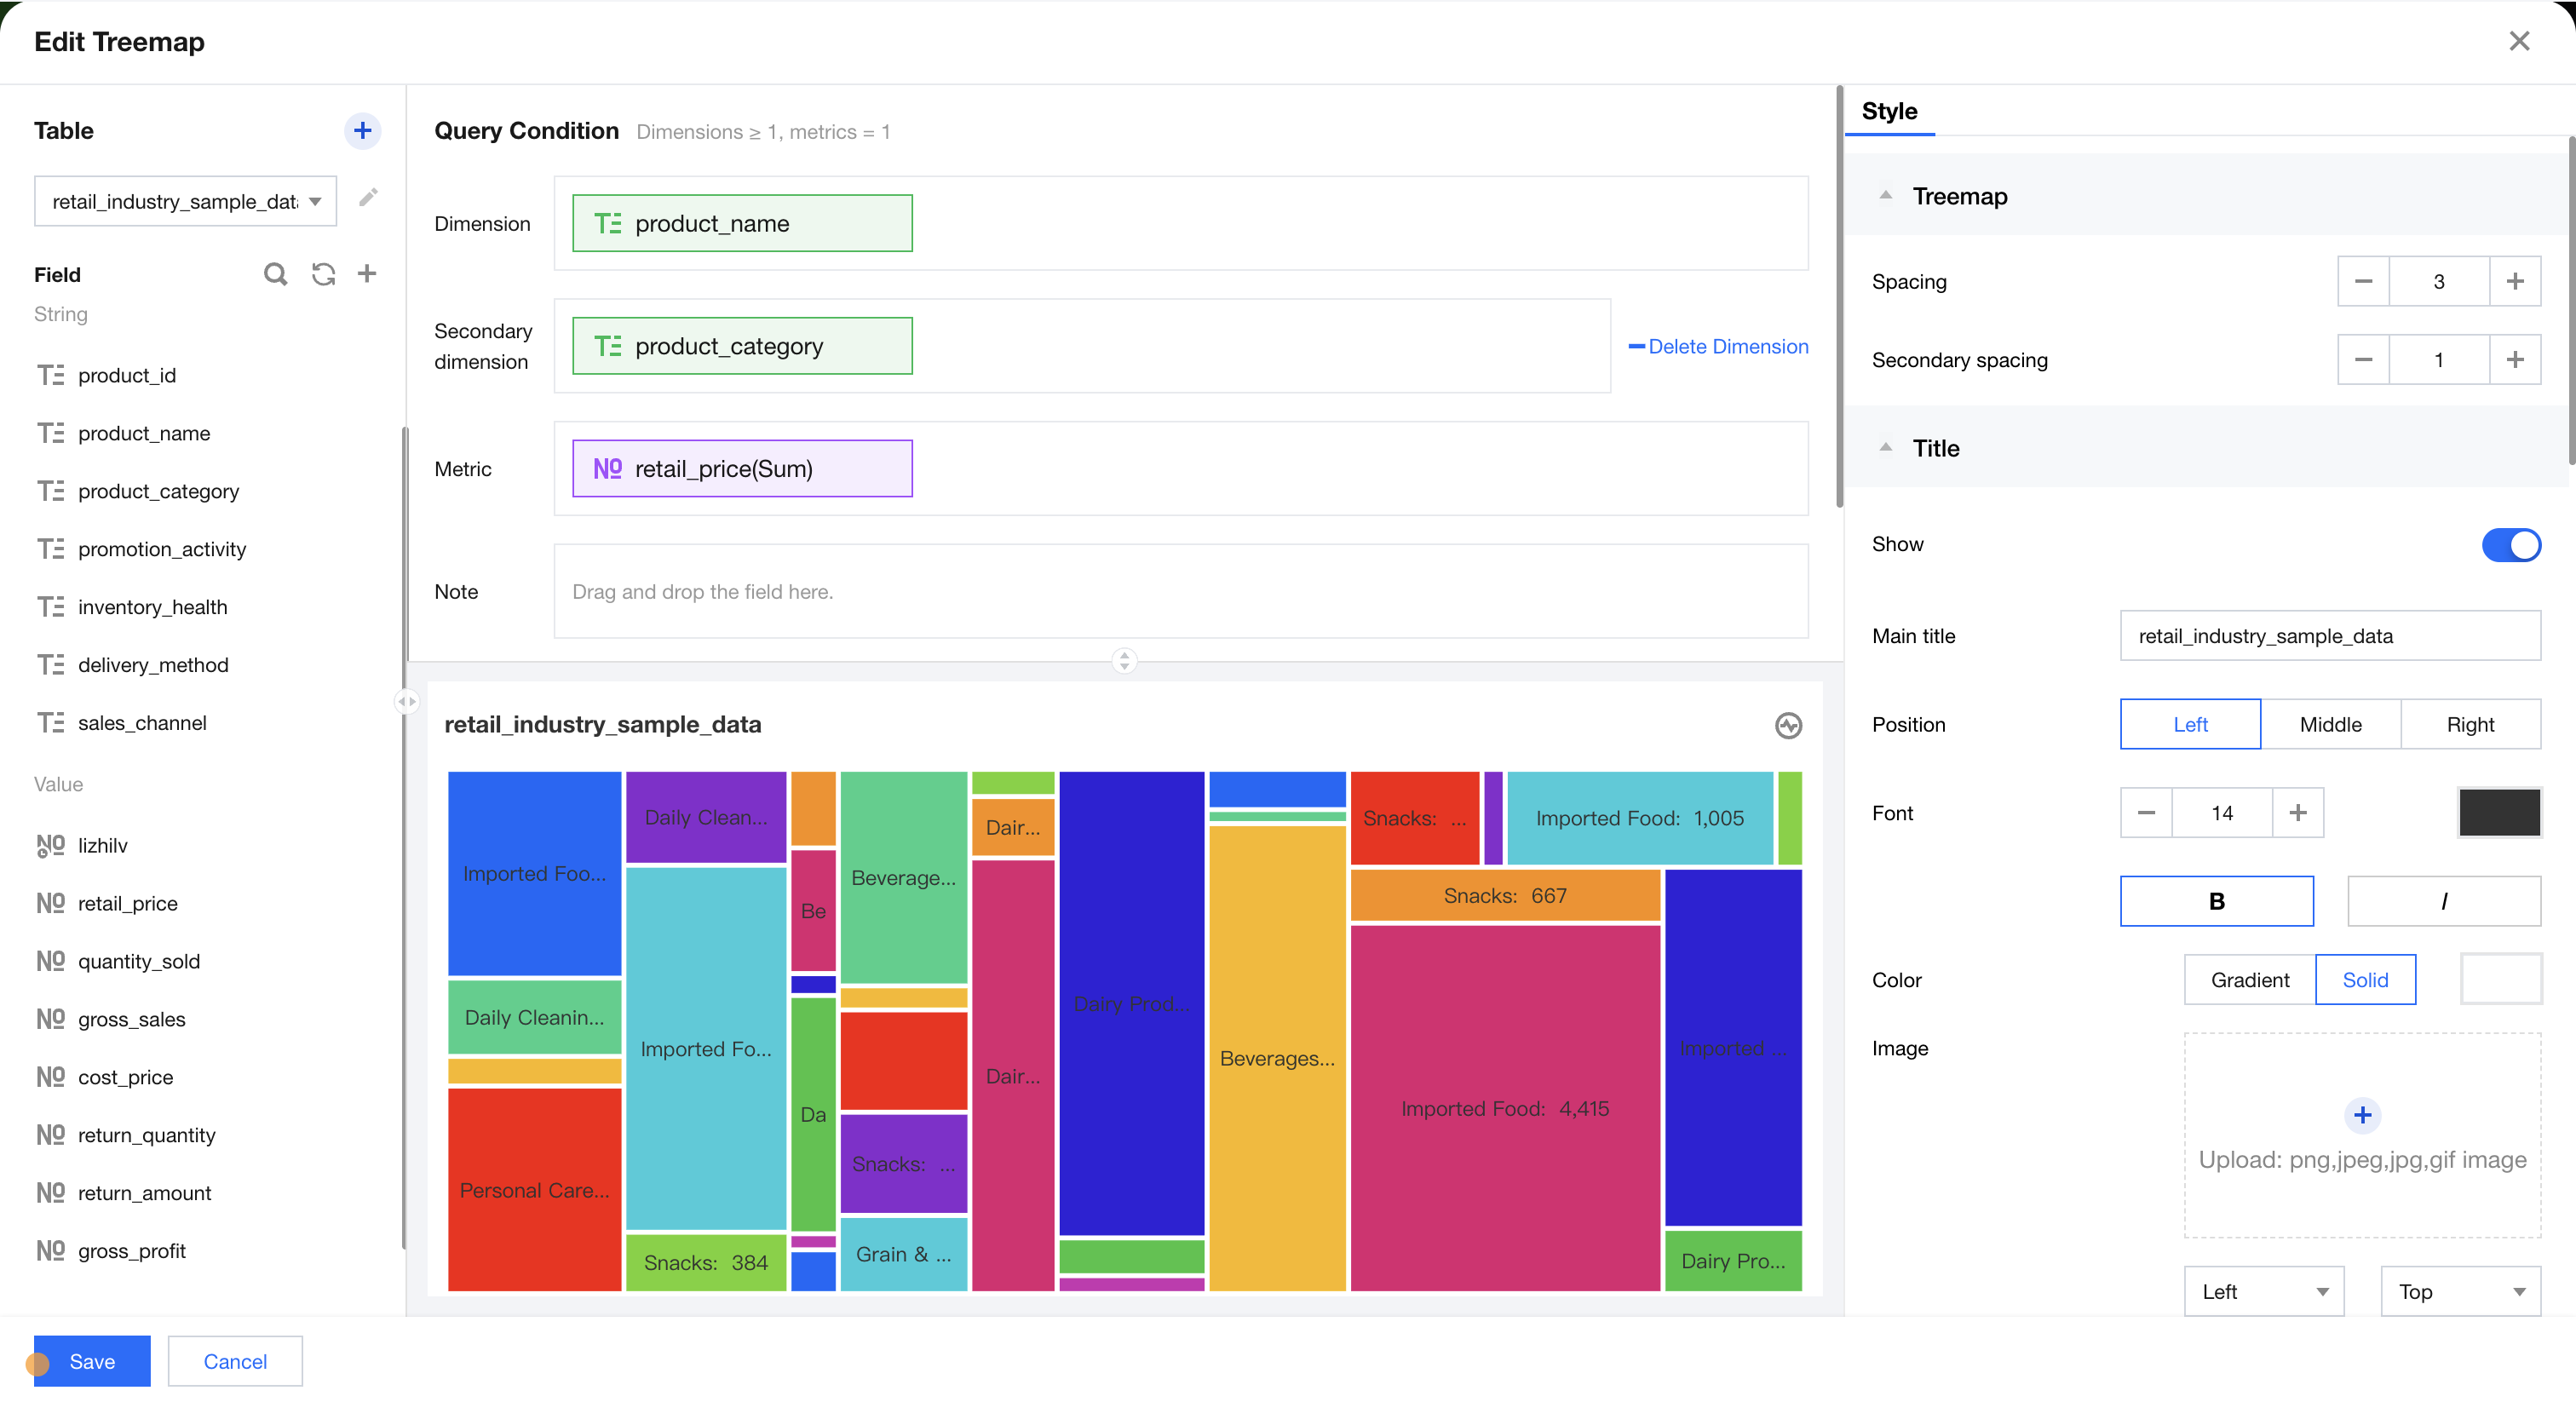
Rectangular Tree Diagram
The rectangular tree diagram is mainly used to show the size and percentage of total values in data. As shown below, it displays output distribution data across different departments.
Query Condition Settings
Dimensionality & metric count requirements: dimensions ≥1, metric=1. The condition section allows filtering data by dragging and dropping time, character, or numeric fields. The immediate analysis button can trigger chart data updates, and you can set the maximum display of XX results (0-10000) on the right.
Component Style Settings
The pie chart supports the following style settings:
Setting Item
Classification Settings
Setup Instructions
rectangular tree diagram
Dimensional margin
Set spacing between dimensions, case-sensitive for two dimensional sizes
Total Settings
Overall total
Turn on/off total data display, shown in the top-left corner of the chart
Title
Display
Enable/disable chart title display
Main Title
Set Chart Main Title
horizontal position
Set the horizontal position of the title display, such as left, center, or right.
numeric display
Value Type
Set the numeric display type, with three types to select: 1. Standard numerical value: for example "1211" shows as "1211" 2. Percentage: for example "0.11" shows as "11%" 3. Thousands separator: for example "1211" shows as "1,211"
value unit
Set the value unit, with the following ontions: 1, None 2, Ten thousand: for example. "121112" shows as 12,111 Ten thousand. 3, Million 4, Ten million 5. Hundred million 6. One billion 7. Ten Billion
Decimal places retained
Set the number of decimal places for numeric values. For example, "1211.2334" shows as "1211.23" when set to retain 2 decimal places.
Tags
Display
Enable/disable tag display
data name
To display the data name, you can enable it.
Data value.
To display the numeric value, you can enable it. Normally, enable the tag display, which requires turning on the data value simultaneously.
Proportion
To display the statistical value of the current dimension as a ratio of the total/group total, you can enable it.
Proportion calculation
Set the way to calculate proportion: contrast all=current value/total value, group comparison=current value/group total value
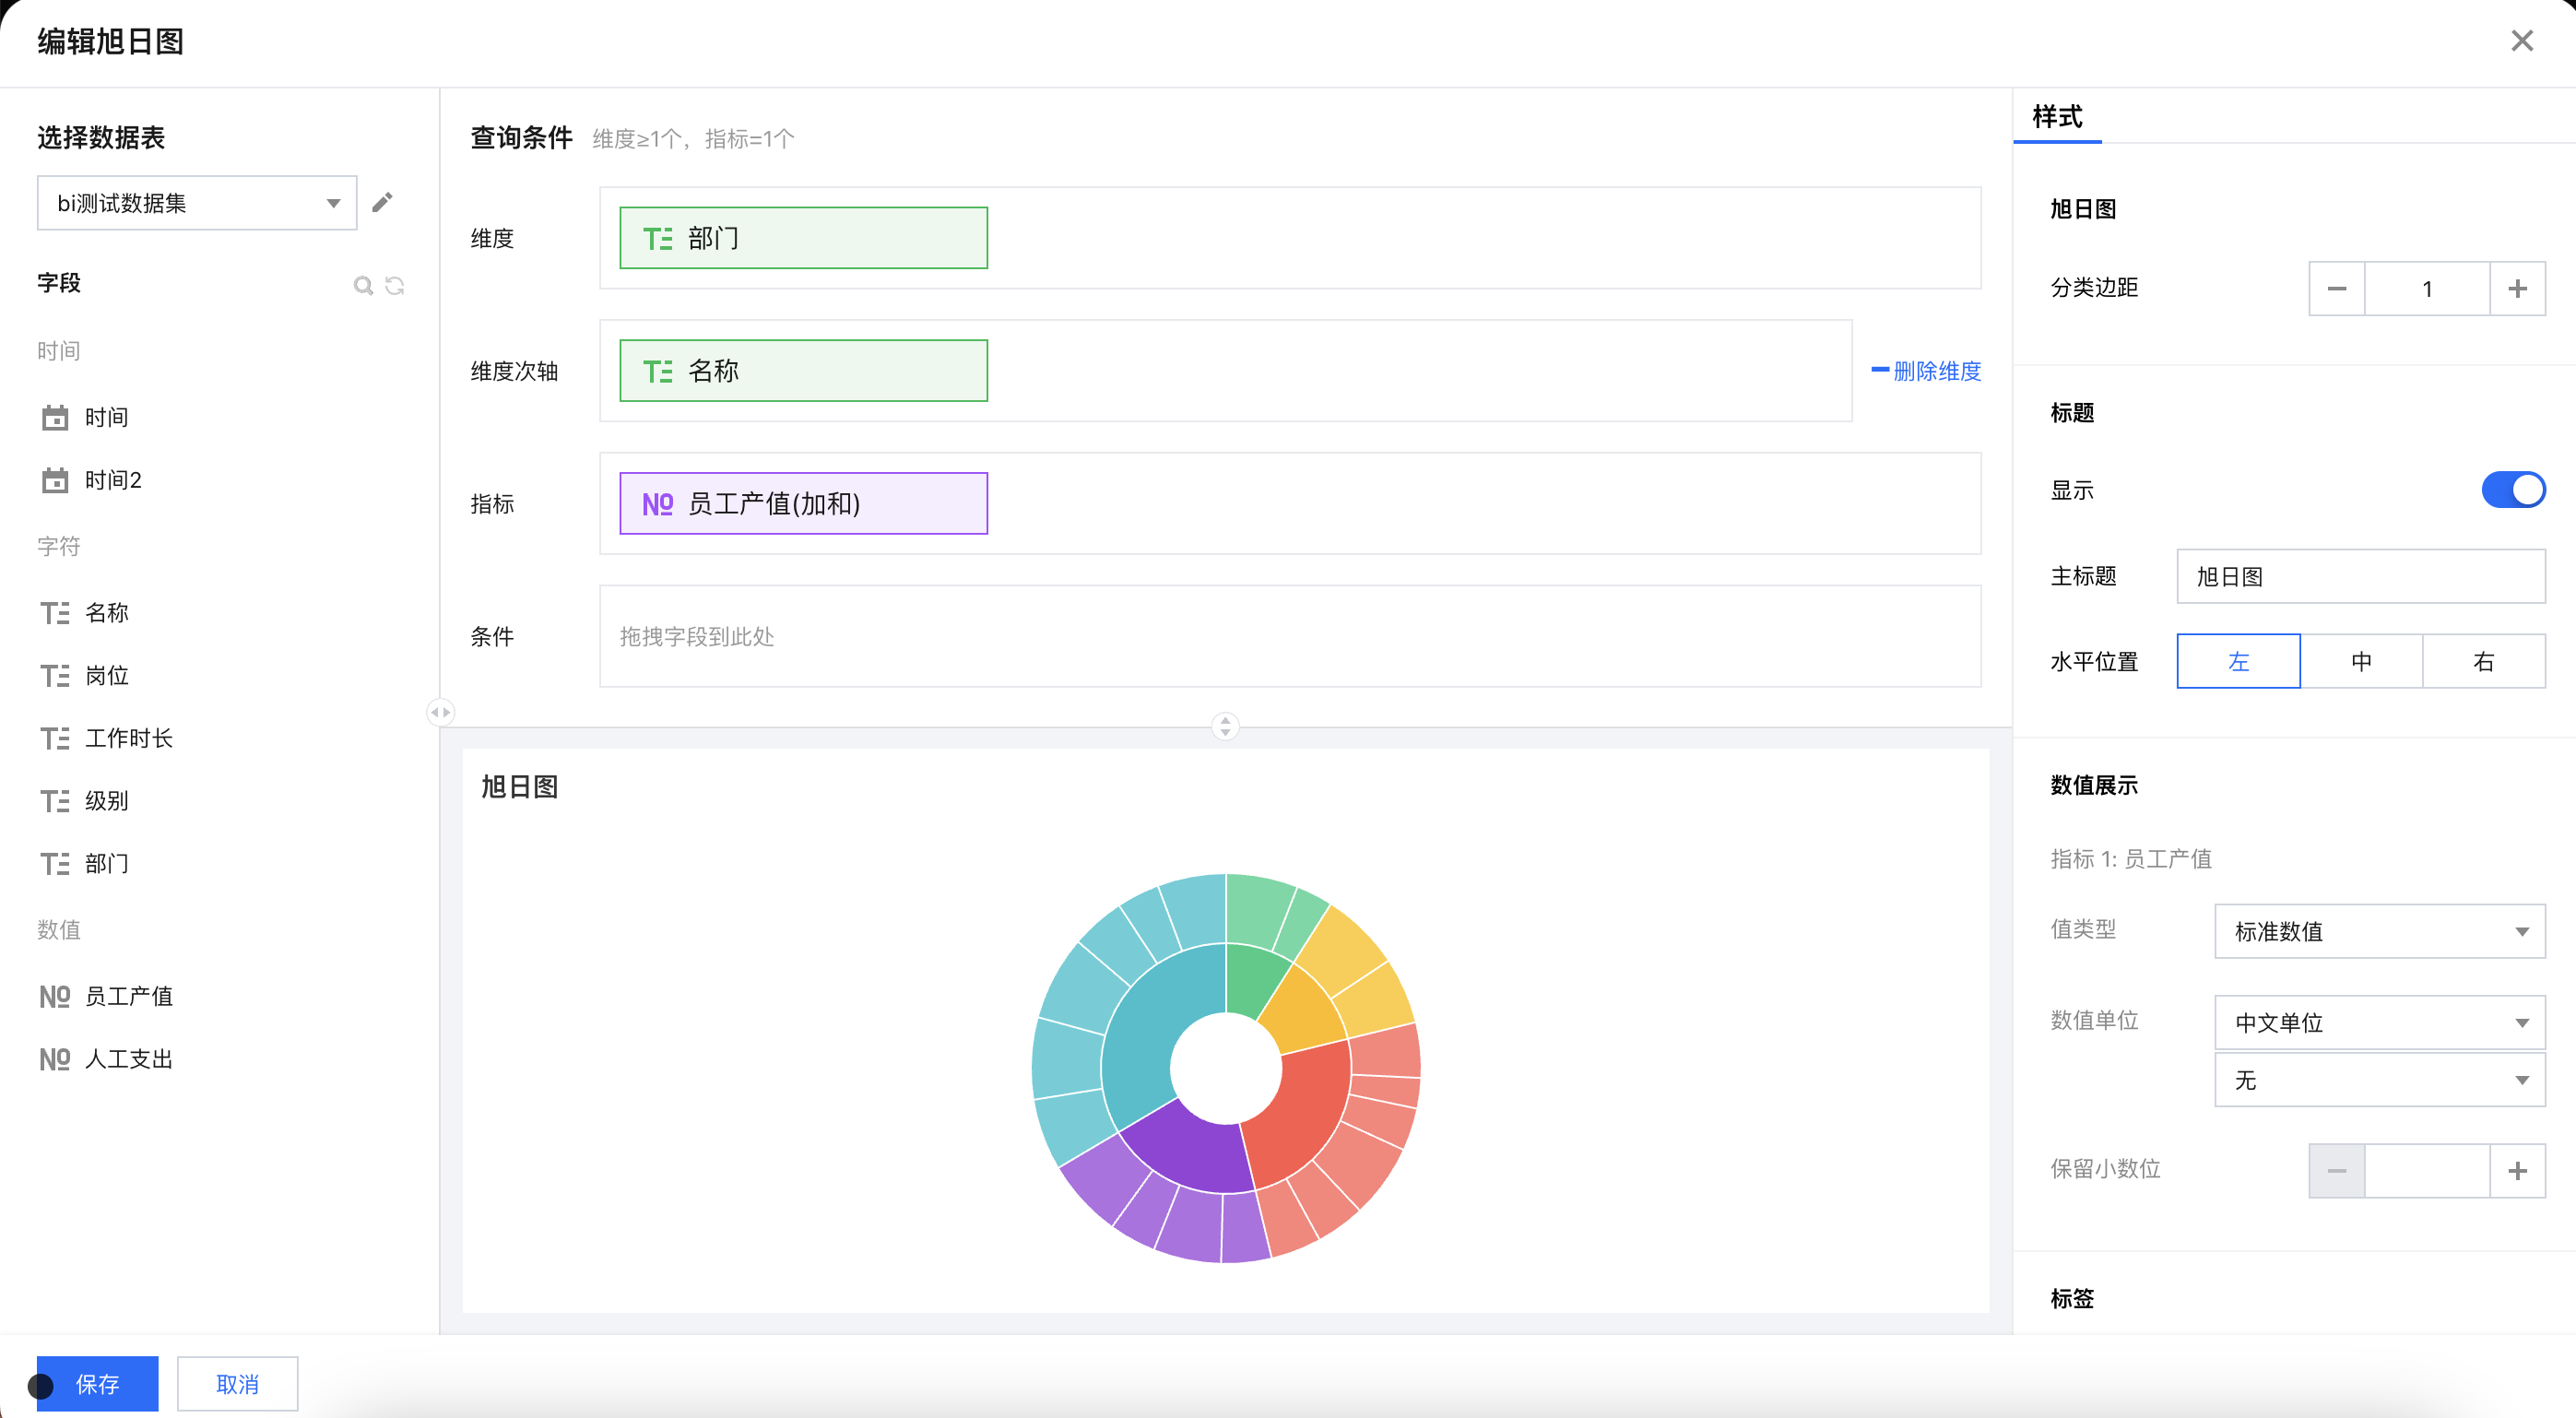
Sunburst Chart
The Sunburst Chart is mainly used to show the size of items and their percentage of the total. As shown below, it displays the output distribution data of different departments.
Query Condition Settings
Dimensionality & metric count requirements: dimensions ≥1, metric=1. The condition section allows filtering data by dragging and dropping time, character, or numeric fields. The immediate analysis button can trigger chart data updates, and you can set the maximum display of XX results (0-10000) on the right.
Component Style Settings
The pie chart supports the following style settings:
Setting Item
Classification Settings
Setup Instructions
Sunburst Chart
Category margin
Set spacing between dimensions, case-sensitive for two dimensional sizes
Title
Display
Enable/disable chart title display
Main Title
Set Chart Main Title
horizontal position
Set the horizontal position of the title display, such as left, center, or right.
numeric display
Value Type
Set the numeric display type, with three types to select: 1. Standard numerical value: for example "1211" shows as "1211" 2. Percentage: for example "0.11" shows as "11%" 3. Thousands separator: for example "1211" shows as "1,211"
value unit
Set the value unit, with the following ontions: 1, None 2, Ten thousand: for example. "121112" shows as 12,111 Ten thousand. 3, Million 4, Ten million 5. Hundred million 6. One billion 7. Ten Billion
Decimal places retained
Set the number of decimal places for numeric values. For example, "1211.2334" shows as "1211.23" when set to retain 2 decimal places.
Tags
Display
Enable/disable tag display
data name
To display the data name, you can enable it.
Data value.
To display the numeric value, you can enable it. Normally, enable the tag display, which requires turning on the data value simultaneously.
Proportion
To display the statistical value of the current dimension as a ratio of the total/group total, you can enable it.