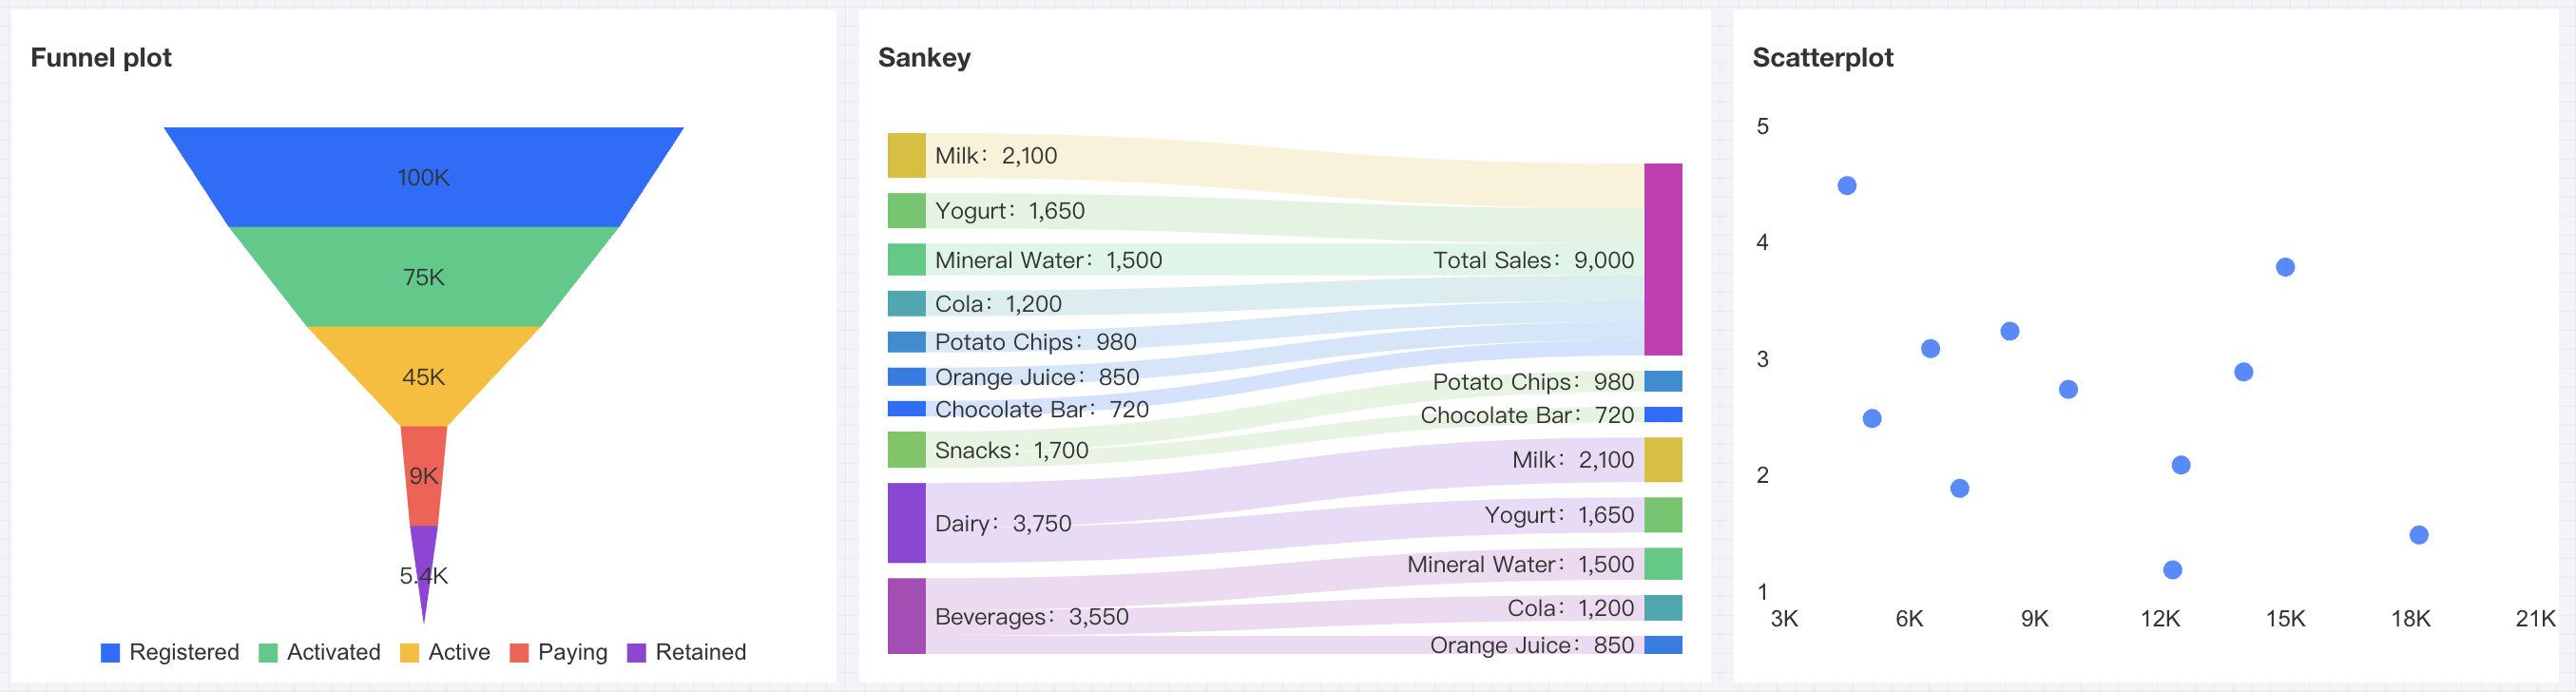
Tencent Cloud BI products include relational charts such as funnel charts, Sankey diagrams, and scatter charts, mainly used for statistics and analysis of data correlation and distribution relationships.
Funnel plot
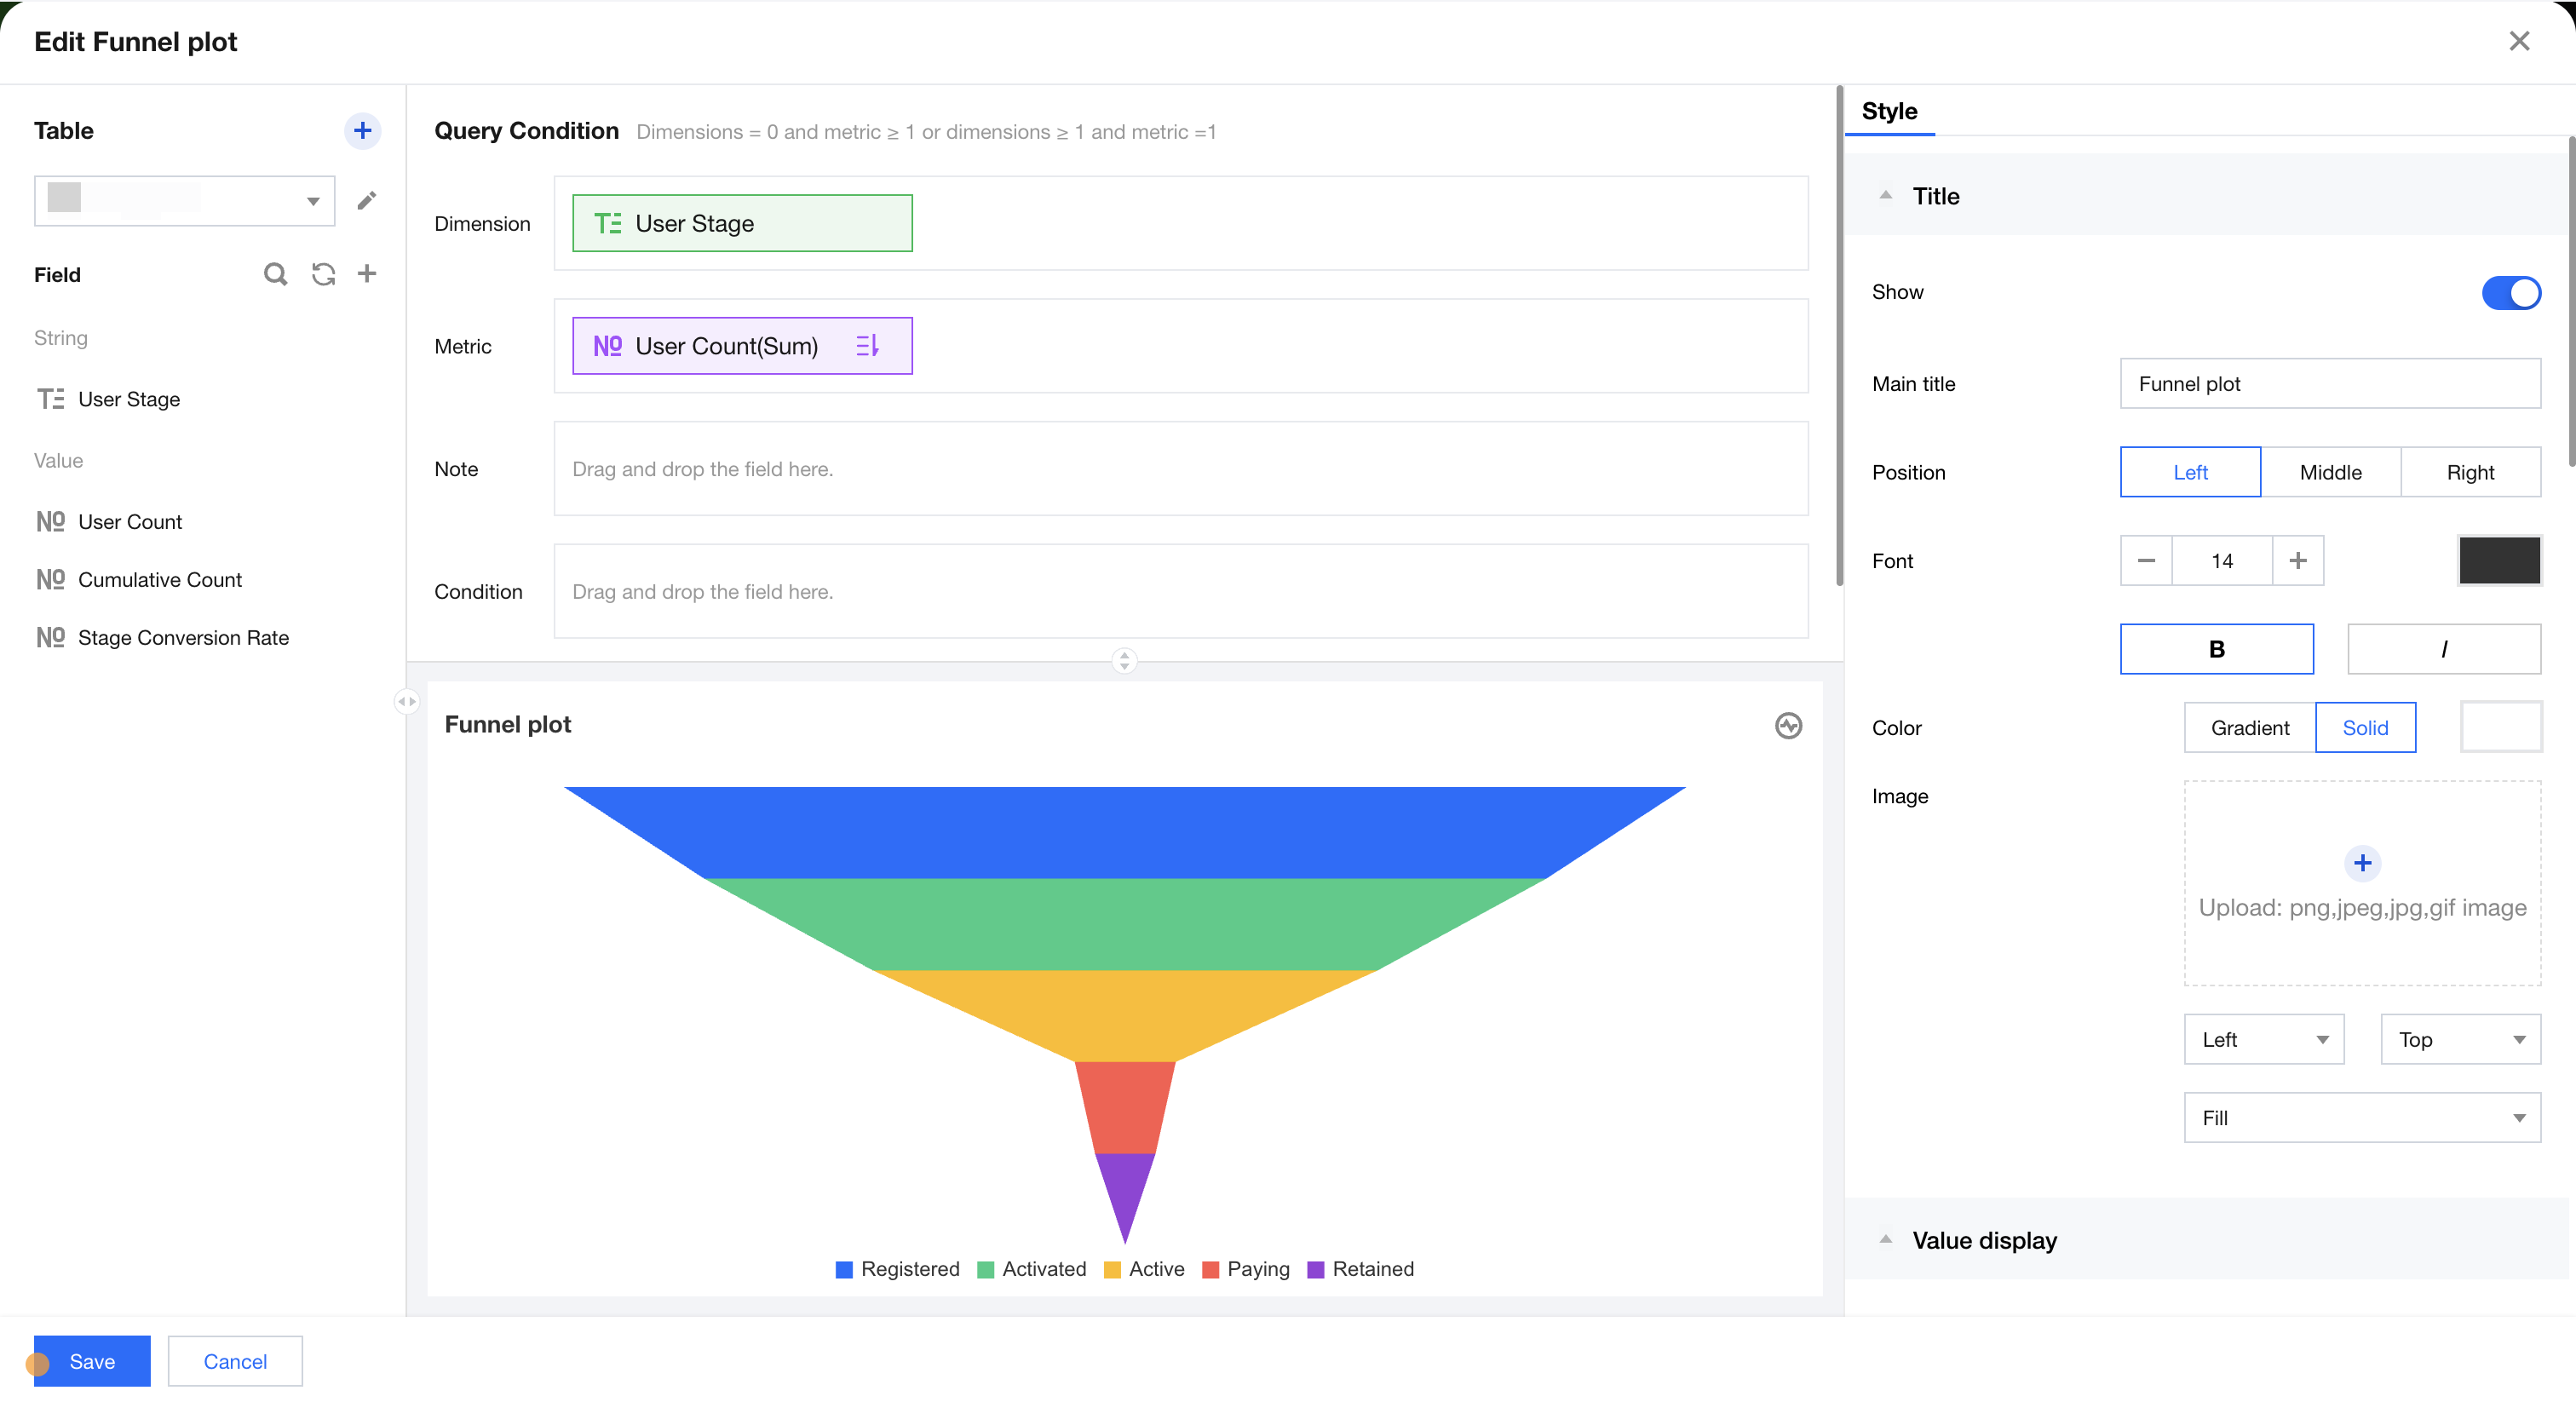
The funnel chart is primarily used for analyzing standardized, time-consuming business processes with multiple stages. It can compare the conversion rates of business data at each stage. As shown in the figure below, the graph data displays the conversion funnel of the number of users at different user stages.
Query Condition Settings
Dimensionality & metric count requirements: dimension=0, metric>=1 or dimension≥1, metric=1. The condition area allows conditional filtering of data by dragging and dropping time, character, or numeric value fields. The immediate analysis button can trigger chart data update display, and you can set the maximum display of XX results (0-10000) on the right.
Component Style Settings
Funnel charts support the following style settings:
Setting Item
Setting Category
Setup Instructions
Title
Display
Enable/Disable Display Chart Title
Main Title
Set Chart Main Title
horizontal position
Set the horizontal position of the title display, such as left, center, or right.
numeric display
value type
Set the numeric display type, with three options: 1. Standard numerical value: for example, "1211" shows as "1211" 2. Percentage: for example, "0.11" shows as "11%" 3. Thousands separator: for example, "1211" shows as "1,211"
value unit
Set the value unit, with the following options: 1. None 2. Ten thousand: for example, "121112" shows as 12.111, analogous units follow 3. Million 4. Ten million 5. Hundred million 6. One billion 7. Billions of
decimal places retained
Set the number of decimal places. For example, "1211.2334" shows as "1211.23" when set to retain 2 decimal places.
Tag
Display
Enable/Disable Display Tag
data name
If needed, display the data name by enabling it.
Data value.
If needed, display the numeric value by enabling it. Normally, enable tag display, and data value must be enabled simultaneously.
Legend
Display
Enable/Disable Legend Display
toward
Set the legend arrangement direction, with horizontal and vertical options
align alignment
Set the legend alignment mode, with left, center, and right options
Position
Set the legend position, with top, center, and bottom options
Sankey
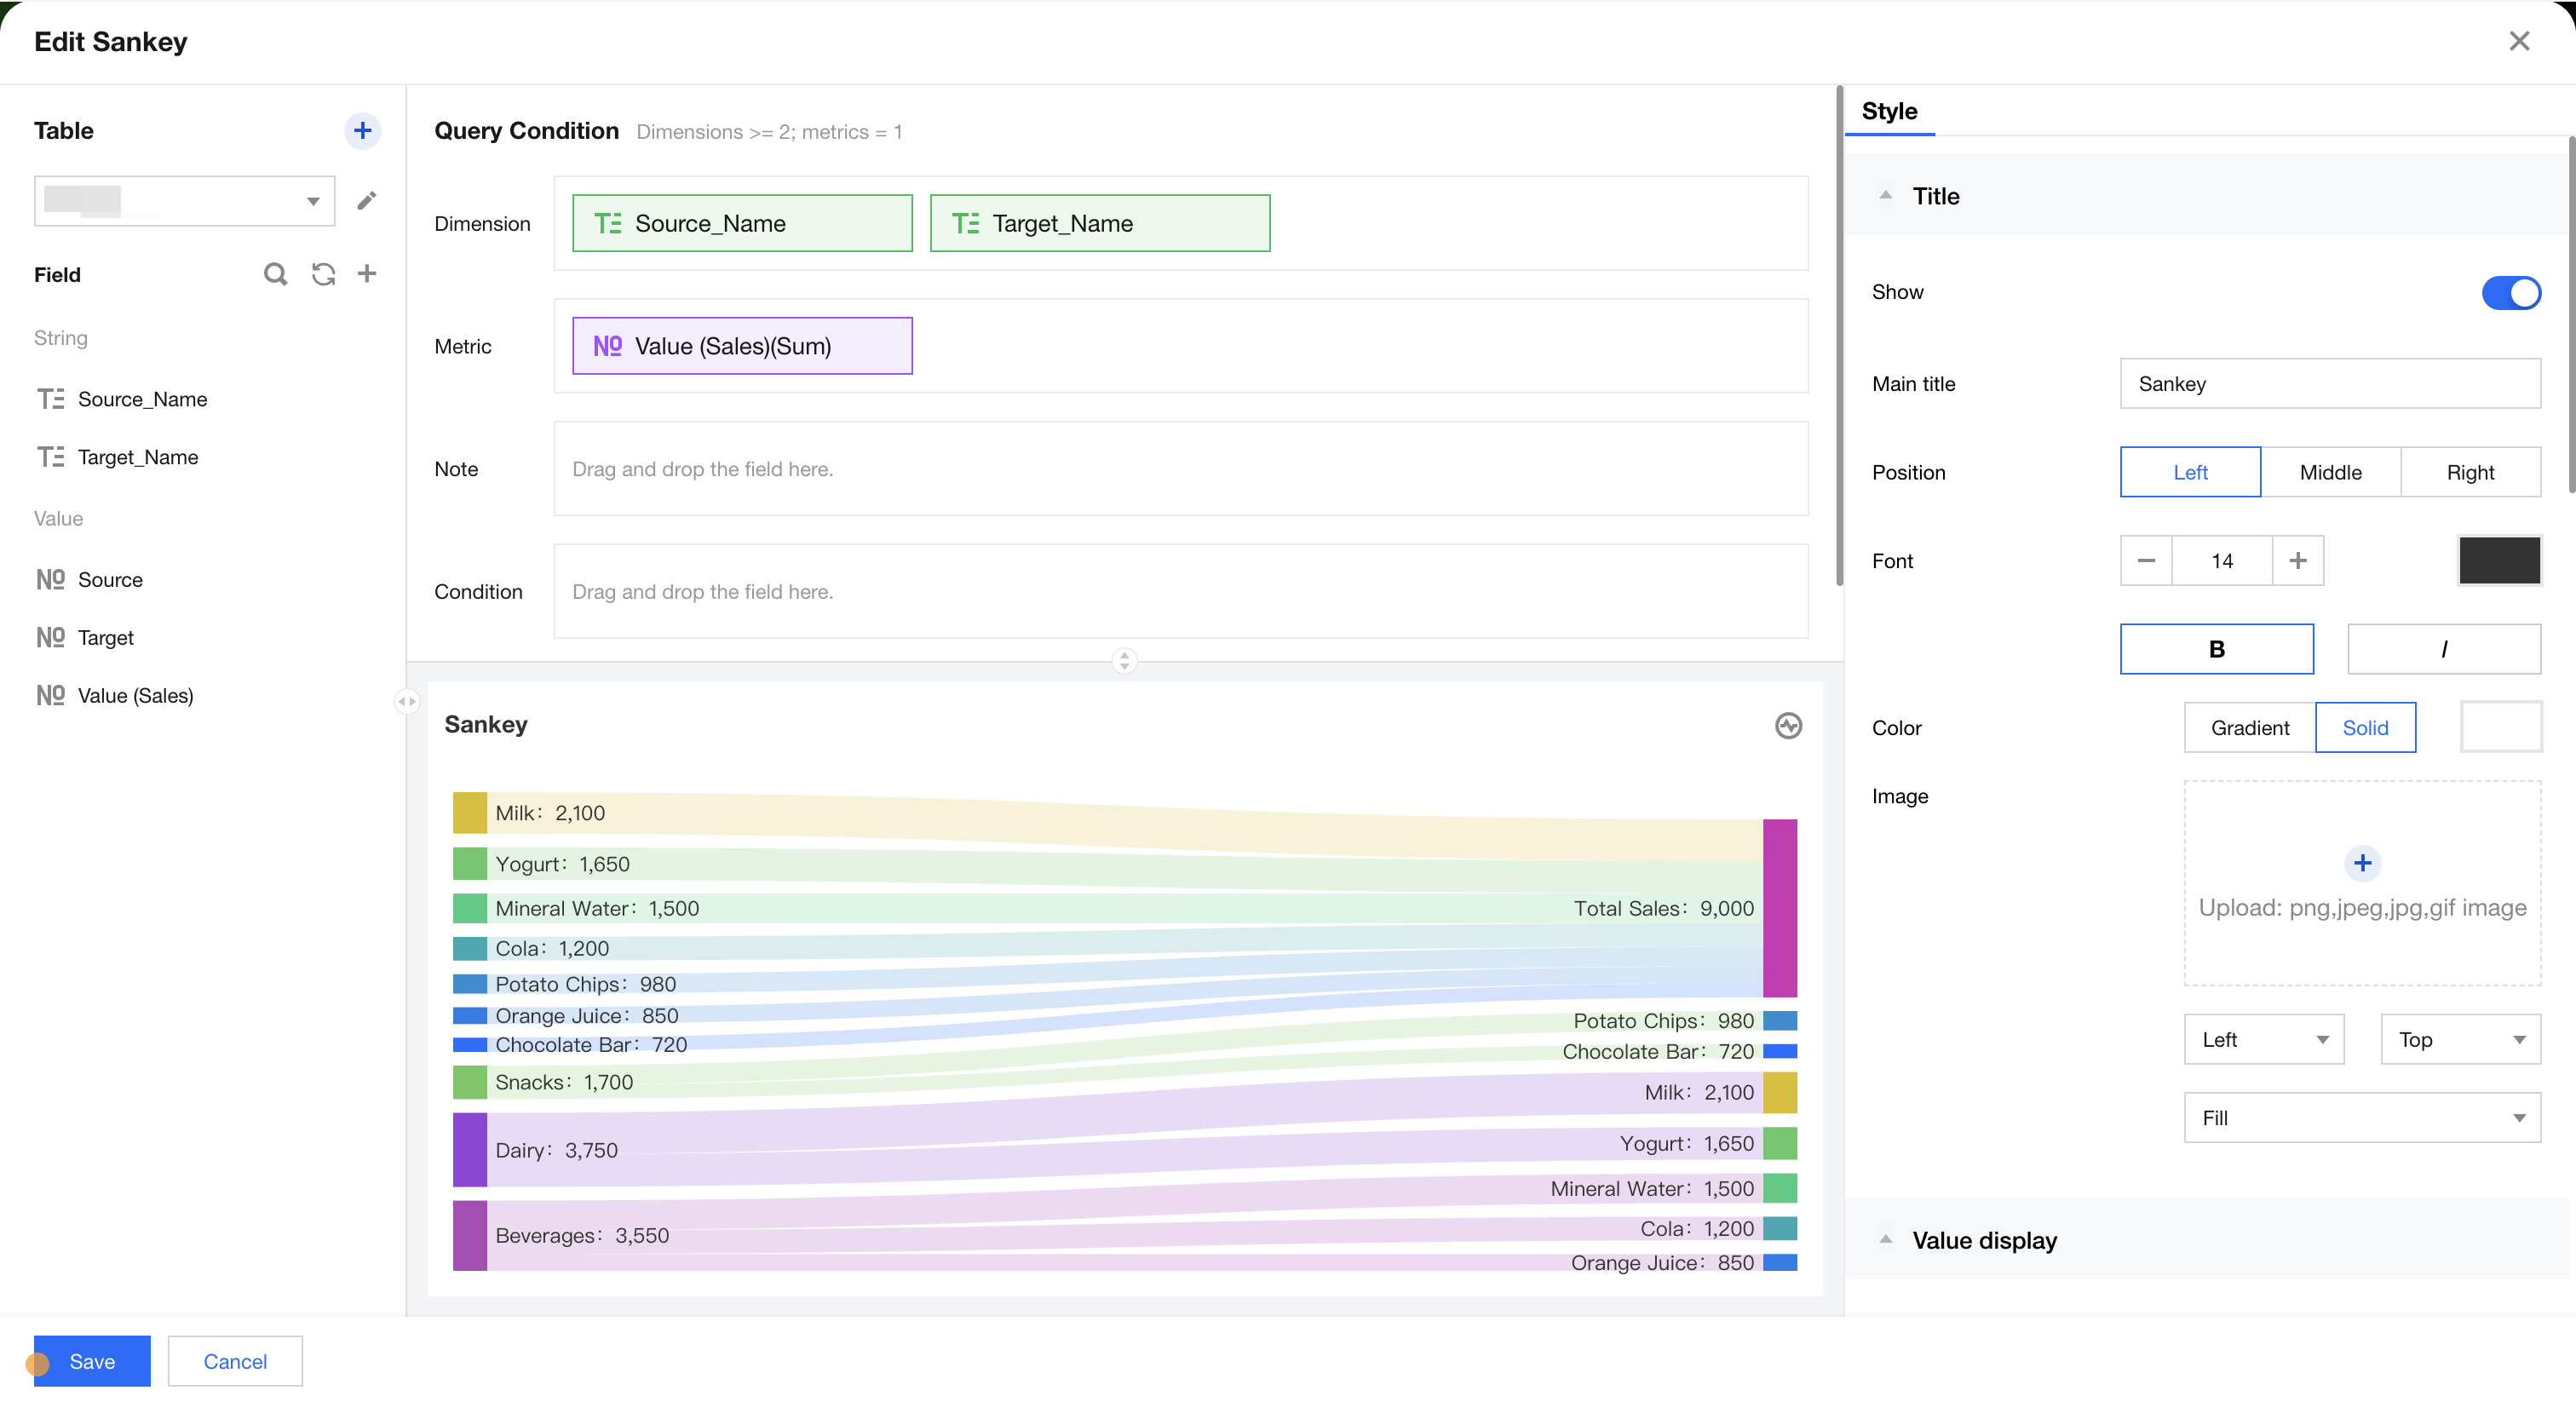
Sankey diagrams are mainly used to show the diversion of data from one set to another, where the branch width represents the data traffic size. As shown in the figure below, it displays the sales distribution data of each product in different categories.
Query Condition Settings
Dimensionality & metric count requirements: dimensions ≥2, metric=1. The condition area allows filtering data by dragging and dropping time, character, or numeric value fields. The immediate analysis button triggers chart data update display, with maximum display of XX results (0-10000) configurable on the right.
Component Style Settings
Sankey diagrams support the following style settings:
Setting Item
Setting Category
Setup Instructions
connection color
color monochrome
Set the connection color of the Sankey diagram to color/monochrome
transparency/color
Color configuration supports transparency, monochrome configuration allows specific color selection.
Title
Display
Enable/Disable Display Chart Title
Main Title
Set Chart Main Title
horizontal position
Set the horizontal position of the title display, such as left, center, or right.
numeric display
value type
Set the numeric display type, with three options: 1. Standard numerical value: for example, "1211" shows as "1211" 2. Percentage: for example, "0.11" shows as "11%" 3. Thousands separator: for example, "1211" shows as "1,211"
value unit
Set the value unit, with the following options: 1. None 2. Ten thousand: for example, "121112" shows as 12.111, analogous units follow
3.million 4. ten million 5. one hundred million 6. one billion 7. billions of
decimal places retained
Set the number of decimal places. For example, "1211.2334" shows as "1211.23" when set to retain 2 decimal places.
Tag
Display
Enable/Disable Display Tag
data name
If needed, display the data name by enabling it.
Data value.
If needed, display the numeric value by enabling it. Normally, enable tag display, and data value must be enabled simultaneously.
Scatter Chart
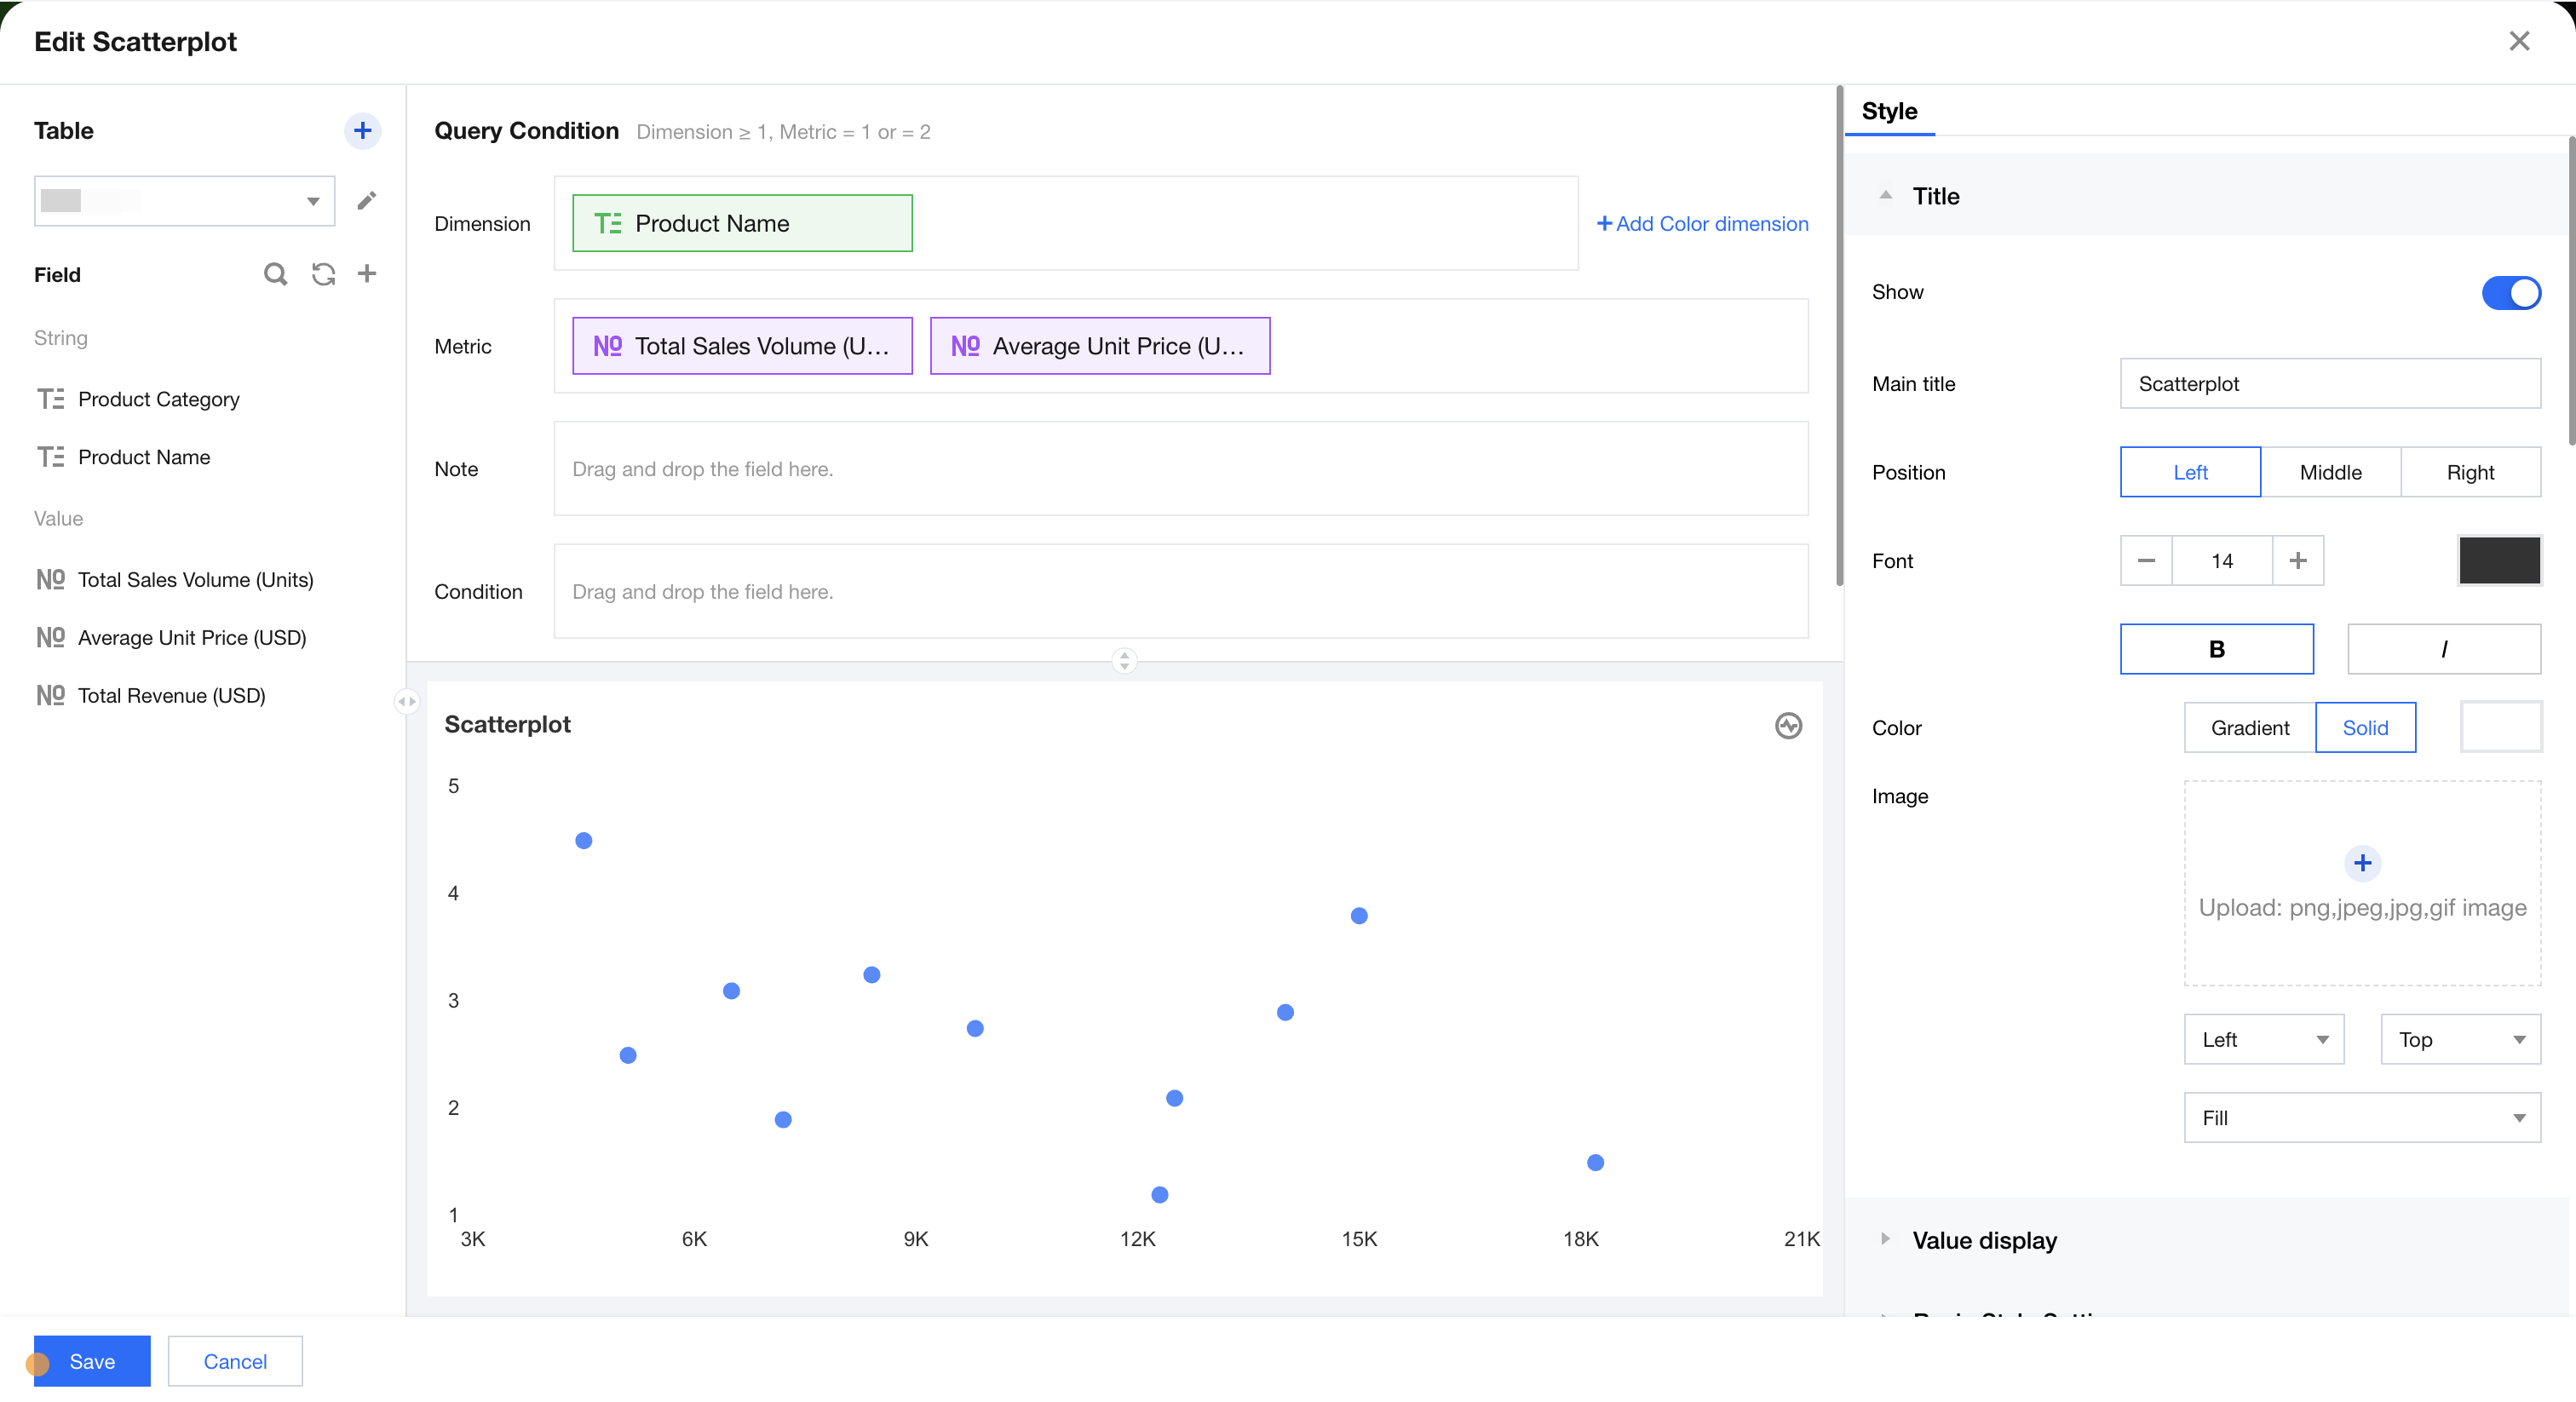
The scatter chart is mainly used to show the correlation and distribution relationship of data. As shown in the figure below, it displays the total sales volume and average unit price distribution data of different products.
Query Condition Settings
Dimensionality & metric count requirements: dimensions ≥1, metrics=2. Condition area allows conditional filtering of data by dragging and dropping time, character, or numeric value fields. The immediate analysis button triggers chart data updates, and you can set a maximum display of XX results (0-10000) on the right.
Component Style Settings
Scatter charts support the following style settings:
Setting Item
Setting Category
Setup Instructions
Title
Display
Enable/Disable Display Chart Title
Main Title
Set Chart Main Title
horizontal position
Set the horizontal position of the title display, such as left, center, or right.
numeric display
value type
Set the numeric display type, with three options: 1. Standard numerical value: for example, "1211" shows as "1211" 2. Percentage: for example, "0.11" shows as "11%" 3. Thousands separator: for example, "1211" shows as "1,211"
value unit
Set the value unit, with the following options: 1. None 2. Ten thousand: for example, "121112" shows as 12.111, analogous units follow 3. Million 4. Ten million 5. Hundred million 6. One billion 7. Billions of
decimal places retained
Set the number of decimal places. For example, "1211.2334" shows as "1211.23" when set to retain 2 decimal places.
Legend
Display
Enable/Disable Legend Display
toward
Set the legend arrangement direction, with horizontal and vertical options
align alignment
Set the legend alignment mode, with left, center, and right options
Position
Set the legend position, with top, center, and bottom options