Performance Testing Steps and Results for CKafka Based on OpenMessaging
Download
Focus Mode
Font Size
Test Environment Preparations
Preliminary Preparations
Before formal load testing, you need to purchase load testing servers (to purchase Cloud Virtual Machine (CVM) instances, see Instance Creation Guide). Ensure that they are in the same Virtual Private Cloud (VPC) network as the routing access point of TDMQ for CKafka (CKafka) instances, and select nearby availability zones (AZs) to avoid network latency caused by cross-region access.
Load testing servers used in subsequent test results in this document and their configurations:
Quantity: 37 units (1 master, 18 producers, and 18 consumers).
Specifications: 8c16g.
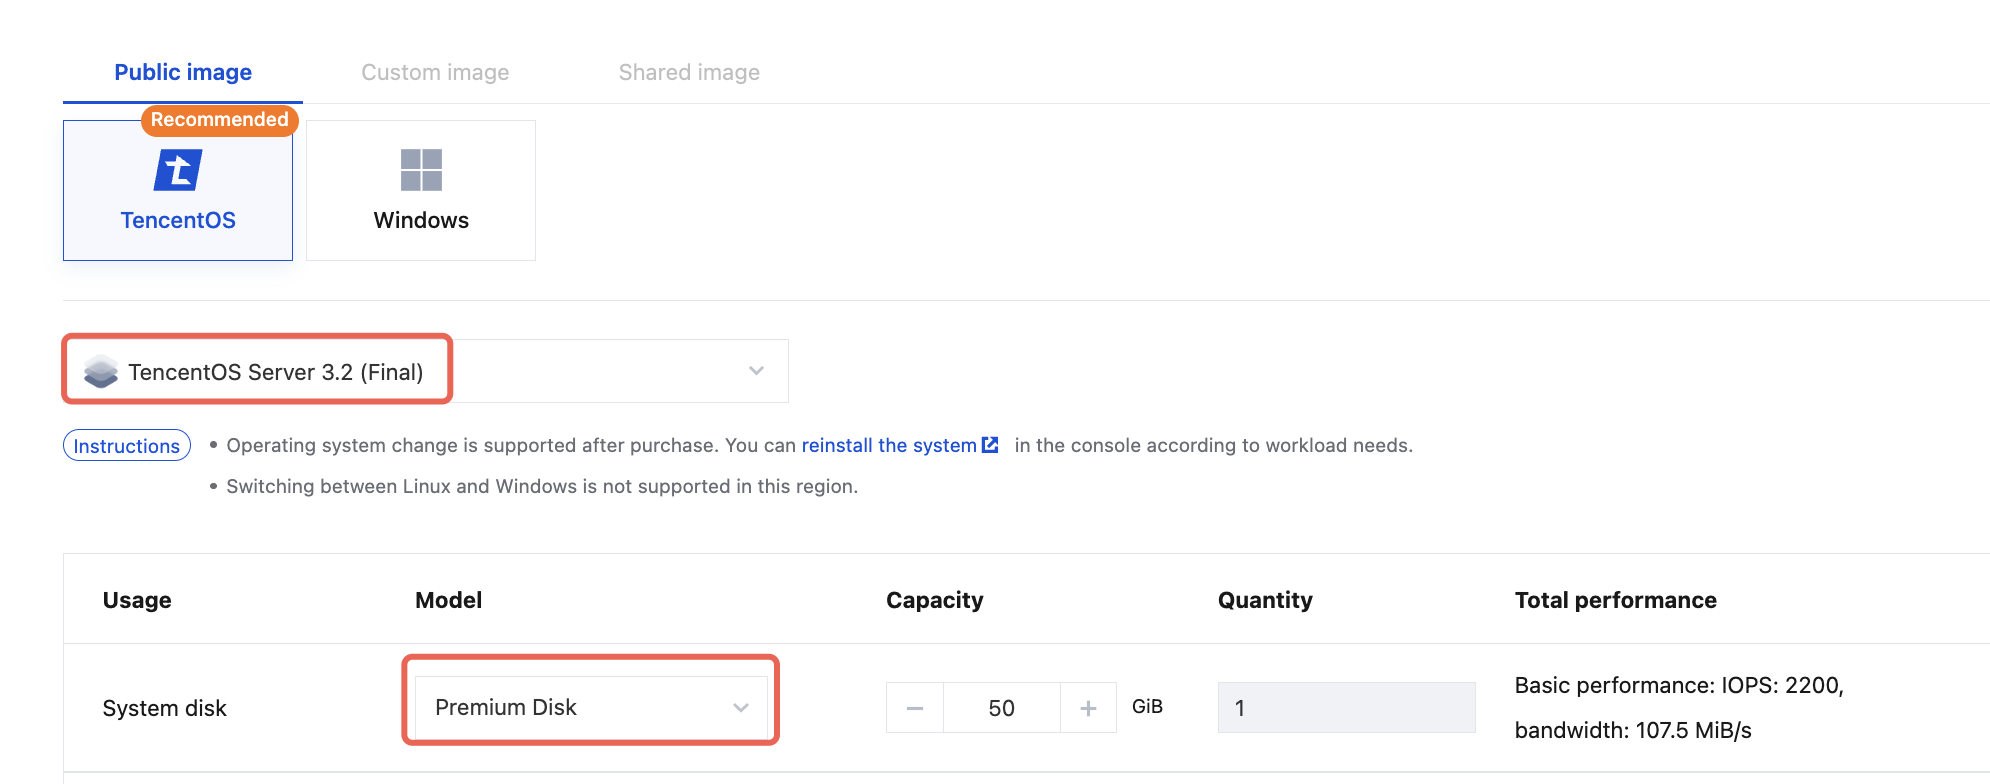
Image and disk configurations are as follows:
CKafka Instance Preparations
CKafka Instance Purchase
Purchase a CKafka Pro Edition instance as instructed in Creating an Instance. The instance to be tested should have the corresponding specifications and be a two-AZ version.
CKafka Topic Preparations
Total number of topics: 10.
Number of topic replicas: 2.
Number of topic partitions: Total number of partitions of the instance specification/(10 x 2).
Topic name: It needs to match the topics defined in the driver.yaml configuration file.
Note:
It is recommended to configure the overall settings based on the full consumption of partition specifications and production bandwidth.
CKafka Access Point
Enter the IP address and port of the access point in the bootstrap.servers field of the driver.yaml configuration file.
Installation and Deployment of OpenMessaging
1. Download the latest code of OpenMessaging.
2. Build an executable package of OpenMessaging:
# Installing Java 17 and Maven is required.mvn clean package
3. Upload the package to the purchased CVM instances and decompress it:
tar -zxvf openmessaging-benchmark.tar.gz
OpenMessaging Parameter Configuration
Driver Configuration File
Configuration file name: driver.yaml.
The content of the configuration file is shown below:
name: KafkadriverClass: io.openmessaging.benchmark.driver.kafka.KafkaBenchmarkDriverreplicationFactor: 2reset: falseuseMyTopic: truetopics: topic_1,topic_2,topic_3,topic_4,topic_5,topic_6,topic_7,topic_8,topic_9,topic_10 #Match the names of the 10 topics actually created.useSharedConsumerGroup: falsetopicConfig: |min.insync.replicas=2commonConfig: |bootstrap.servers= #Access point route.producerConfig: |acks=1compression.type=none #Compression algorithms can be configured as None, GZIP, Snappy, and LZ4, respectively.linger.ms=30000batch.size=32768receive.buffer.bytes = 32768max.request.size=1048576max.in.flight.requests.per.connection=5request.timeout.ms=30000consumerConfig: |auto.offset.reset=latestenable.auto.commit=truereceive.buffer.bytes = 32768max.partition.fetch.bytes = 1048576fetch.max.wait.ms=500max.poll.interval.ms=300000
TestCase Configuration File
Configuration file name: testcase.yaml.
The content of the configuration file is shown below:
name: perftesttopics: 10partitionsPerTopic: 100 #Total number of partitions of the instance/(10 x 2).messageSize: 1024 #When compression algorithms are disabled, set this to 1024. To enable compression algorithms, see 3.4 Compression Ratio Configuration.payloadFile: "date.file"subscriptionsPerTopic: 1consumerPerSubscription: 120producersPerTopic: 100 #Set it to 10 when the instance specification is 20 MB. Set it to 100 for other cases.useRandomizedPayloads: truerandomBytesRatio: 0.1producerRate: 307200 #Note: producerRate = (Instance bandwidth/2) x 1024.consumerBacklogSizeGB: 0testDurationMinutes: 30randomizedPayloadPoolSize: 100keyDistributor: RANDOM_NANO
Starting the OpenMessaging Test Service
Starting a Slave Node
Run the following command on the purchased CVM instances one by one:
cd openmessaging-benchmark-0.0.1-SNAPSHOT && sh bin/benchmark-worker --port 9090 --stats-port 9091
Starting a Master Node
Replace slave_ip1, slave_ip2... in the following command line with the actual IP addresses of slave servers to control the operation of slave servers via the master server.
cd openmessaging-benchmark-0.0.1-SNAPSHOT && bin/benchmark --drivers driver.yaml --workers http://slave_ip1:9090,http://slave_ip2:9090 testcase.yaml
Introduction to Load Testing Scenarios
Client Configurations
Producer Configurations
Parameter | Load Testing Value | Default Value |
Total Number of Topics | 10 | |
Number of Topic Replicas | 2 | |
Number of Producers per Topic | 100 | |
Number of Consumer Groups per Topic | 1 | |
Number of Consumers per Consumer Group | 5 | |
Average Message Size | 1KB | |
linger.ms | 30000 | 0 |
batch.size | 32768 | 16384 |
receive.buffer.bytes | 32768 | 32 * 1024 |
acks | 1 | 1 |
compression.type | none | none |
max.in.flight.requests.per.connection | 5 | 5 |
max.request.size | 1048576 | 1M |
request.timeout.ms | 30 | 30s |
Consumer Configurations
Parameter | Load Testing Value | Default Value |
Number of Consumer Groups per Topic | 1 | |
Number of Consumers per Consumer Group | 120 (consistent with the number of partitions) | |
receive.buffer.bytes | 32768 | 32 * 1024 |
max.partition.fetch.bytes | 1048576 | 1M |
fetch.max.wait.ms | 500ms | 500ms |
max.poll.interval.ms | 300000 | 5 minutes |
Scenario 1: Real-Time Write and Read
Write data in real time and consume data synchronously to simulate the common read/write scenarios for most customers.
Scenario 2: Read Back After Writing
Write data for 10 minutes, wait for it to be flushed to the disk, and then set the client offset to 0 to start consumption. Meanwhile, continue to write data to simulate the read-back-after-writing scenarios for customers.
Load Testing Results
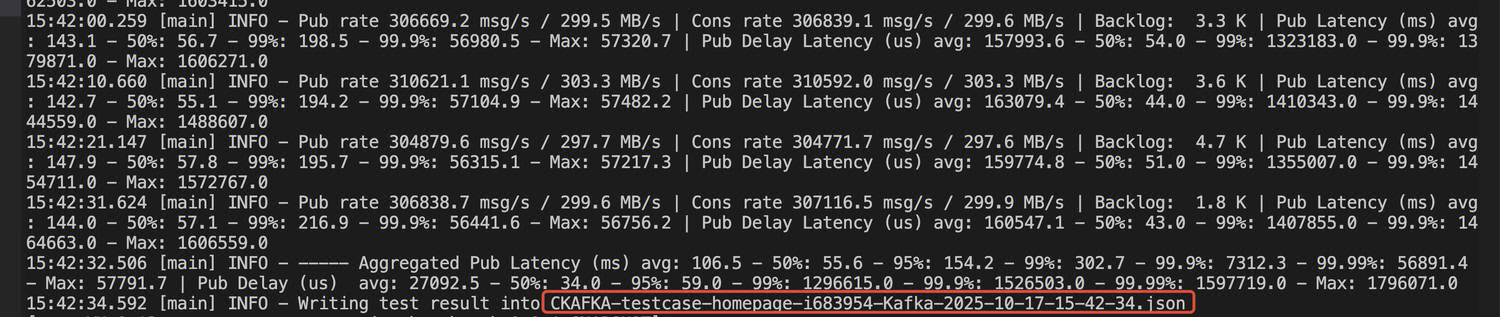
Viewing Load Testing Result Files
After completion, the following report file in JSON format will be generated on the master node:
Viewing Load Testing Metrics
Viewing Time Consumption Metrics
Production latency - average (ms): aggregatedPublishLatencyAvg.
Production latency - P95 (ms): aggregatedPublishLatency95pct.
Production latency - P99 (ms): aggregatedPublishLatency99pct.
End-to-end consumption latency - average (ms): aggregatedEndToEndLatencyAvg.
End-to-end consumption latency - P95 (ms): aggregatedEndToEndLatency95pct.
End-to-end consumption latency - P99 (ms): aggregatedEndToEndLatency99pct.
Note:
In Scenario 2, due to statistical latency issues with the client, the P95 and P999 data of end-to-end consumption latency can be viewed in the console.
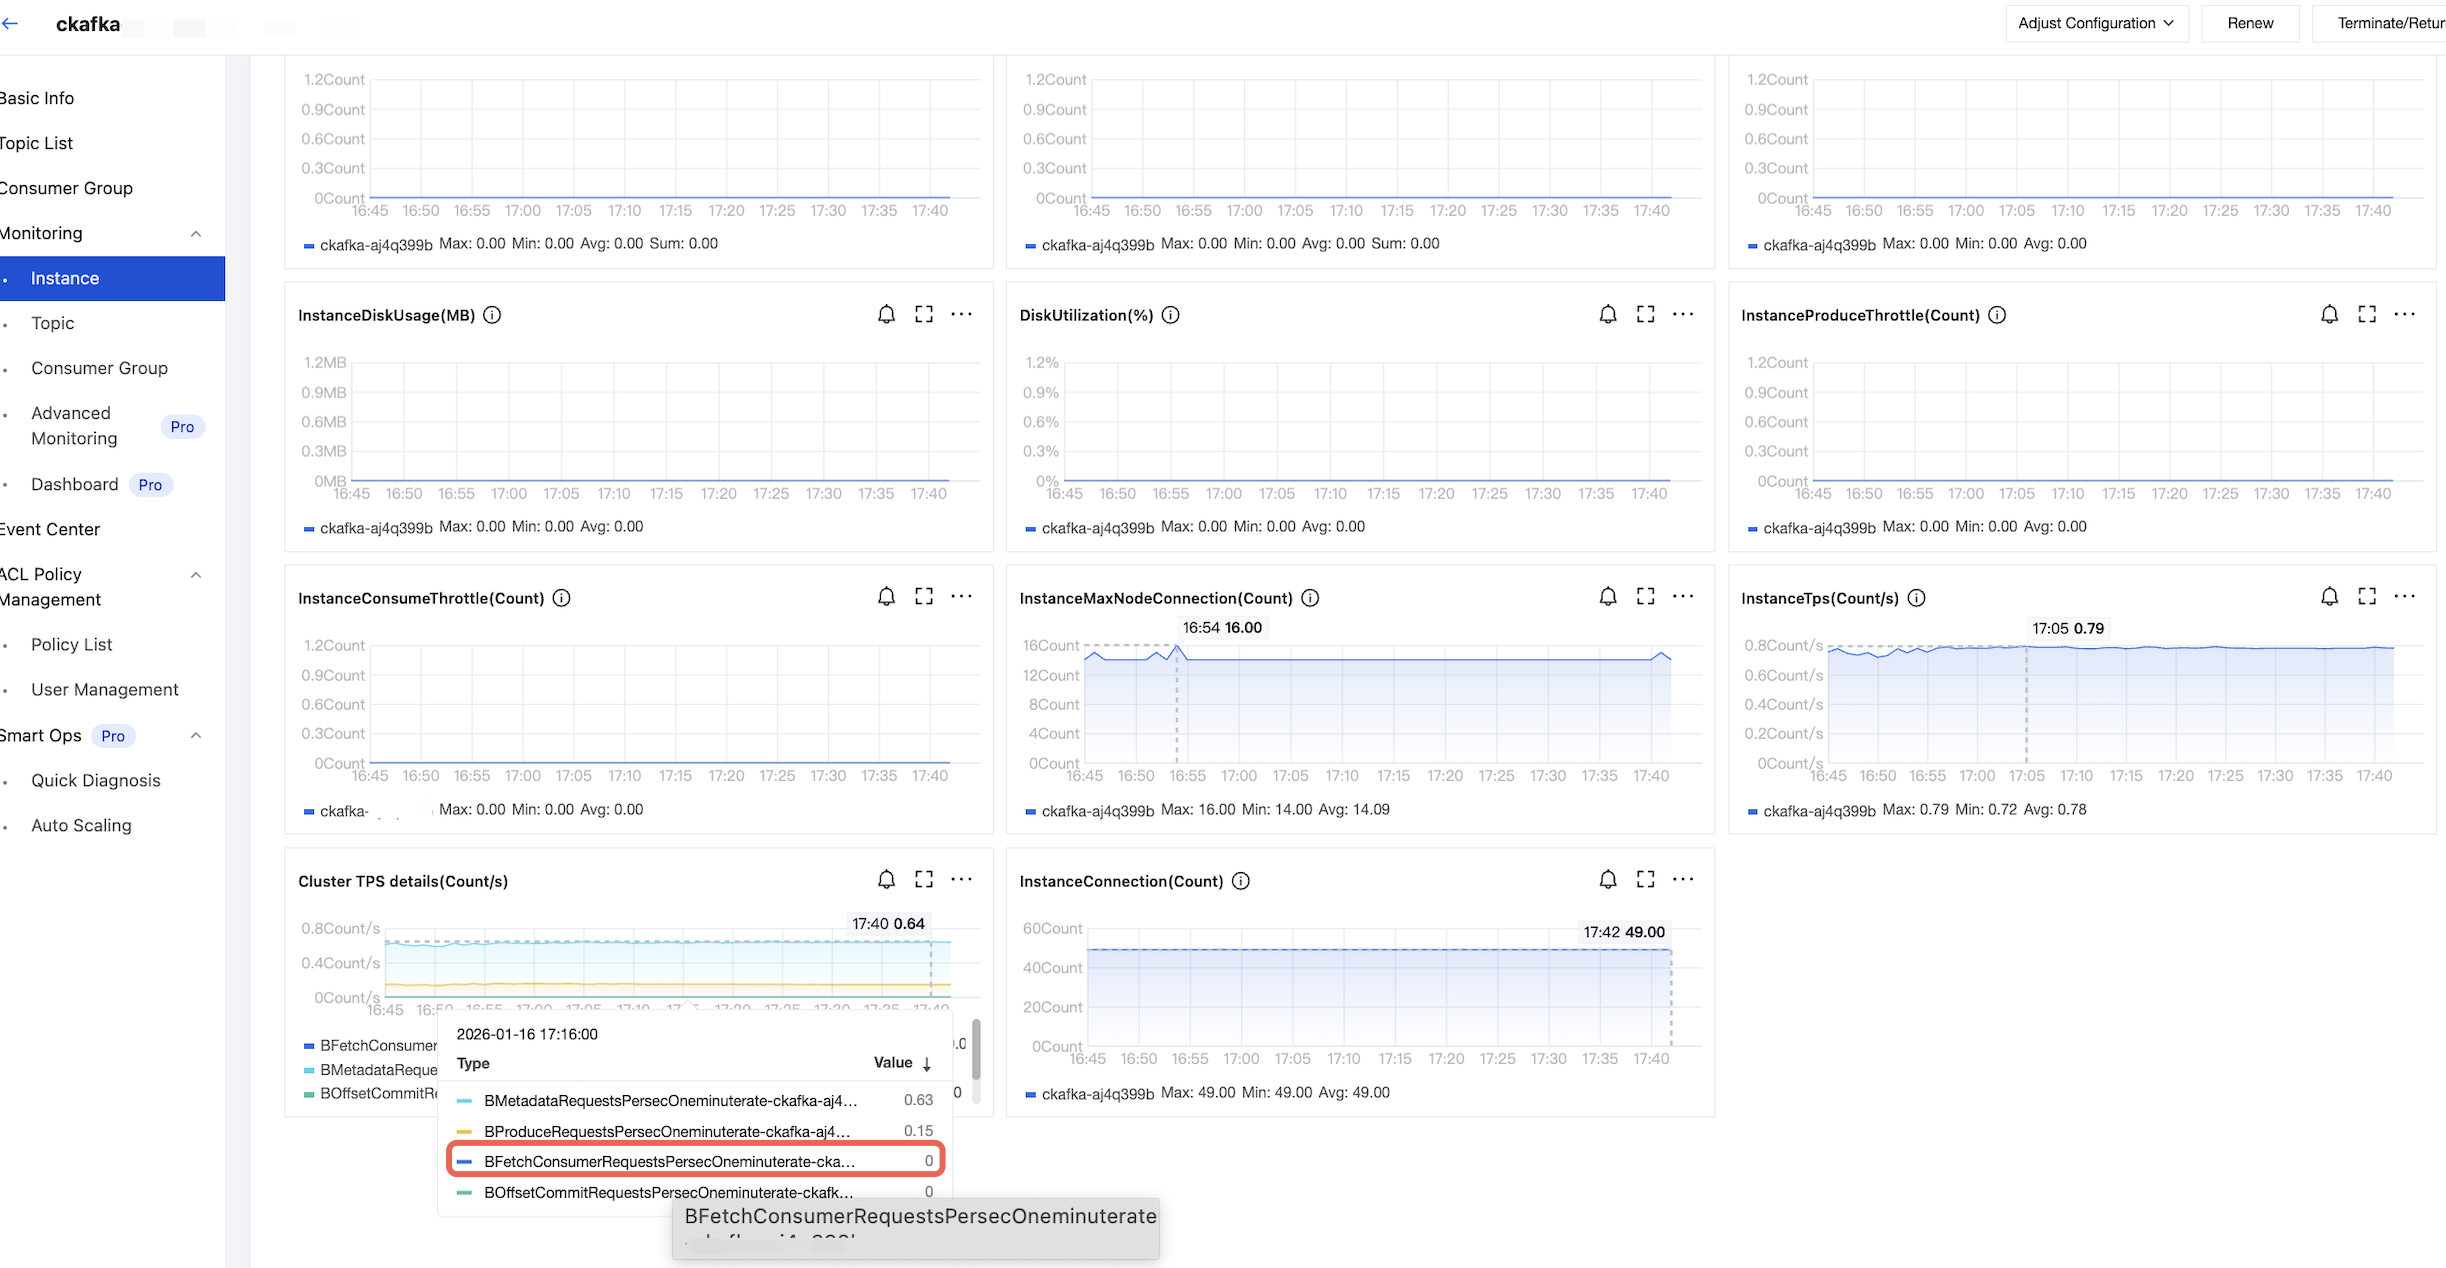
Viewing TPS Metrics
Production TPS: CKafka Console > Monitoring > Instance, as shown below:
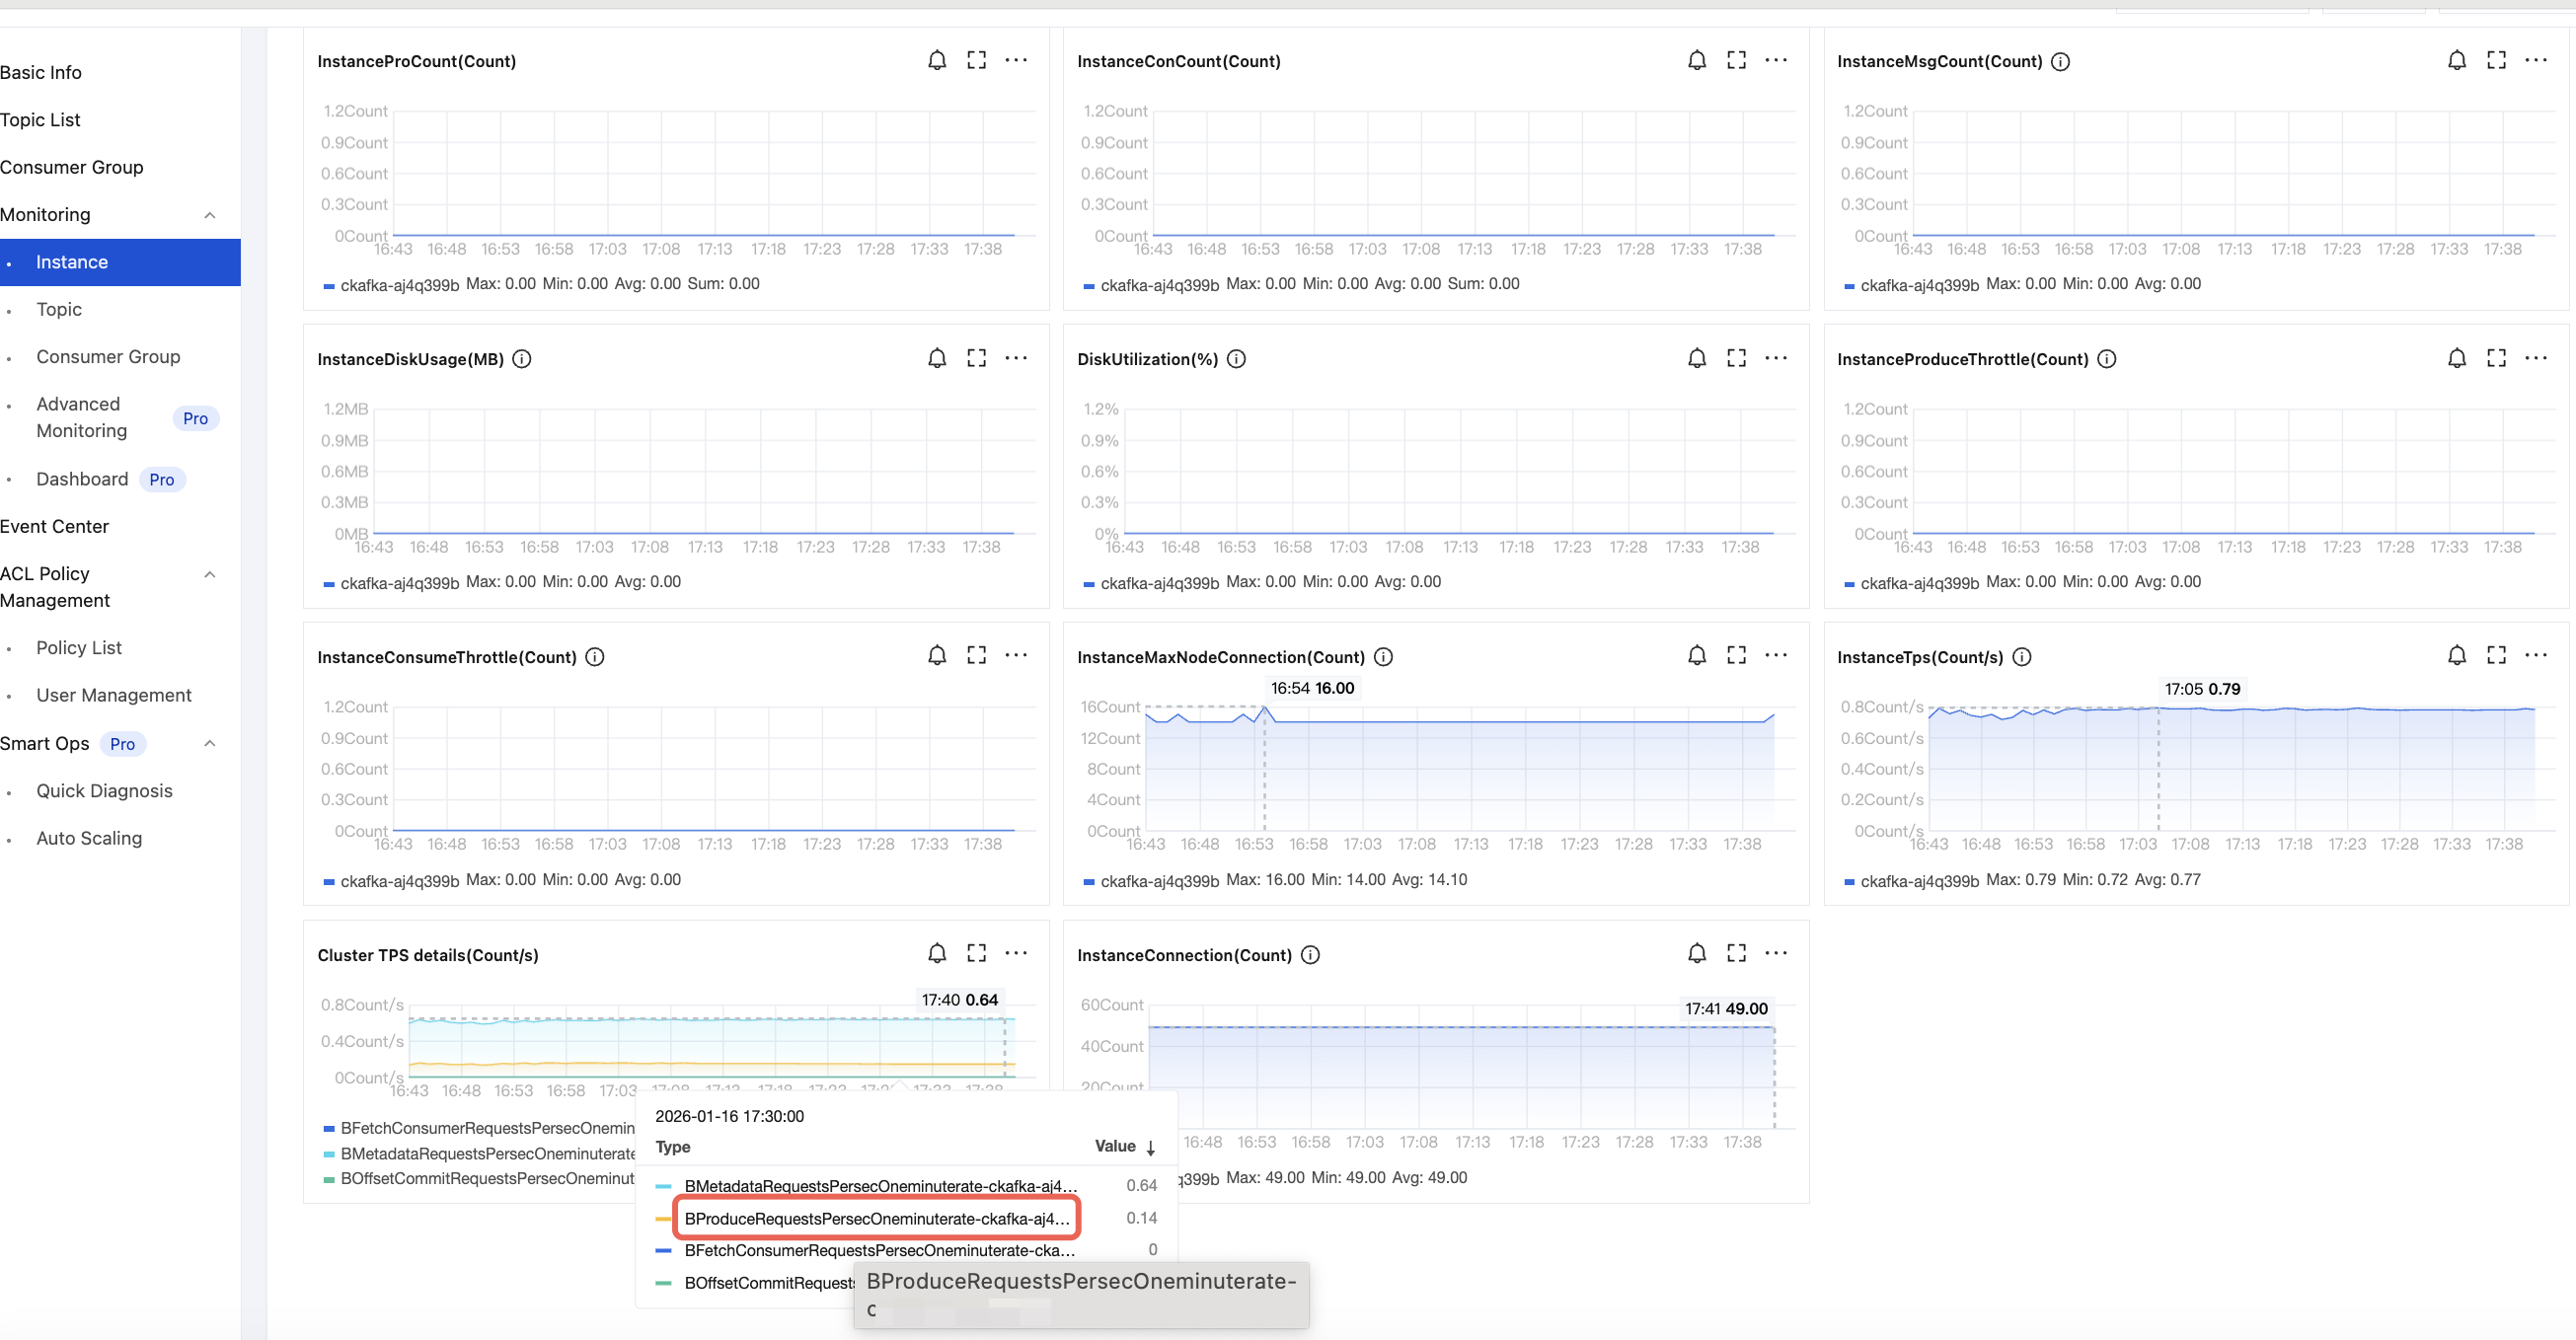
Consumption TPS: CKafka Console > Monitoring > Instance, as shown below:
Results of Scenario 1
Load Testing Specifications | Compression Configuration | Actual Production Bandwidth (MB/s) | Actual Consumption Bandwidth (MB/s) | Production Latency - Average (ms) | Production Latency - P95 (ms) | Production Latency - P99 (ms) | Consumption Latency - Average (ms) | Consumption Latency - P95 (ms) | Consumption Latency - P99 (ms) | Production QPS | Consumption QPS | Cluster Load Metric |
Instance bandwidth limit: 20 MB/s | Compression disabled | 10M | 10M | 2520 | 5045 | 5791 | 5 | 9 | 16 | 400 | 600 | 10% |
| GZIP enabled | 10M | 10M | 1294 | 2693 | 3213 | 5 | 9 | 16 | 800 | 920 | 20% |
| Snappy enabled | 10M | 10M | 1611 | 3303 | 3903 | 4 | 8 | 14 | 640 | 800 | 13% |
| LZ4 enabled | 10M | 10M | 1292 | 2691 | 3210 | 4 | 7 | 14 | 800 | 920 | 18% |
Instance bandwidth limit: 600 MB/s | Compression disabled | 300M | 300M | 4068 | 7968 | 8913 | 17 | 36 | 71 | 14920 | 14480 | 40% |
| GZIP enabled | 300M | 300M | 1919 | 3864 | 4475 | 26 | 69 | 138 | 32520 | 27600 | 93% |
| Snappy enabled | 300M | 300M | 2455 | 4910 | 5627 | 12 | 26 | 48 | 25000 | 23600 | 60% |
| LZ4 enabled | 300M | 300M | 1894 | 3837 | 4456 | 13 | 30 | 57 | 32760 | 30400 | 70% |
Instance bandwidth limit: 1600 MB/s | Compression disabled | 800M | 800M | 2268 | 4587 | 5221 | 43 | 152 | 340 | 48800 | 30000 | 50% |
| GZIP enabled | 800M | 800M | 1335 | 2679 | 3124 | 260 | 903 | 3295 | 94800 | 44000 | 100% |
| Snappy enabled | 800M | 800M | 2810 | 5580 | 6331 | 62 | 274 | 565 | 72800 | 52000 | 62% |
| LZ4 enabled | 800M | 800M | 1096 | 2215 | 2568 | 135 | 320 | 684 | 94400 | 59000 | 72% |
Note:
1. Why is the production latency without compression larger than that with compression?
When the batch size is configured to 32 KB, without compression, the actual batch size is 20 KB. With compression, it is 10 KB. Without compression, it takes a long time to form a batch; most of the time is spent on that.
2. What is the method to calculate production latency and consumption time metrics?
Production latency = Timestamp when a send message is called - Timestamp when the message is successfully sent (including the time for batch forming, compression, network sending, and waiting for broker response)
Consumption end-to-end latency = Timestamp from consumption to data - Timestamp when a message is persisted to the disk
Results of Scenario 2
Load Testing Specifications | Compression Configuration | Actual Production Bandwidth (MB/s) | Actual Consumption Bandwidth (MB/s) | Production Latency - Average (ms) | Production Latency - P95 (ms) | Production Latency - P99 (ms) | Server: Consumption Latency - P95 (ms) | Server: Consumption Latency - P999 (ms) | Production QPS | Consumption QPS | Cluster Load Metric |
Instance bandwidth limit: 20 MB/s | Compression disabled | 10M | 20M | 2520 | 5046 | 5794 | 50 | 500 | 400 | 260 | 10% |
| GZIP enabled | 10M | 20M | 1294 | 2694 | 3222 | 60 | 500 | 800 | 200 | 13% |
| Snappy enabled | 10M | 20M | 1612 | 3304 | 3898 | 60 | 500 | 640 | 180 | 12% |
| LZ4 enabled | 10M | 20M | 1290 | 2682 | 3207 | 60 | 500 | 800 | 180 | 12% |
Instance bandwidth limit: 600 MB/s | Compression disabled | 300M | 600M | 4072 | 7972 | 8919 | 180 | 280 | 14960 | 4960 | 40% |
| GZIP enabled | 300M | 600M | 1919 | 3866 | 4481 | 160 | 300 | 32520 | 5040 | 80% |
| Snappy enabled | 300M | 600M | 2452 | 4897 | 5606 | 170 | 270 | 25120 | 4920 | 41% |
| LZ4 enabled | 300M | 600M | 1890 | 3827 | 4440 | 170 | 300 | 32800 | 4800 | 52% |
Instance bandwidth limit: 1600 MB/s | Compression disabled | 800M | 1600M | 2290 | 4611 | 5249 | 180 | 450 | 48800 | 12000 | 45% |
| GZIP enabled | 800M | 1600M | 1364 | 2716 | 3175 | 180 | 670 | 94800 | 12000 | 90% |
| Snappy enabled | 800M | 1600M | 2823 | 5588 | 6342 | 170 | 460 | 73200 | 12000 | 50% |
| LZ4 enabled | 800M | 1600M | 1118 | 2240 | 2596 | 170 | 530 | 94800 | 12000 | 43% |
Help and Support
Was this page helpful?
You can also Contact sales or Submit a Ticket for help.
Help us improve! Rate your documentation experience in 5 mins.
Feedback