Overview
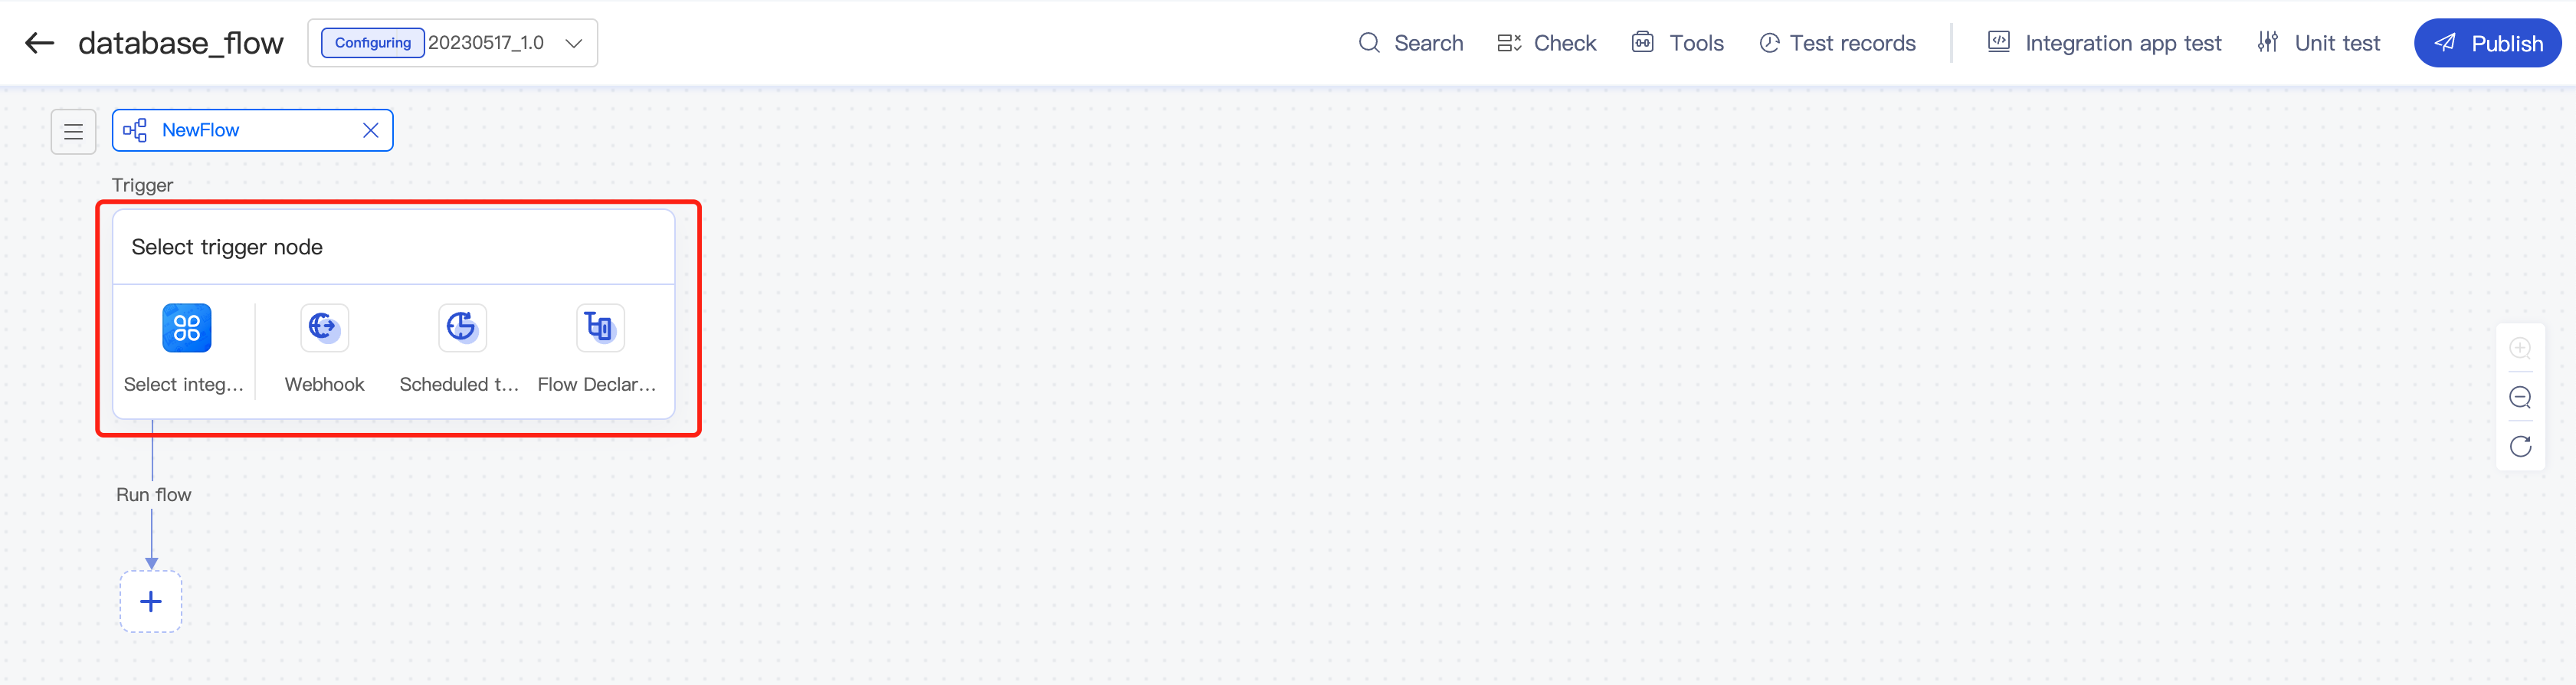
After entering an integration app, you can create multiple flows to implement your business logic. The flow canvas reserves a trigger component position for you to place a logical component or connector with trigger capabilities such as HTTP Listener, Kafka connector, and Scheduler. Flows with trigger capabilities are main flows, while those without trigger capabilities can only be referenced as subflows by other flows through the Flow Reference logical component.
Flow
In iPaaS, you can create a folder to aggregate relevant flows for hierarchical flow management. Within the same integration app, you can create and copy folders and flows for subsequent development and maintenance.
Creating a flow
You can create, copy, share, rename, and delete flows.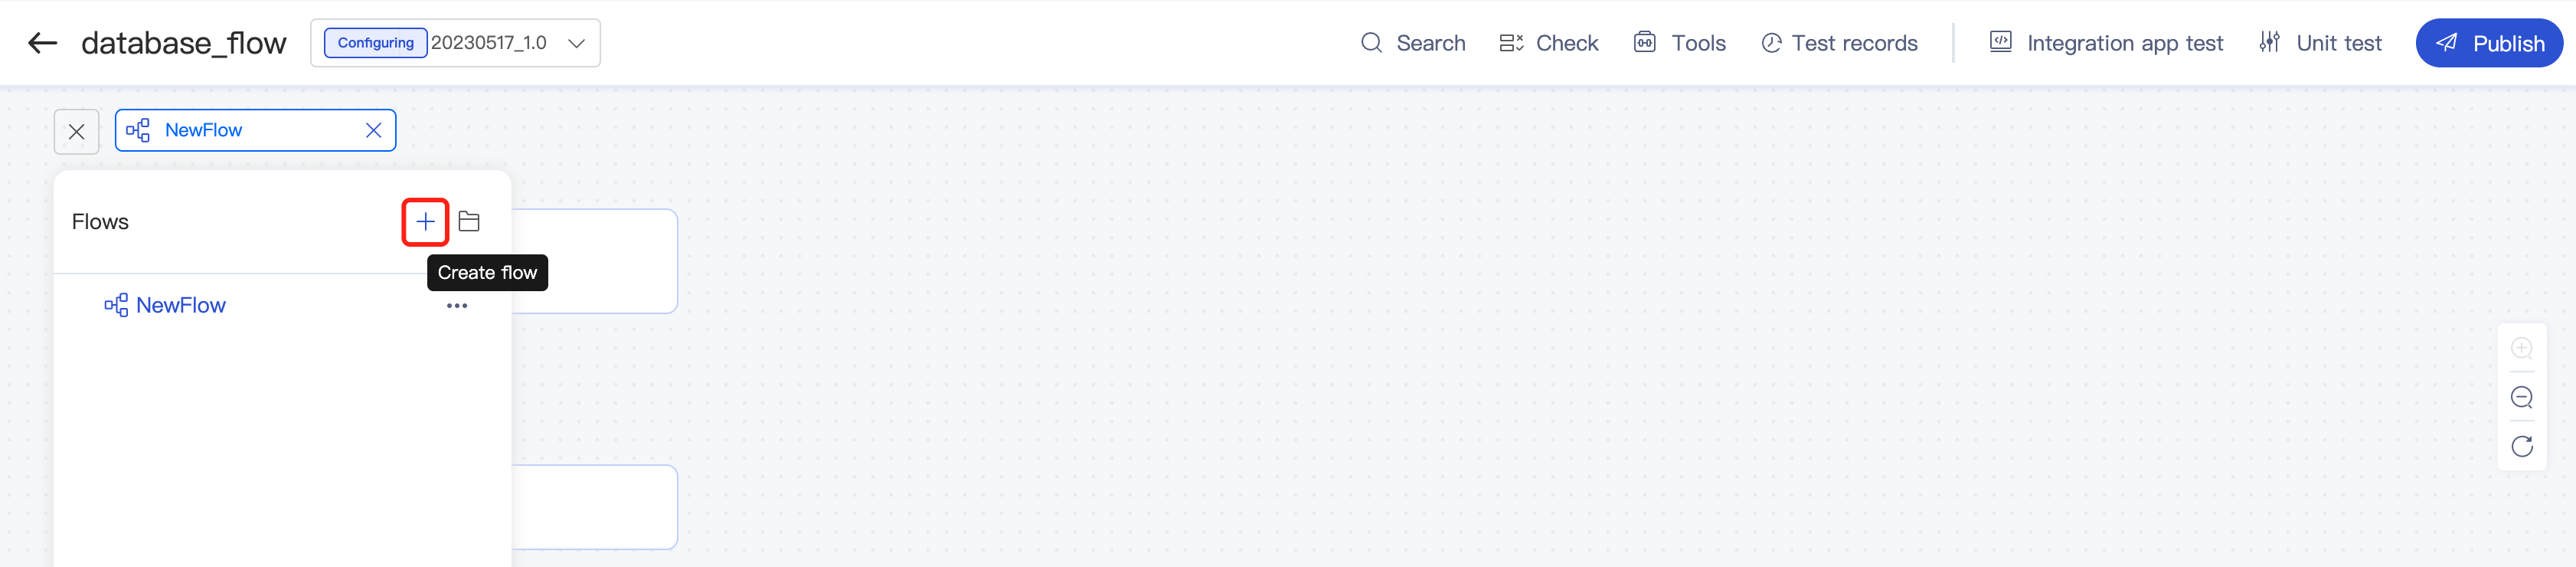
Copying a flow
You can copy flows within the same integration app. Click Copy, and the system will automatically create a flow named XXX_copy.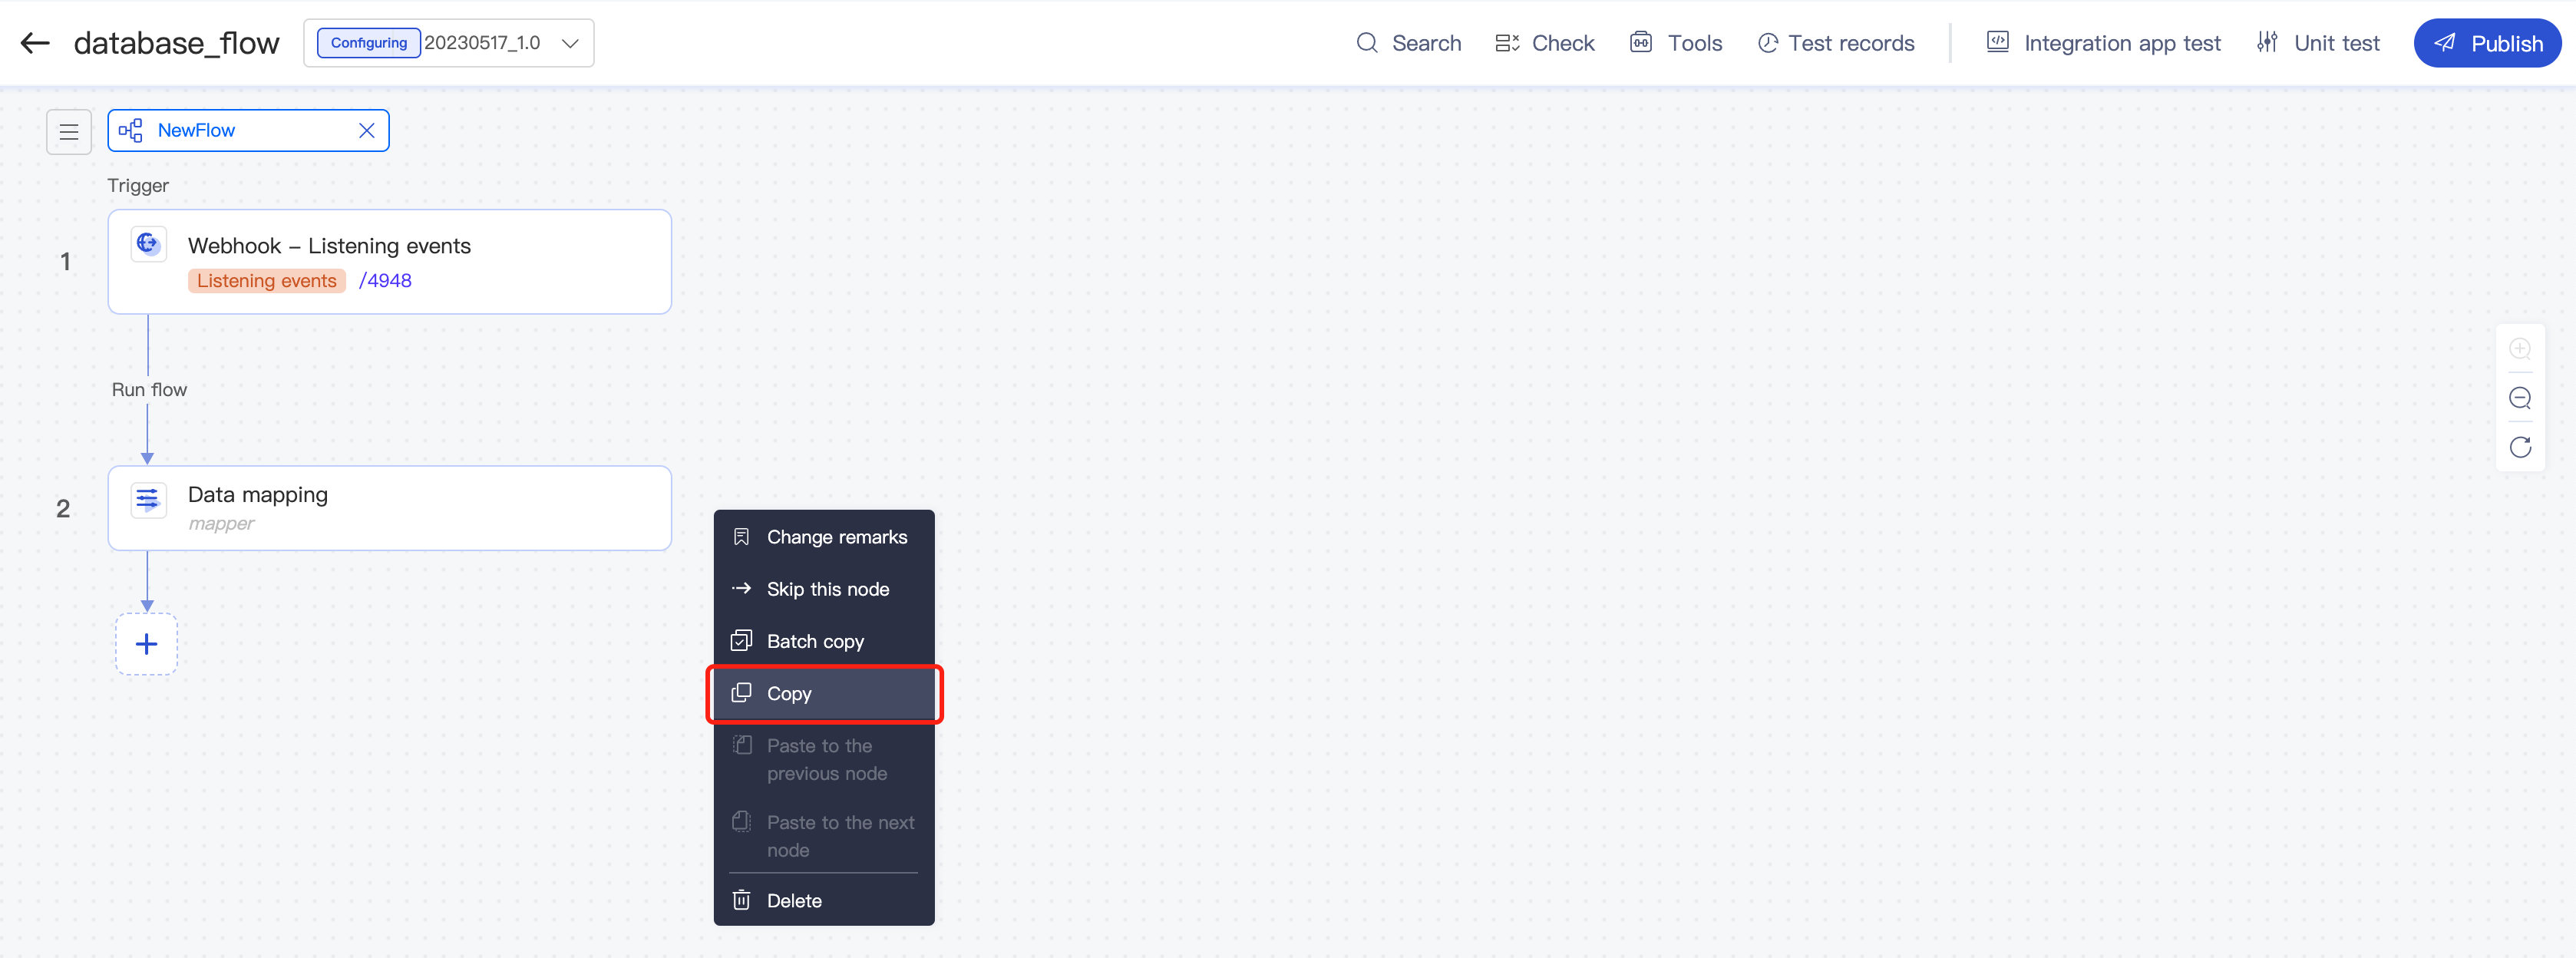
The Batch copy operation is also supported.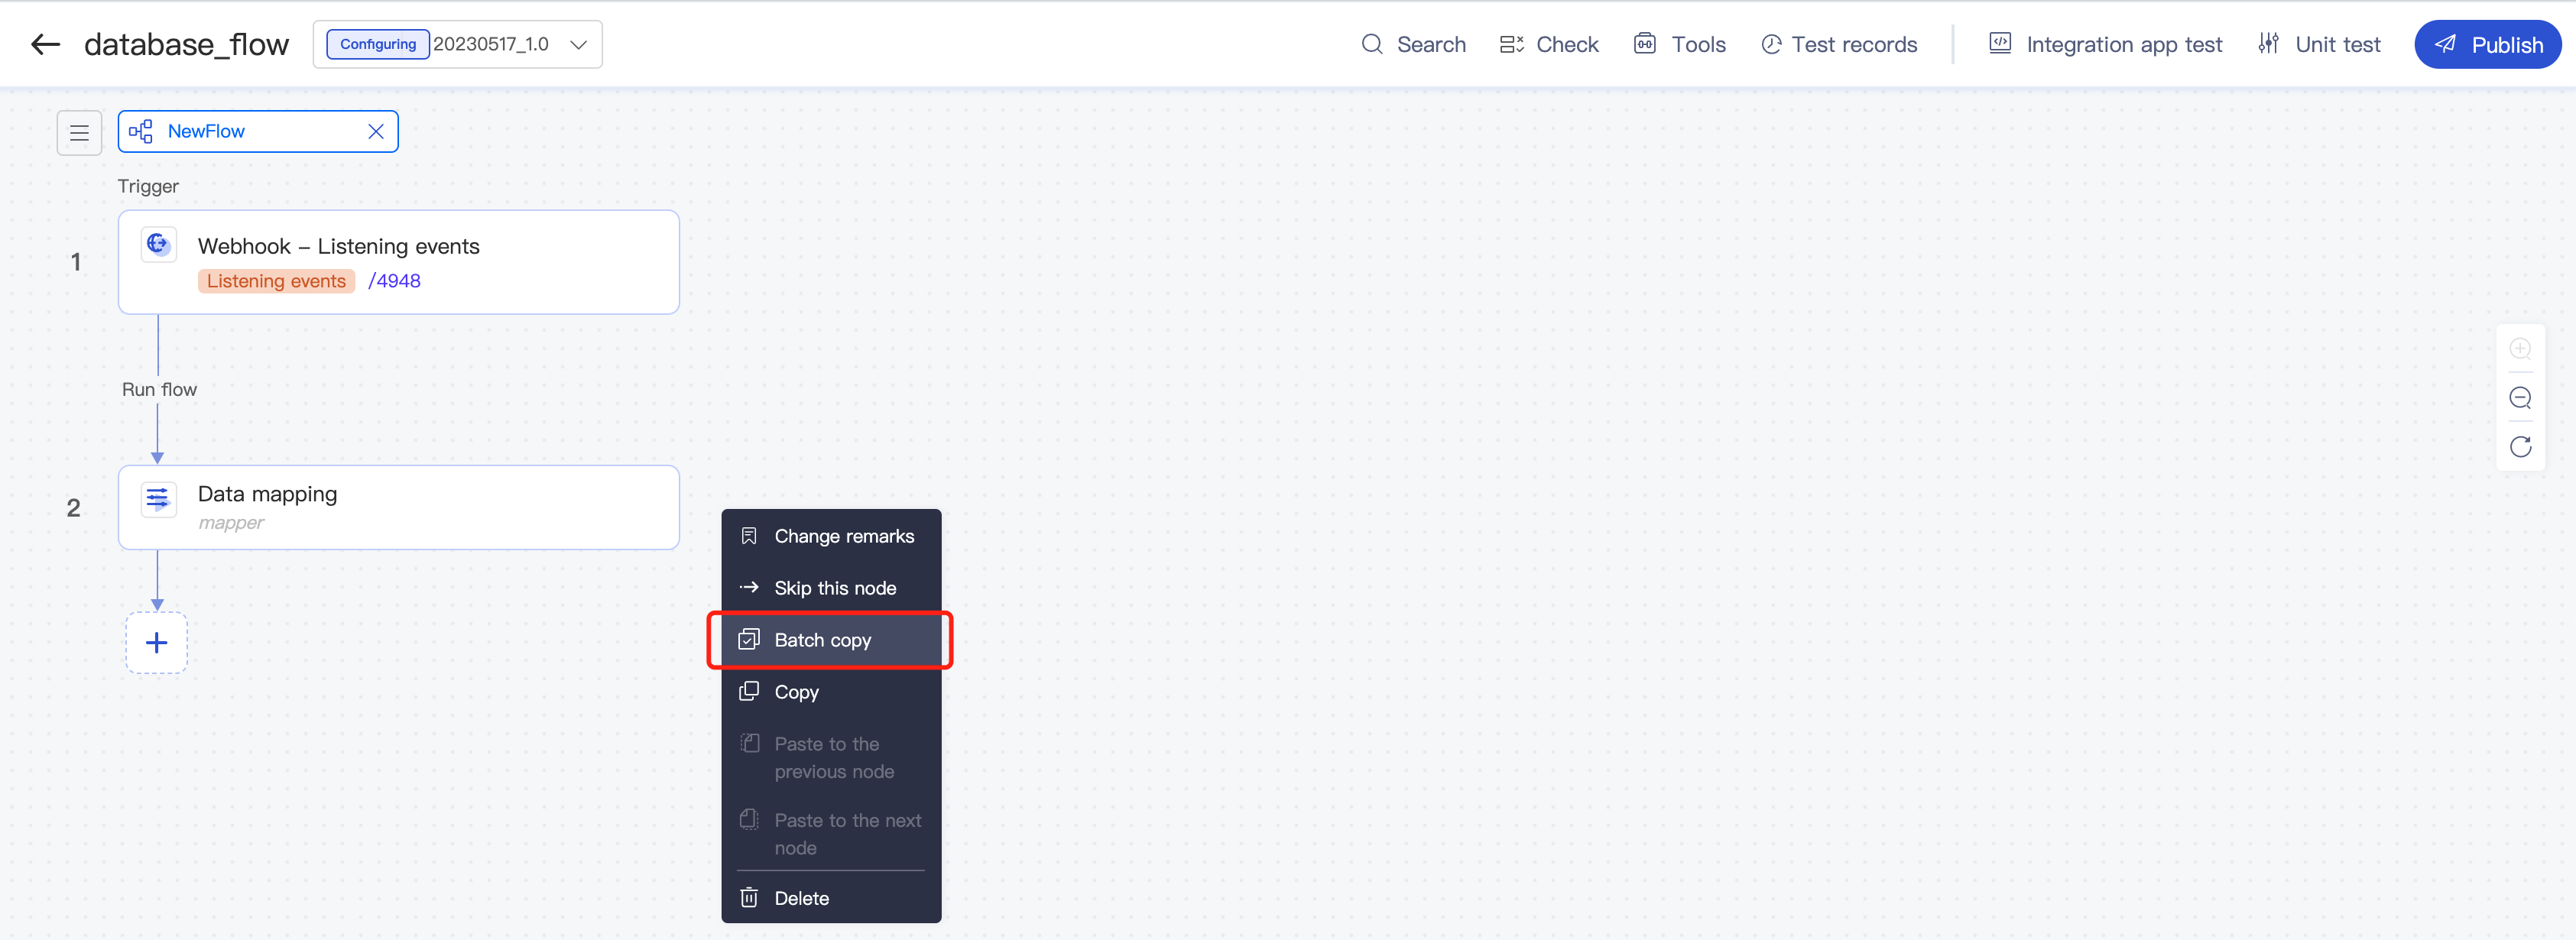
Click Batch copy, select all, a single, or multiple consecutive nodes (as with a unit test), and click Copy to batch copy the nodes.
If no nodes are selected, the Copy button is grayed out. It will be clickable after you select one or more nodes.
After clicking Copy, you can paste the content into other flows within the same project.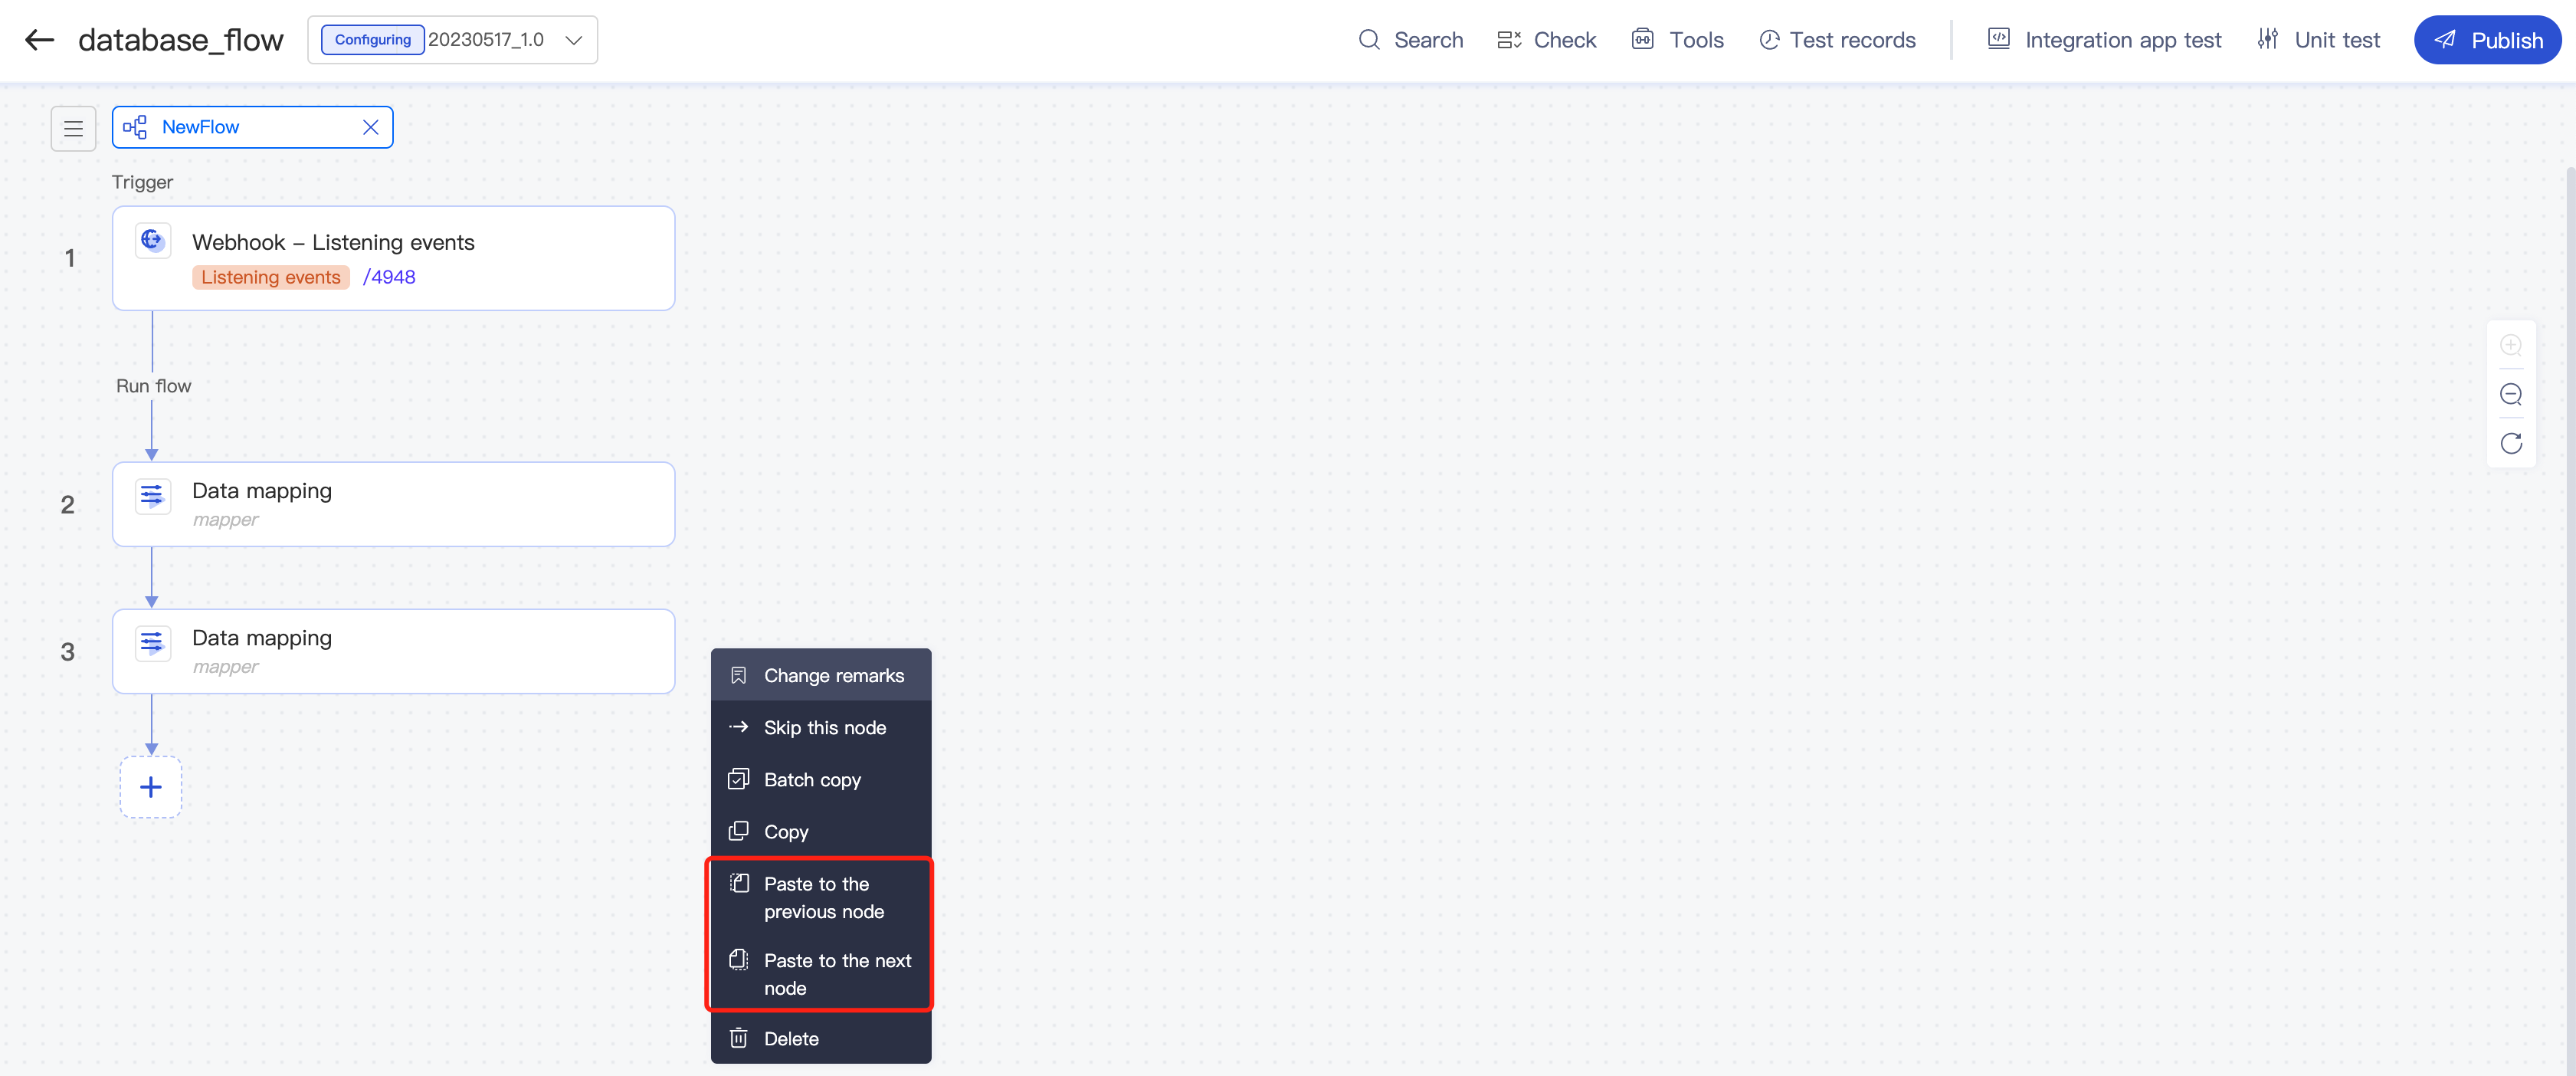
Sharing a flow
A shared flow can be referenced across integration apps within the same project through the Flow Reference component.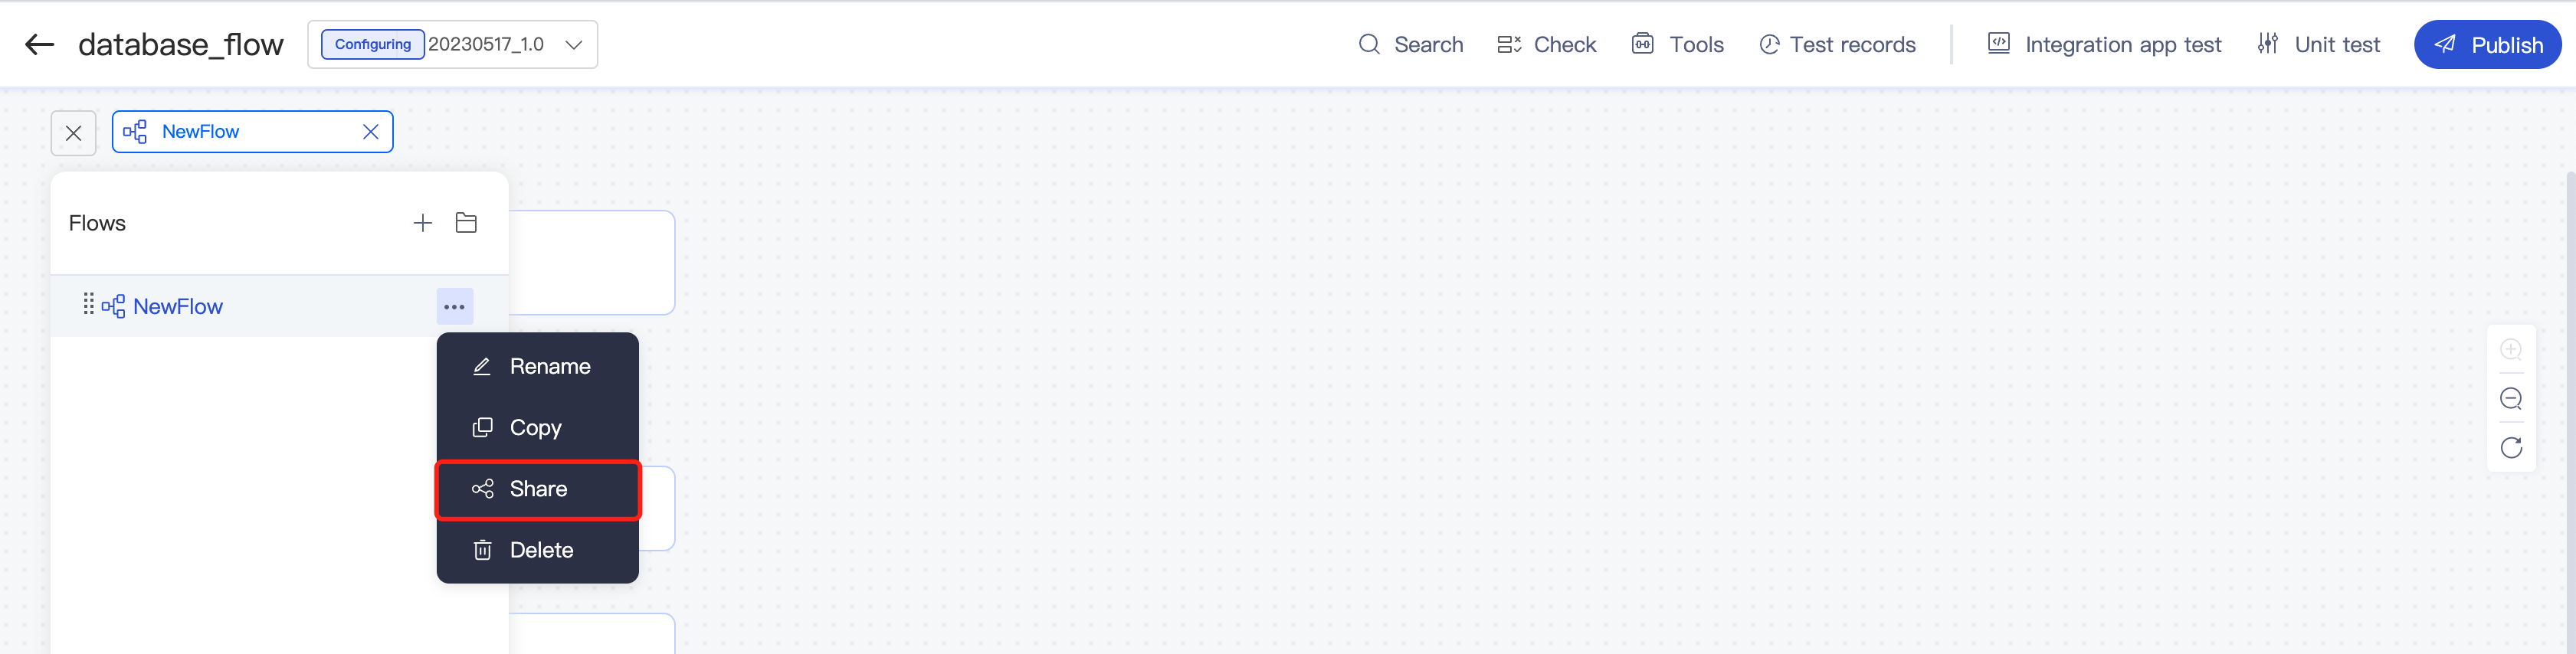
Select the Flow Reference component.
Deleting a flow
When a flow is deleted, all its configurations are cleared and cannot be recovered. Therefore, please exercise caution when deleting a flow.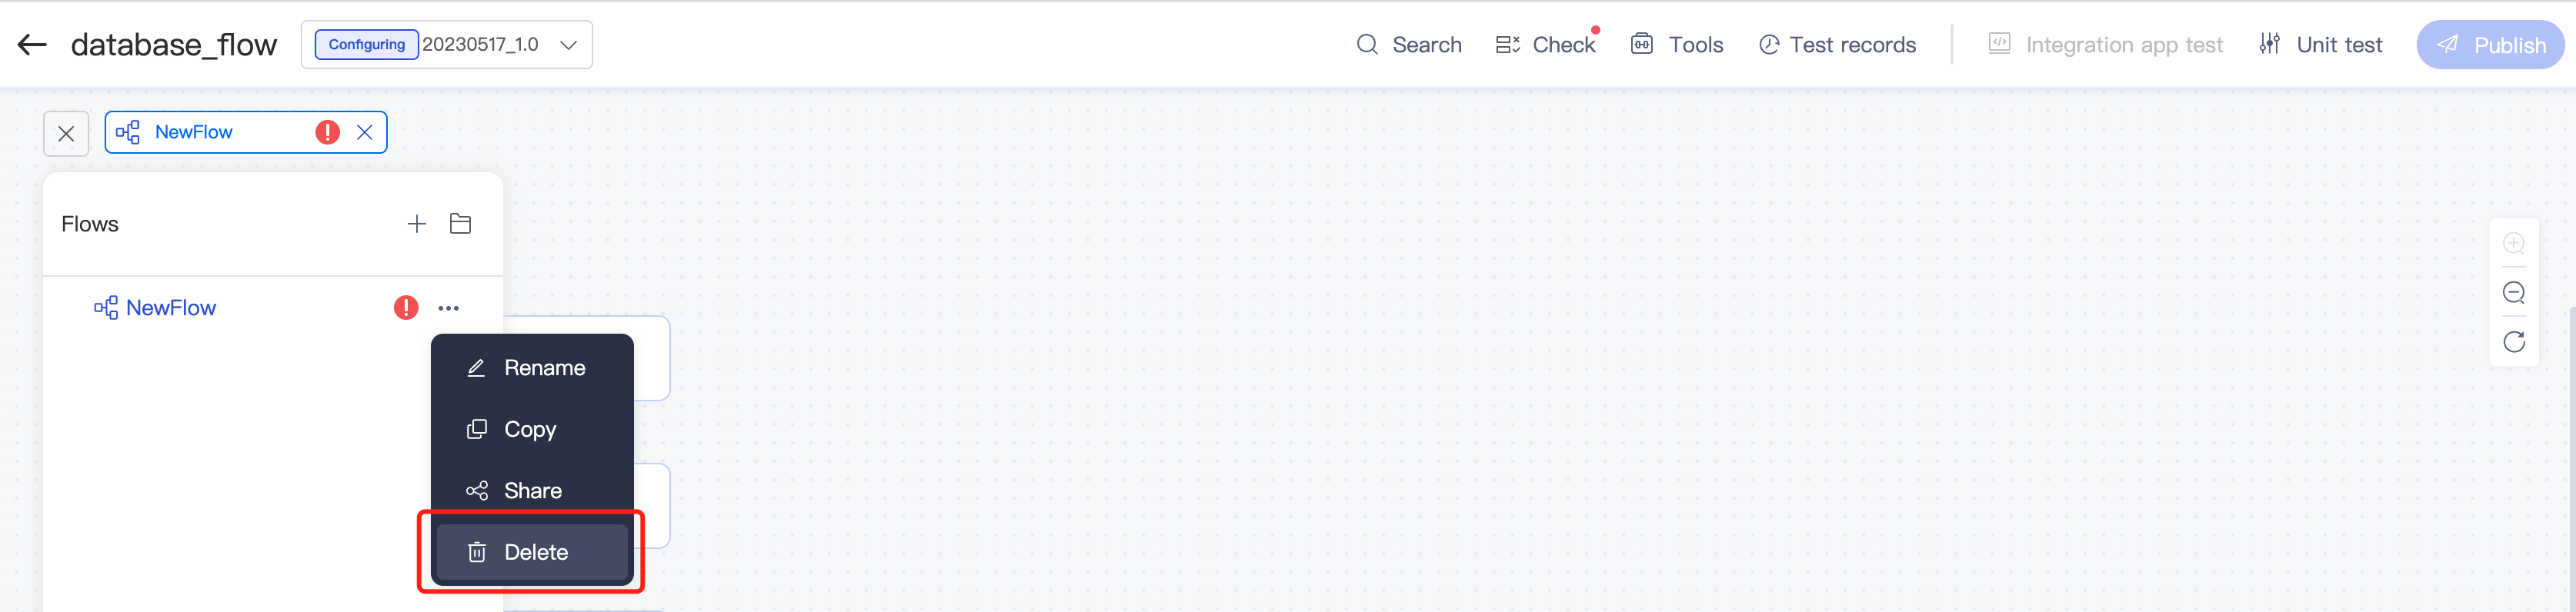
Folder
A folder can be used to aggregate relevant flows. You can create, copy, and add flows to folders for flow management and maintenance.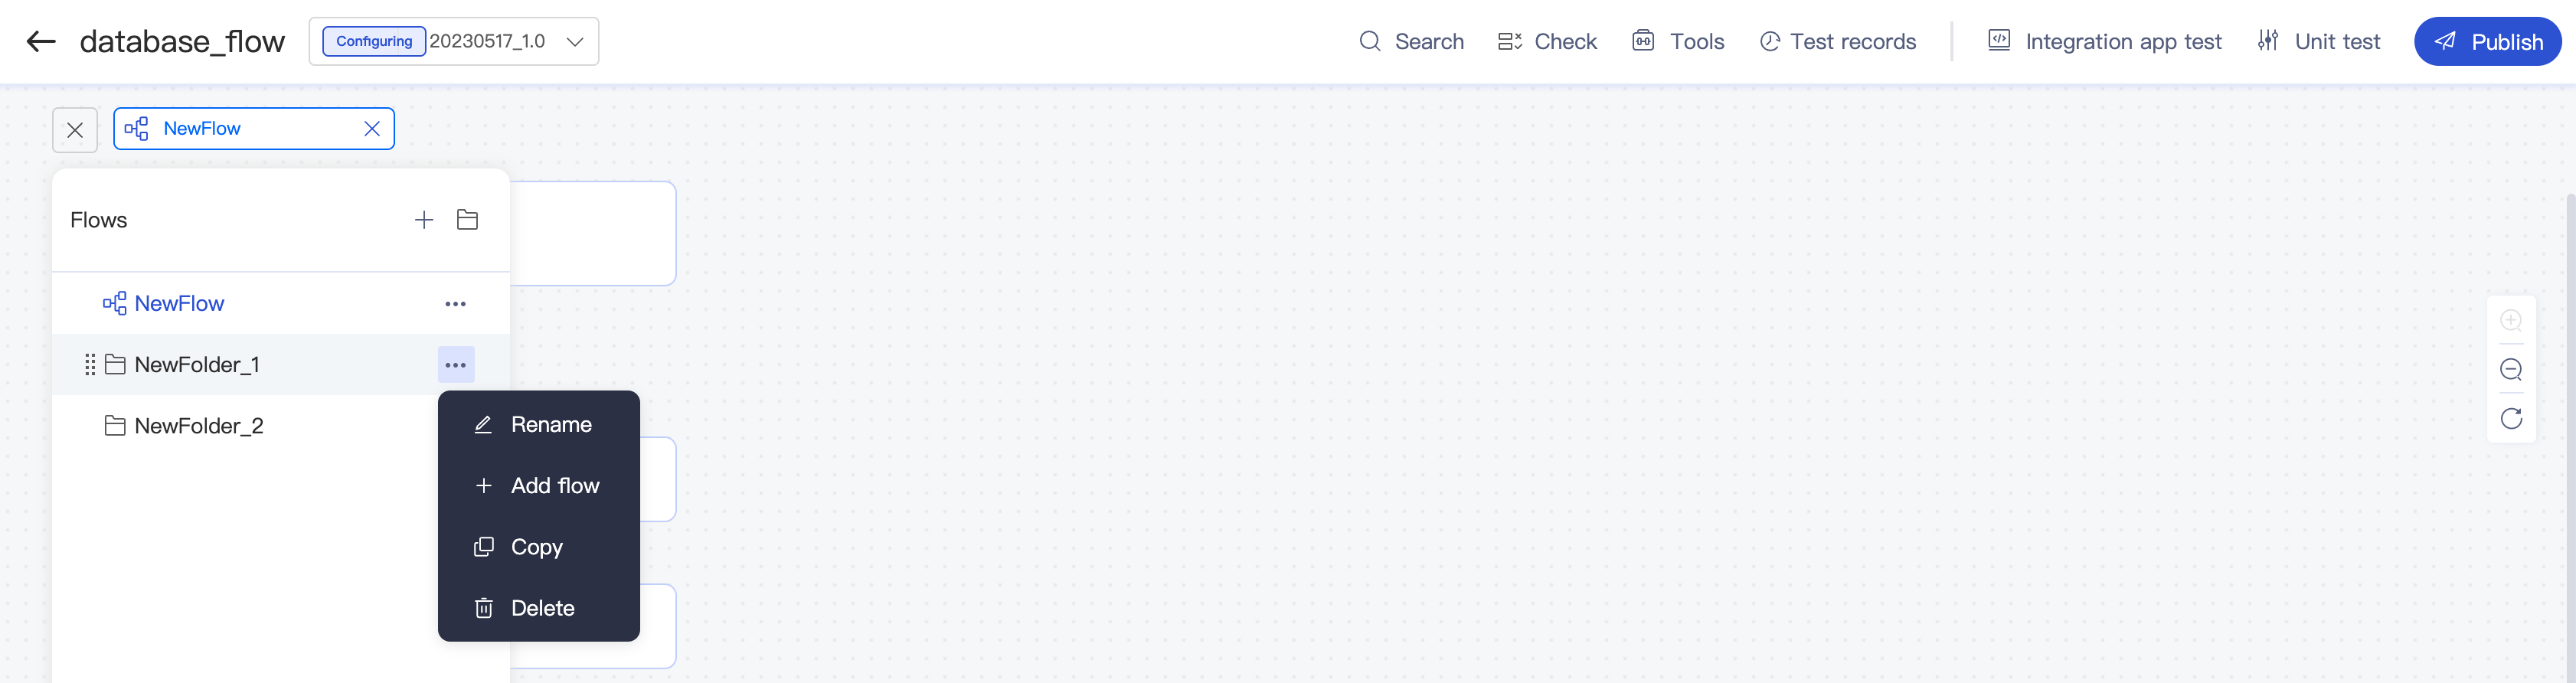
You can drag and drop existing flows to adjust their order or drag and drop them to a folder for unified management. When dragging a flow, you can drop it after a blue line appears.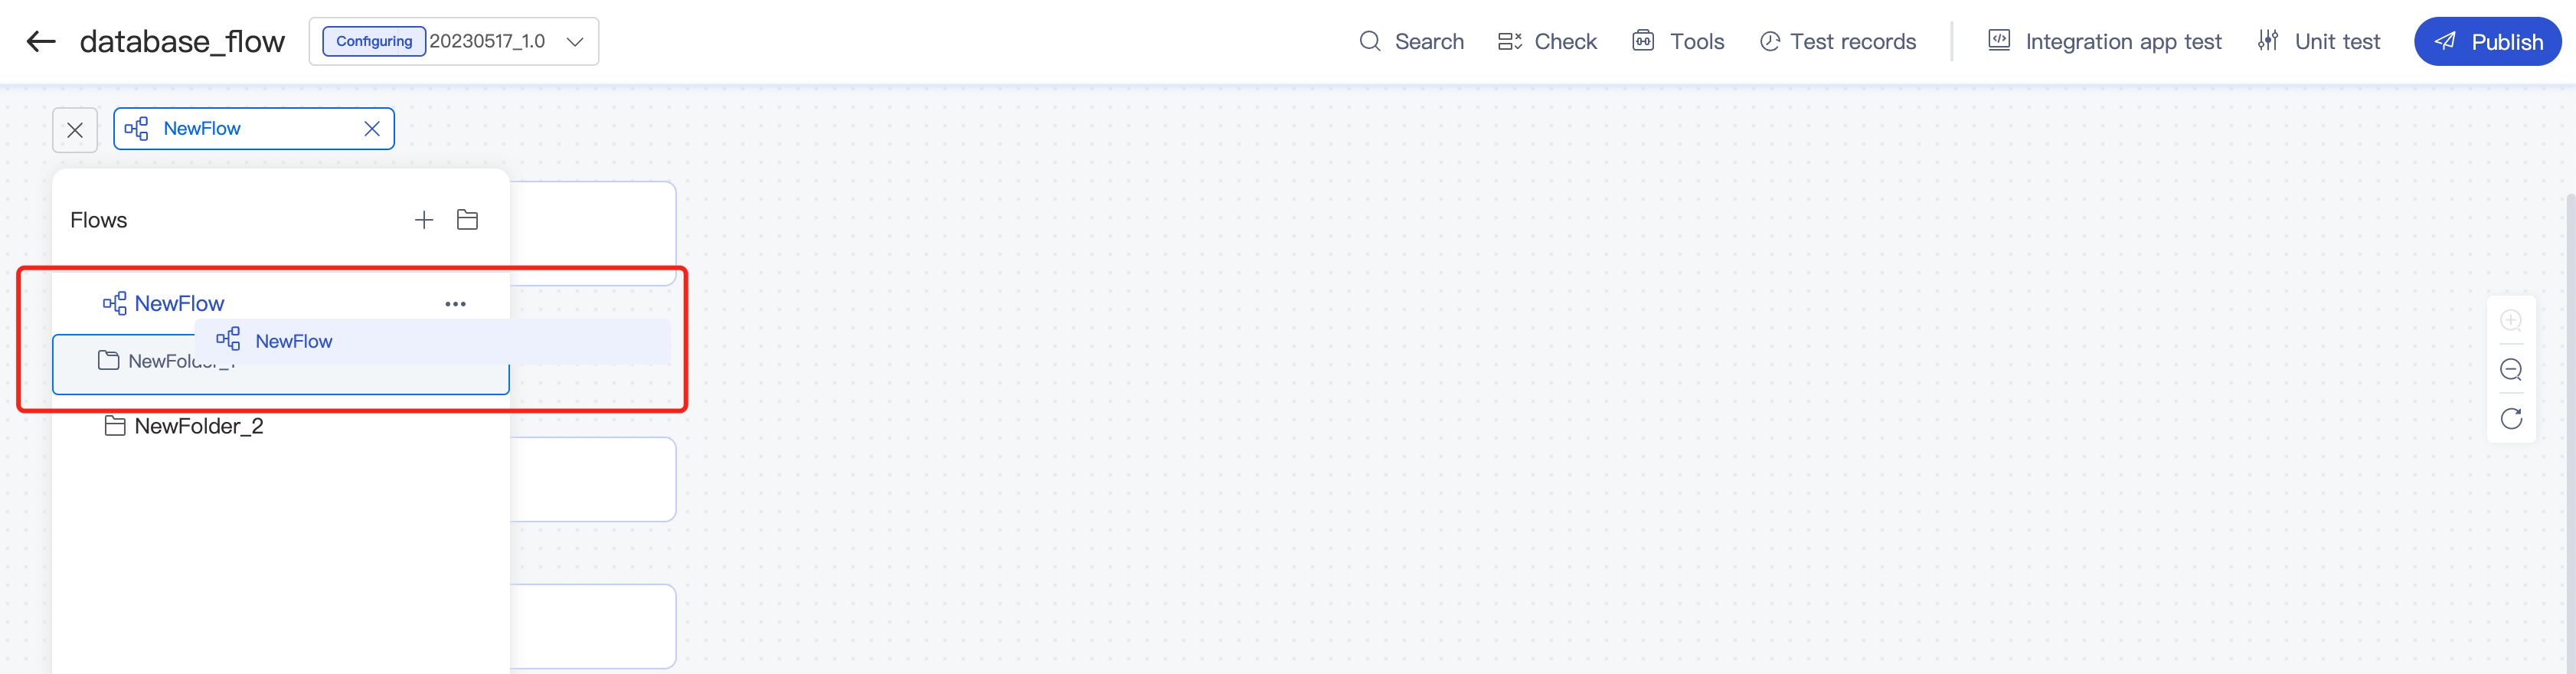
Component Library
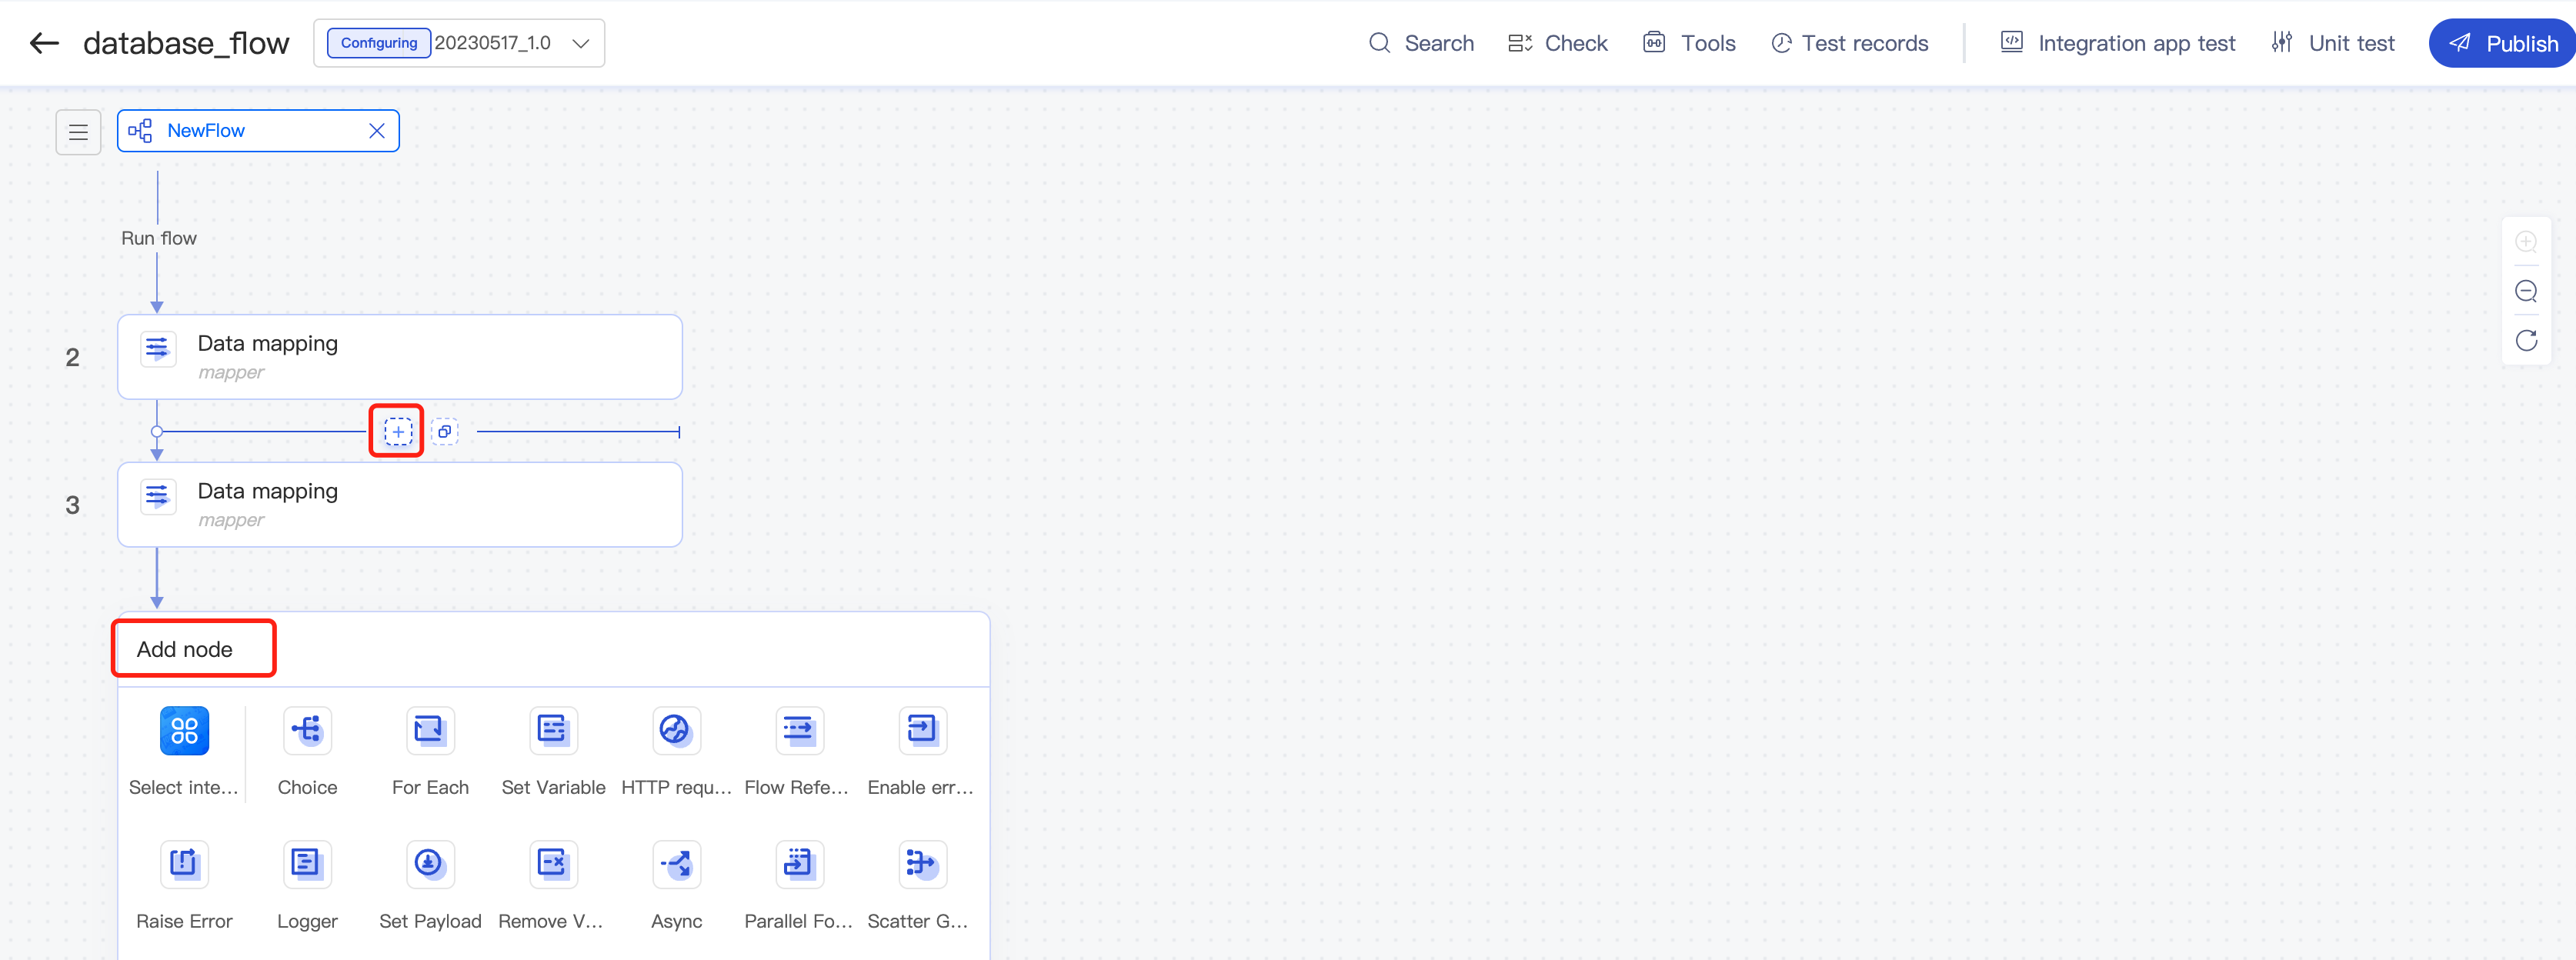
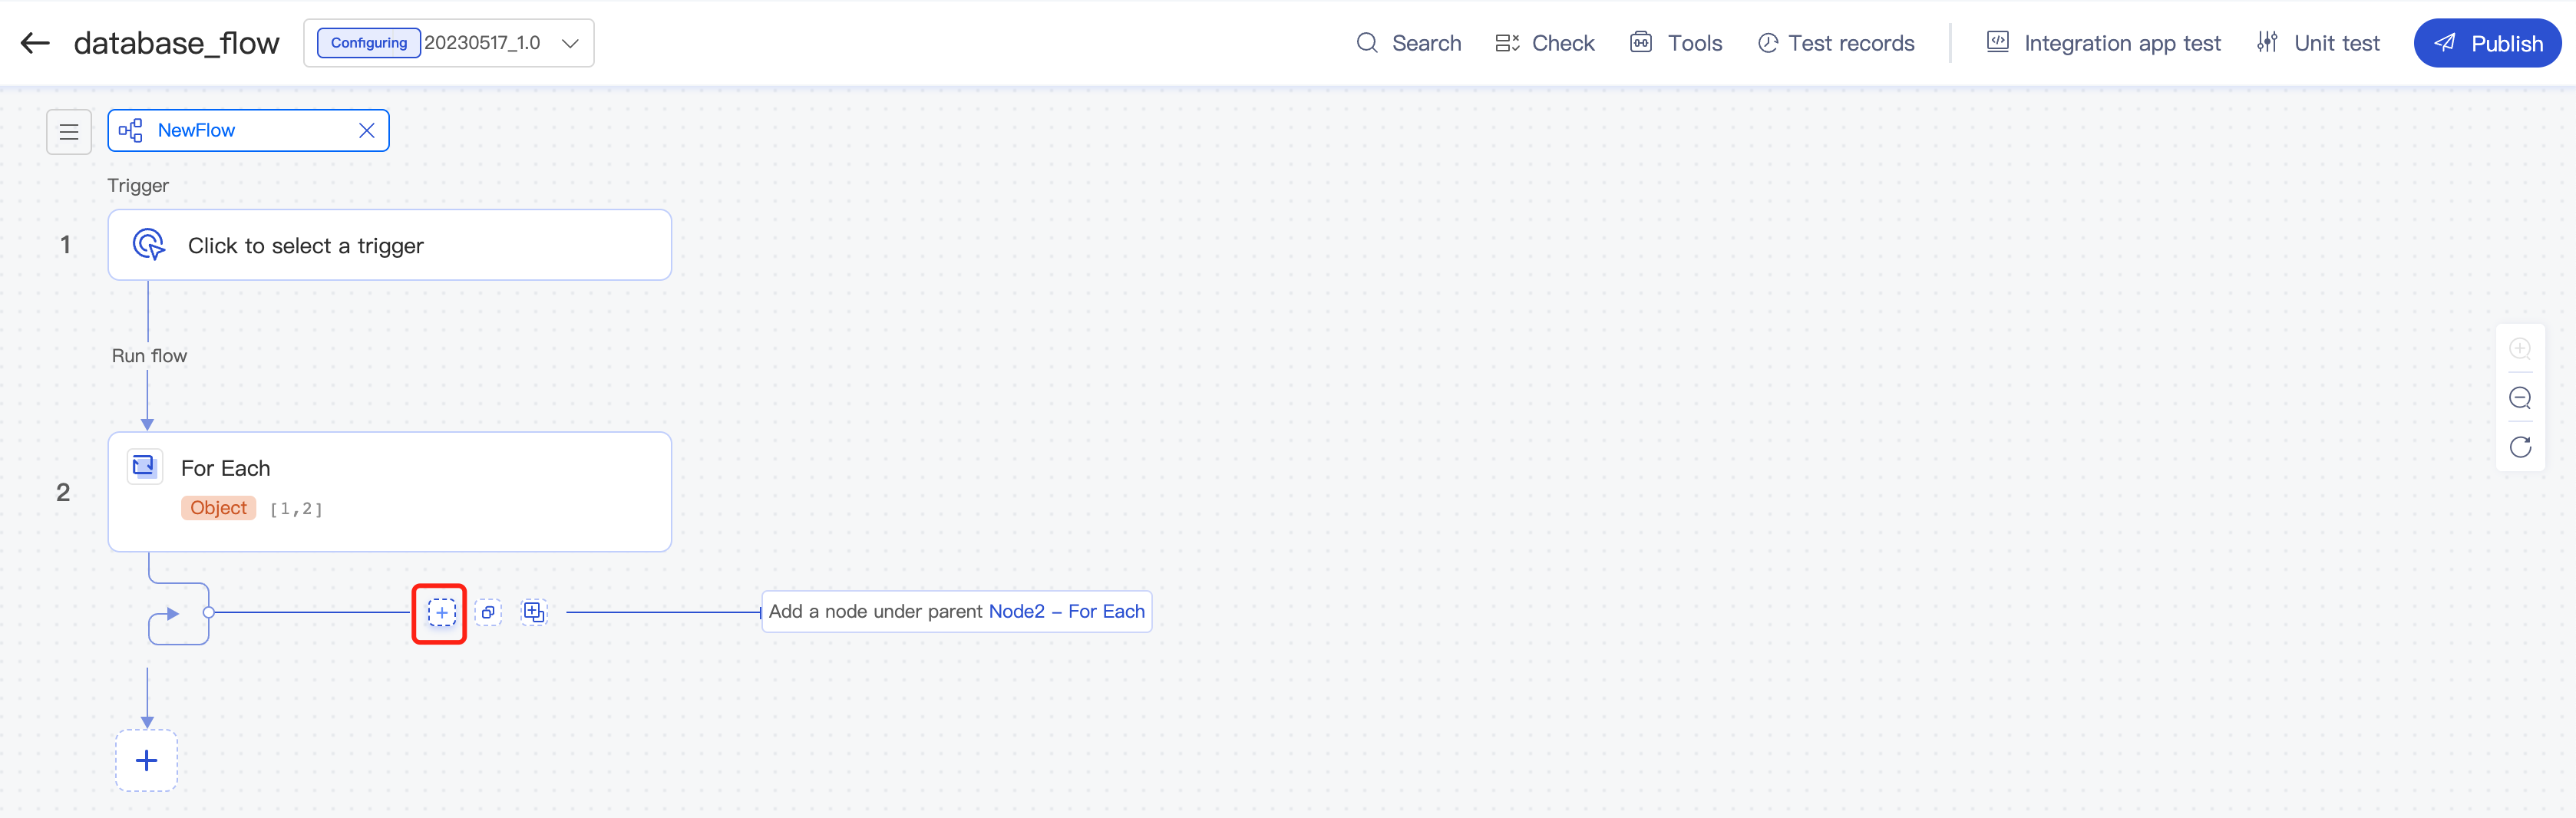
After a flow is created, it will be displayed on the canvas. Click + on the canvas to open the component library, select a component, and configure the flow. Components include connectors and logical components, the former of which include common connectors and app connectors.
- Common connector: Protocol for app system interaction.
- App connector: Encapsulation of an app. For example, if a system interacts with other systems over HTTP, you can select the HTTP connector and configure the parameters for connection; if you want to connect to Tencent Meeting, you can directly use the Tencent Meeting connector, which encapsulates the APIs, authentication information, and interaction protocols of Tencent Meeting.
- Logical component: Implementation of business logic for app interconnection, such as loop, choice, variable configuration, data conversion, parallel processing, and async processing.
Logical component operation guide
- For a newly created flow, click + to select a trigger component.
- When you add a sub-node, the information of the parent node will be displayed.
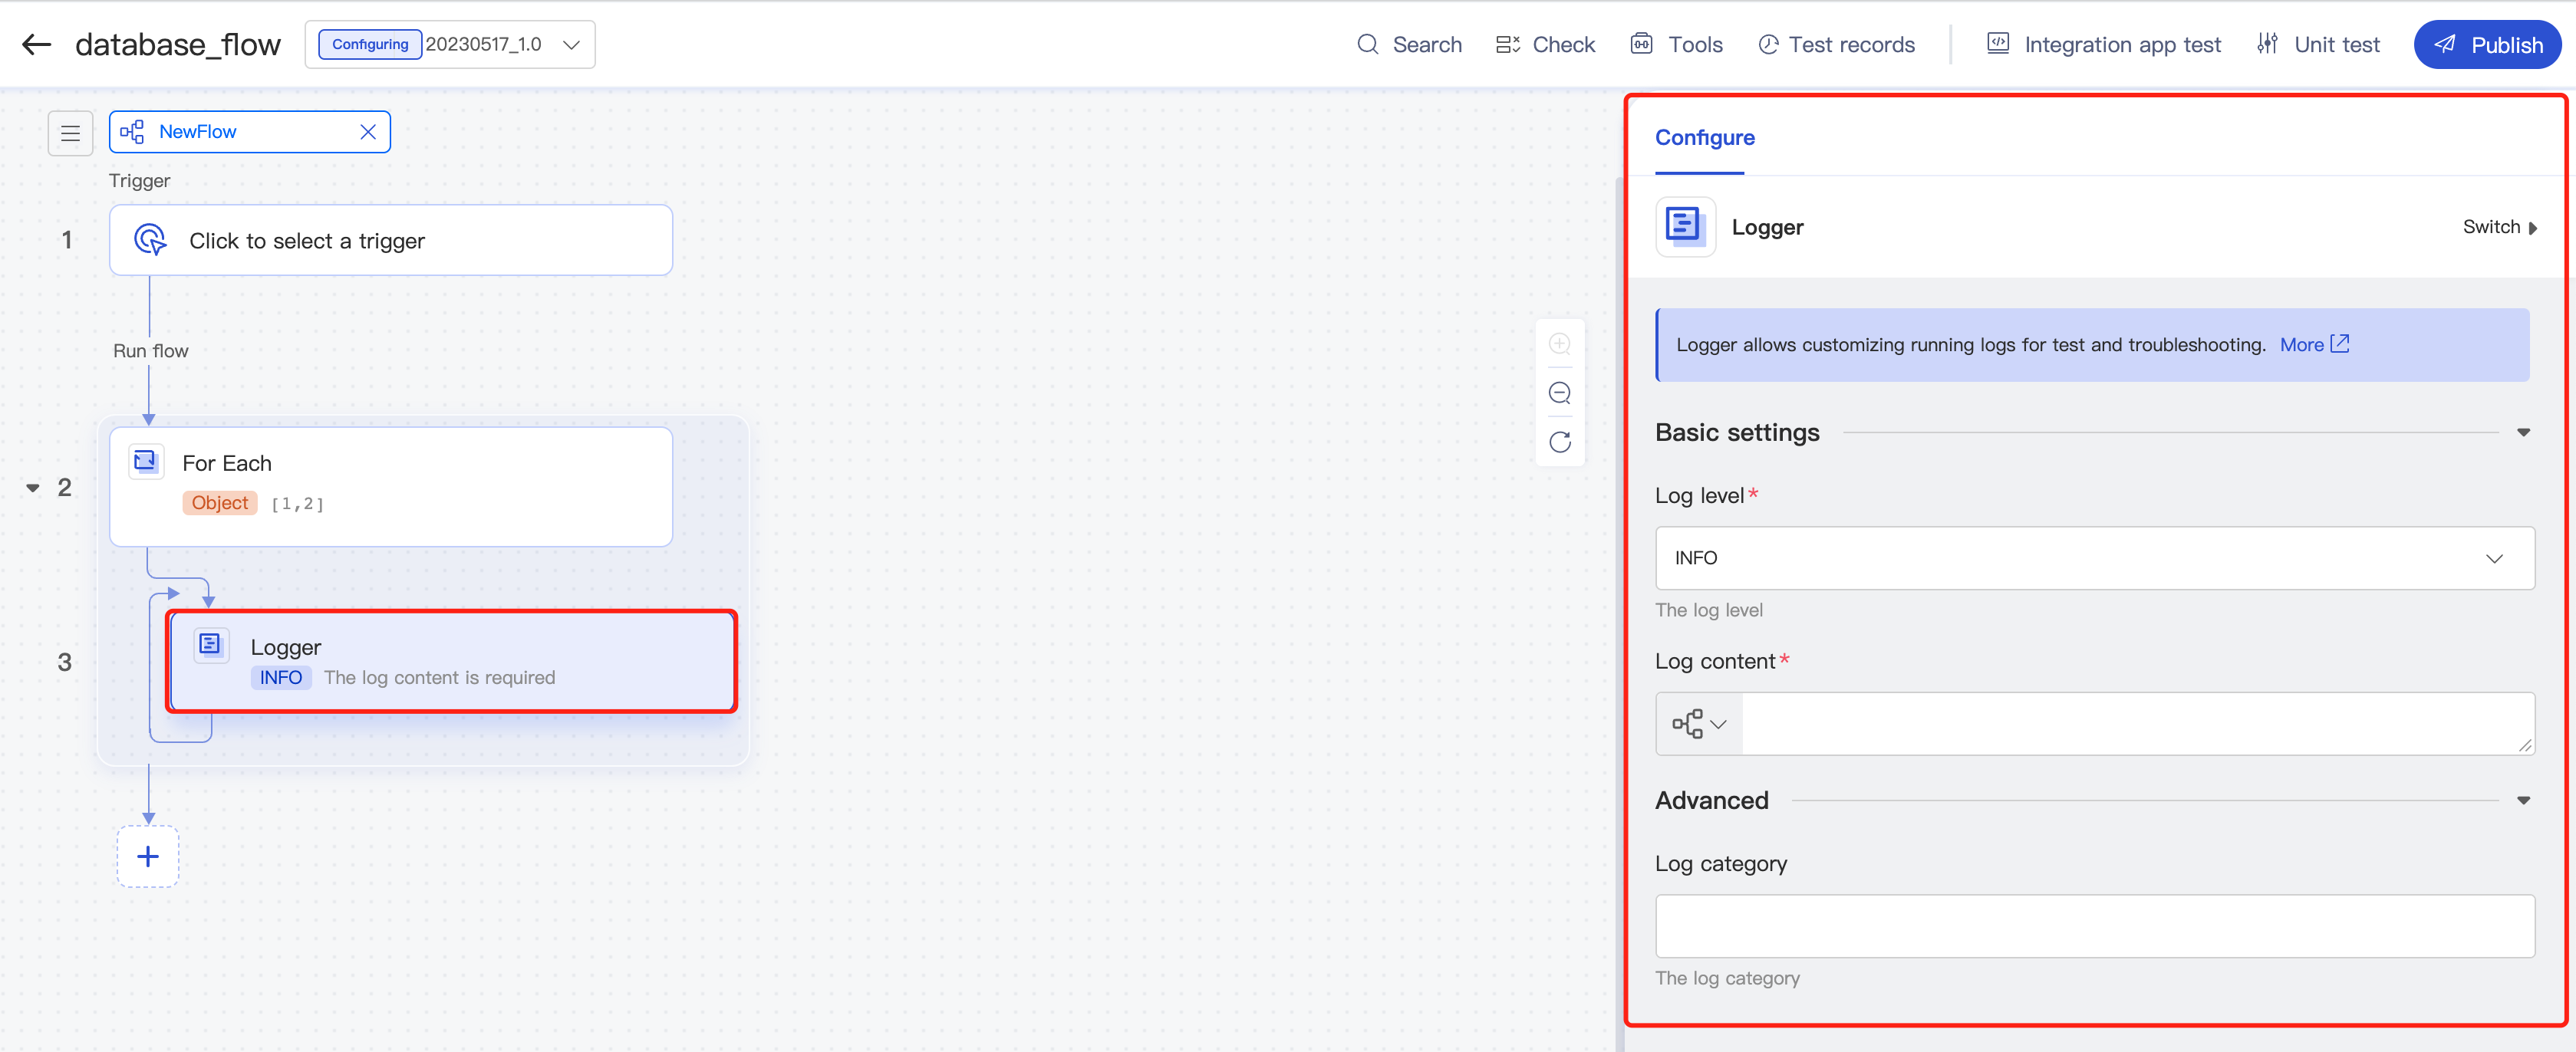
- If you add a logical component, the component configuration page will be directly displayed. Then, configure the component as prompted.
Common/App connector operation guide
For a newly created flow, click + to select a trigger component. If you select an app connector or common connector, select the required operation first and then configure the app connector or common connector as prompted. General configuration items are required, while advanced configuration items are optional. After completing the configuration, click Execute in the Preview step to check whether the configuration is correct and whether the output data is as expected and can be used on the next node. You can click the data to input it.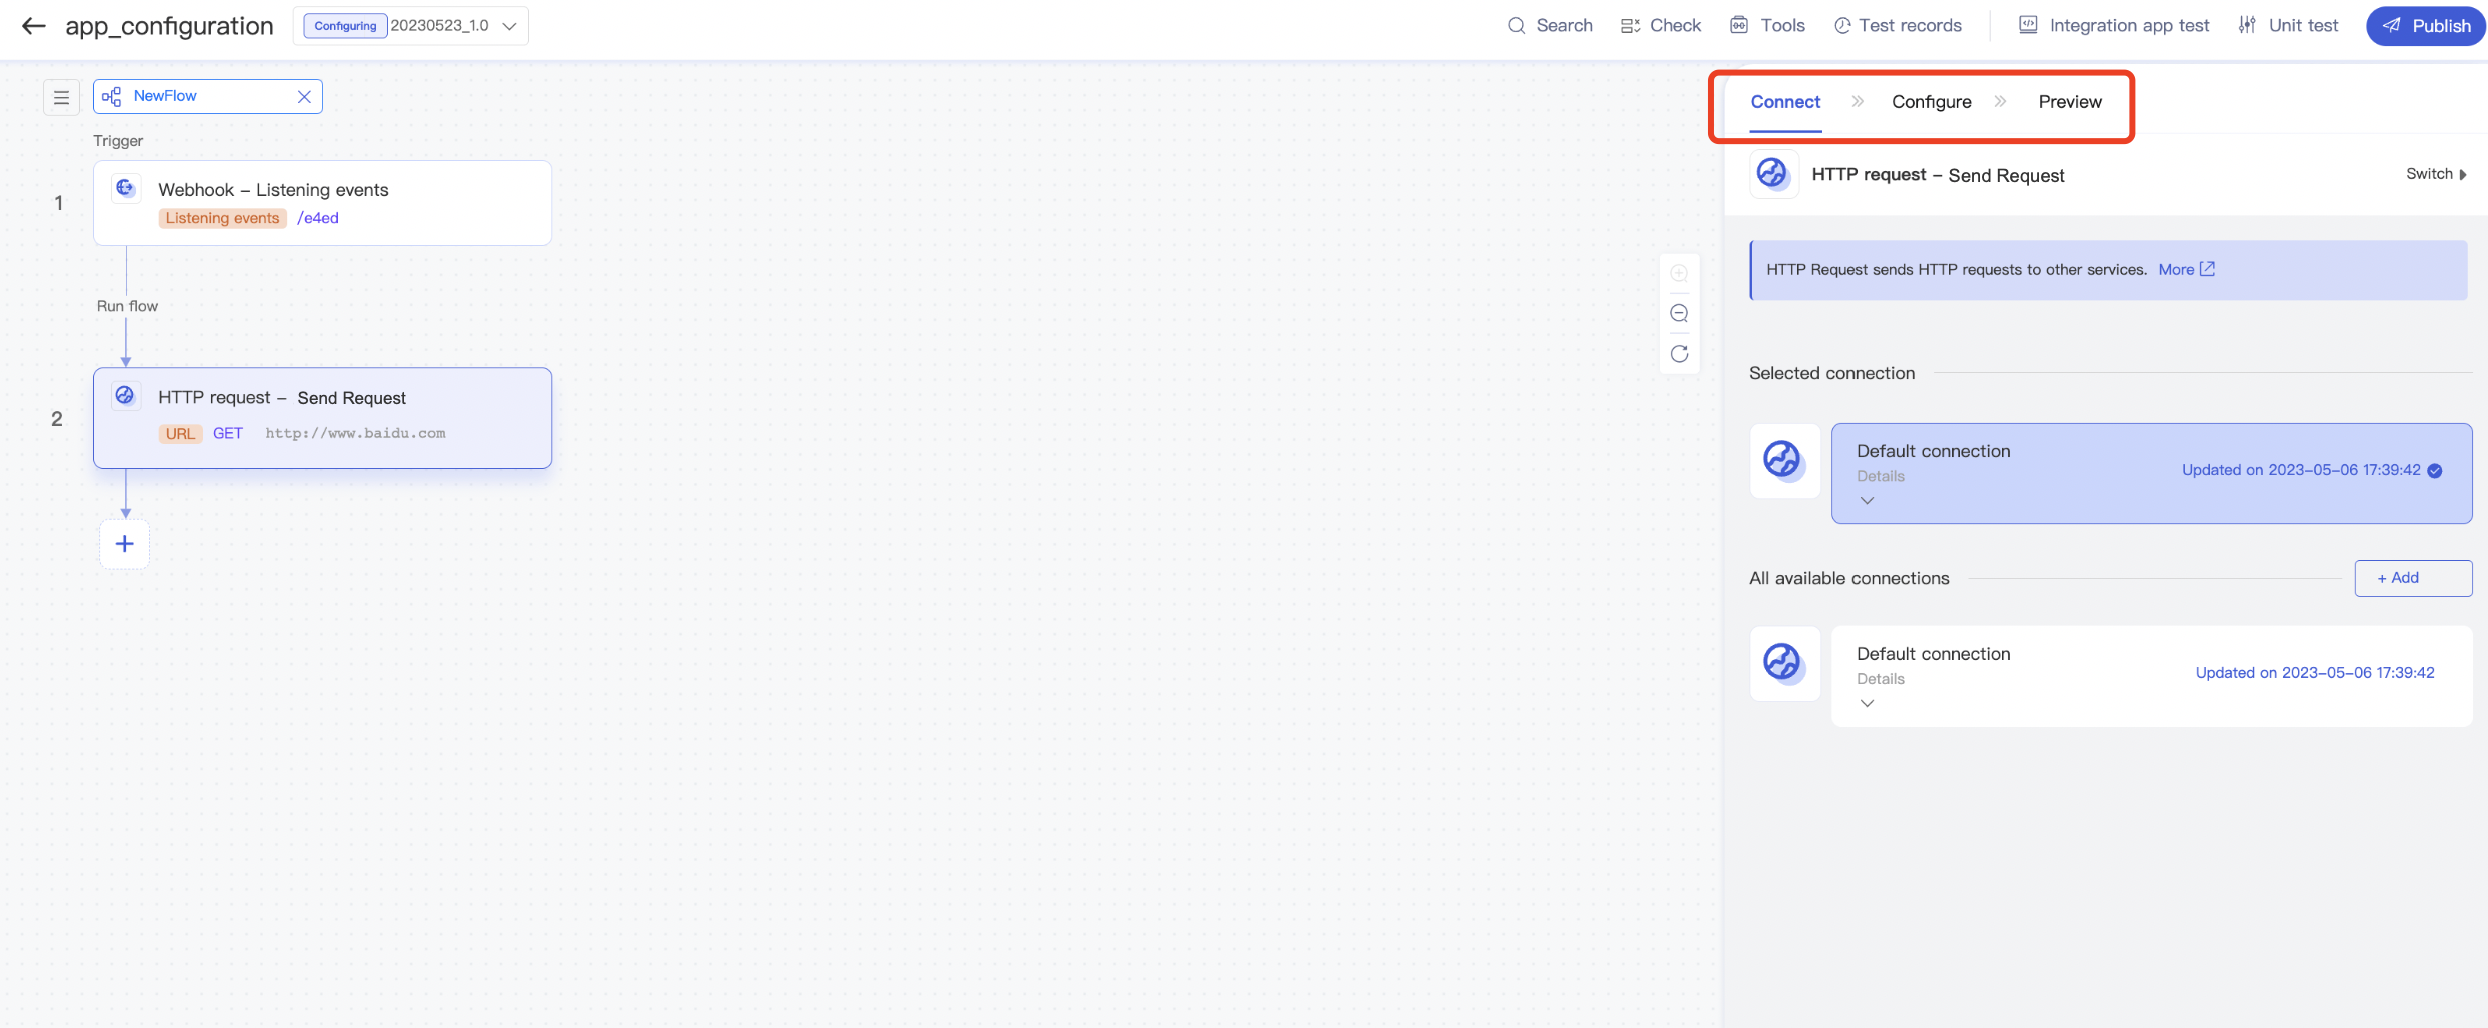
Connection
Create a connection: After you select Connector and create a connector on the canvas, the message "No connections are bound yet. Select an existing connection or create one" will be displayed in the top-left corner of the pop-up configuration page. Click Add connection and configure the information as prompted.
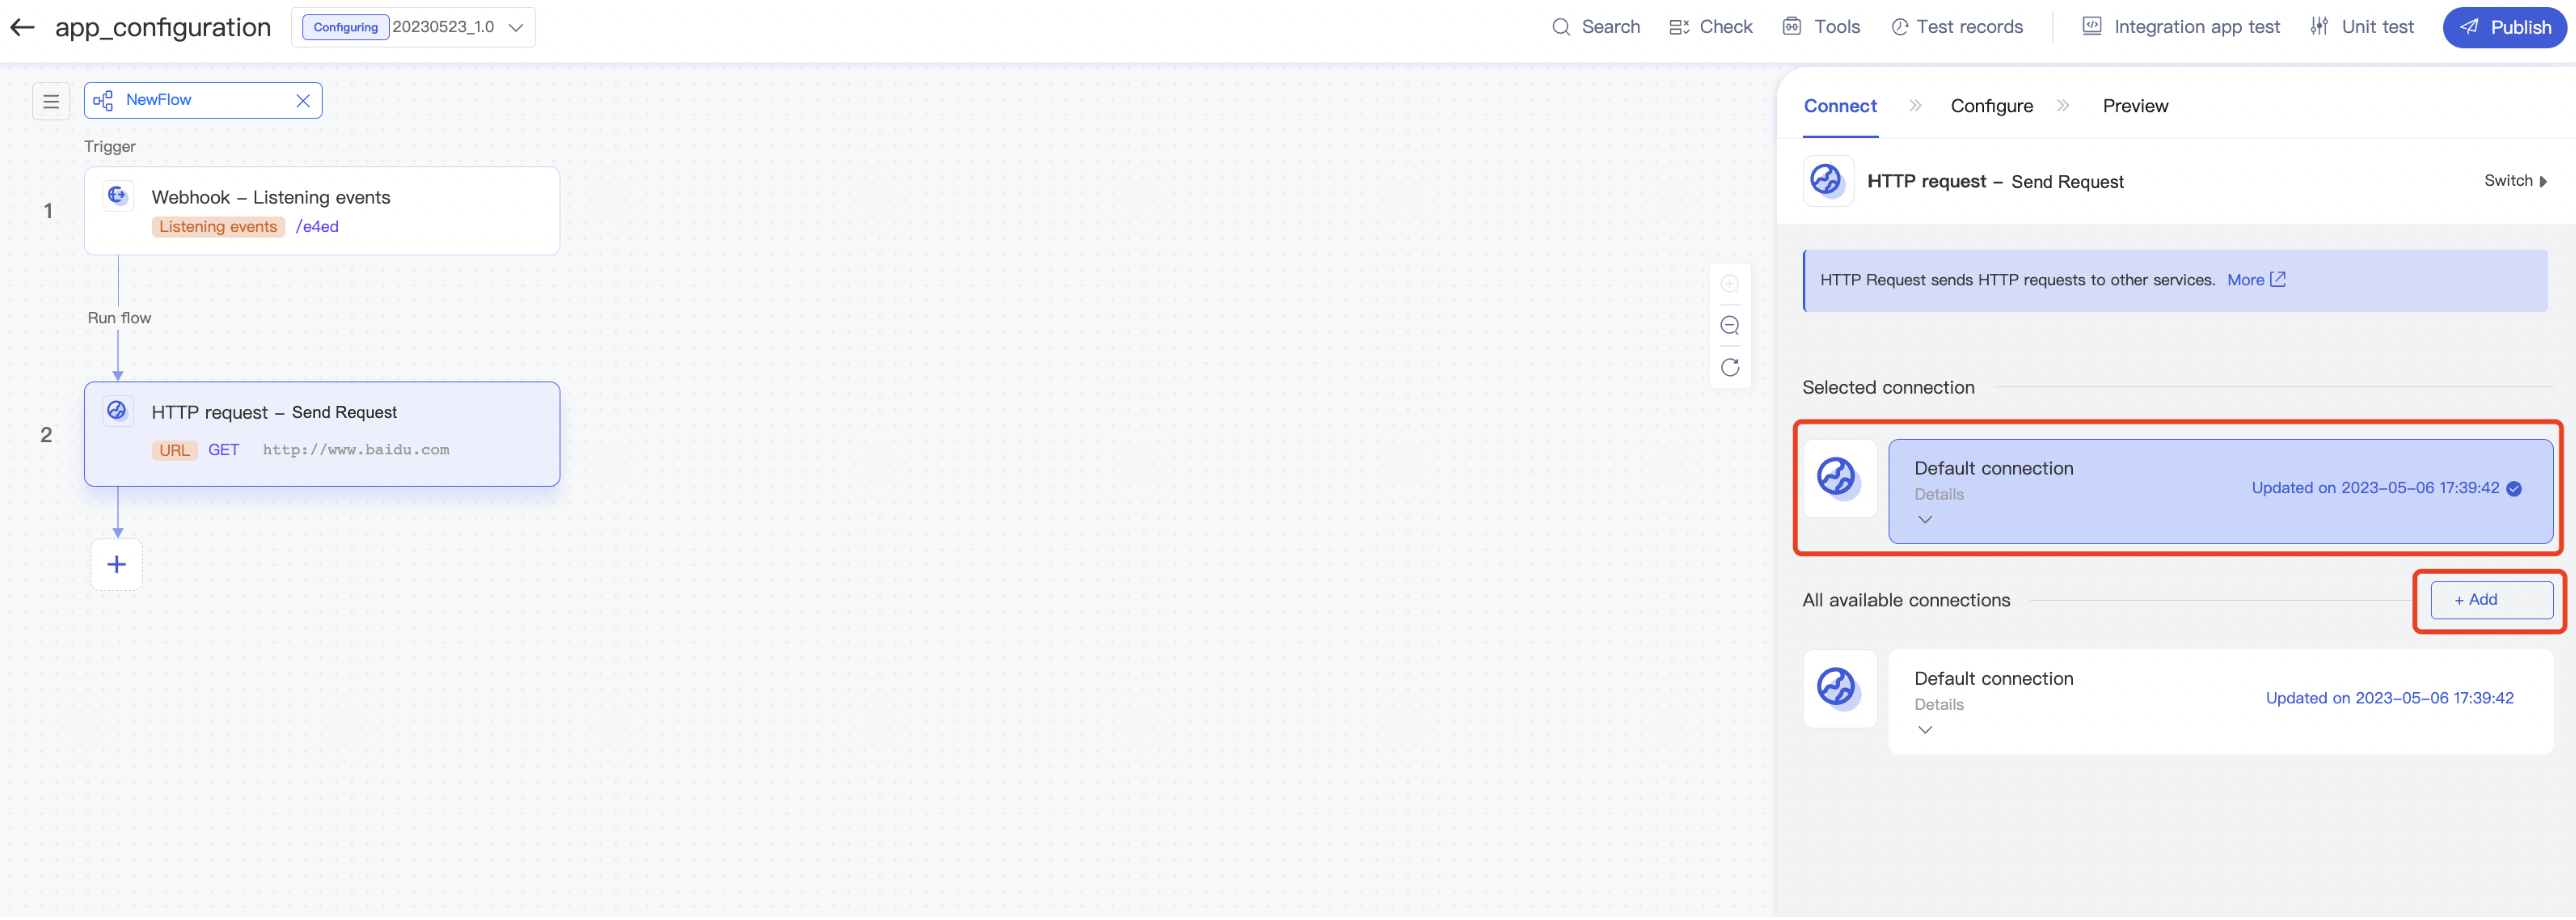
Select an existing connection: For a non-newly created integration app, if there are existing connections in the same app, you can select one as needed. To modify the third-party credential information, you can return to the Connection page to create a connection or switch to another existing one.
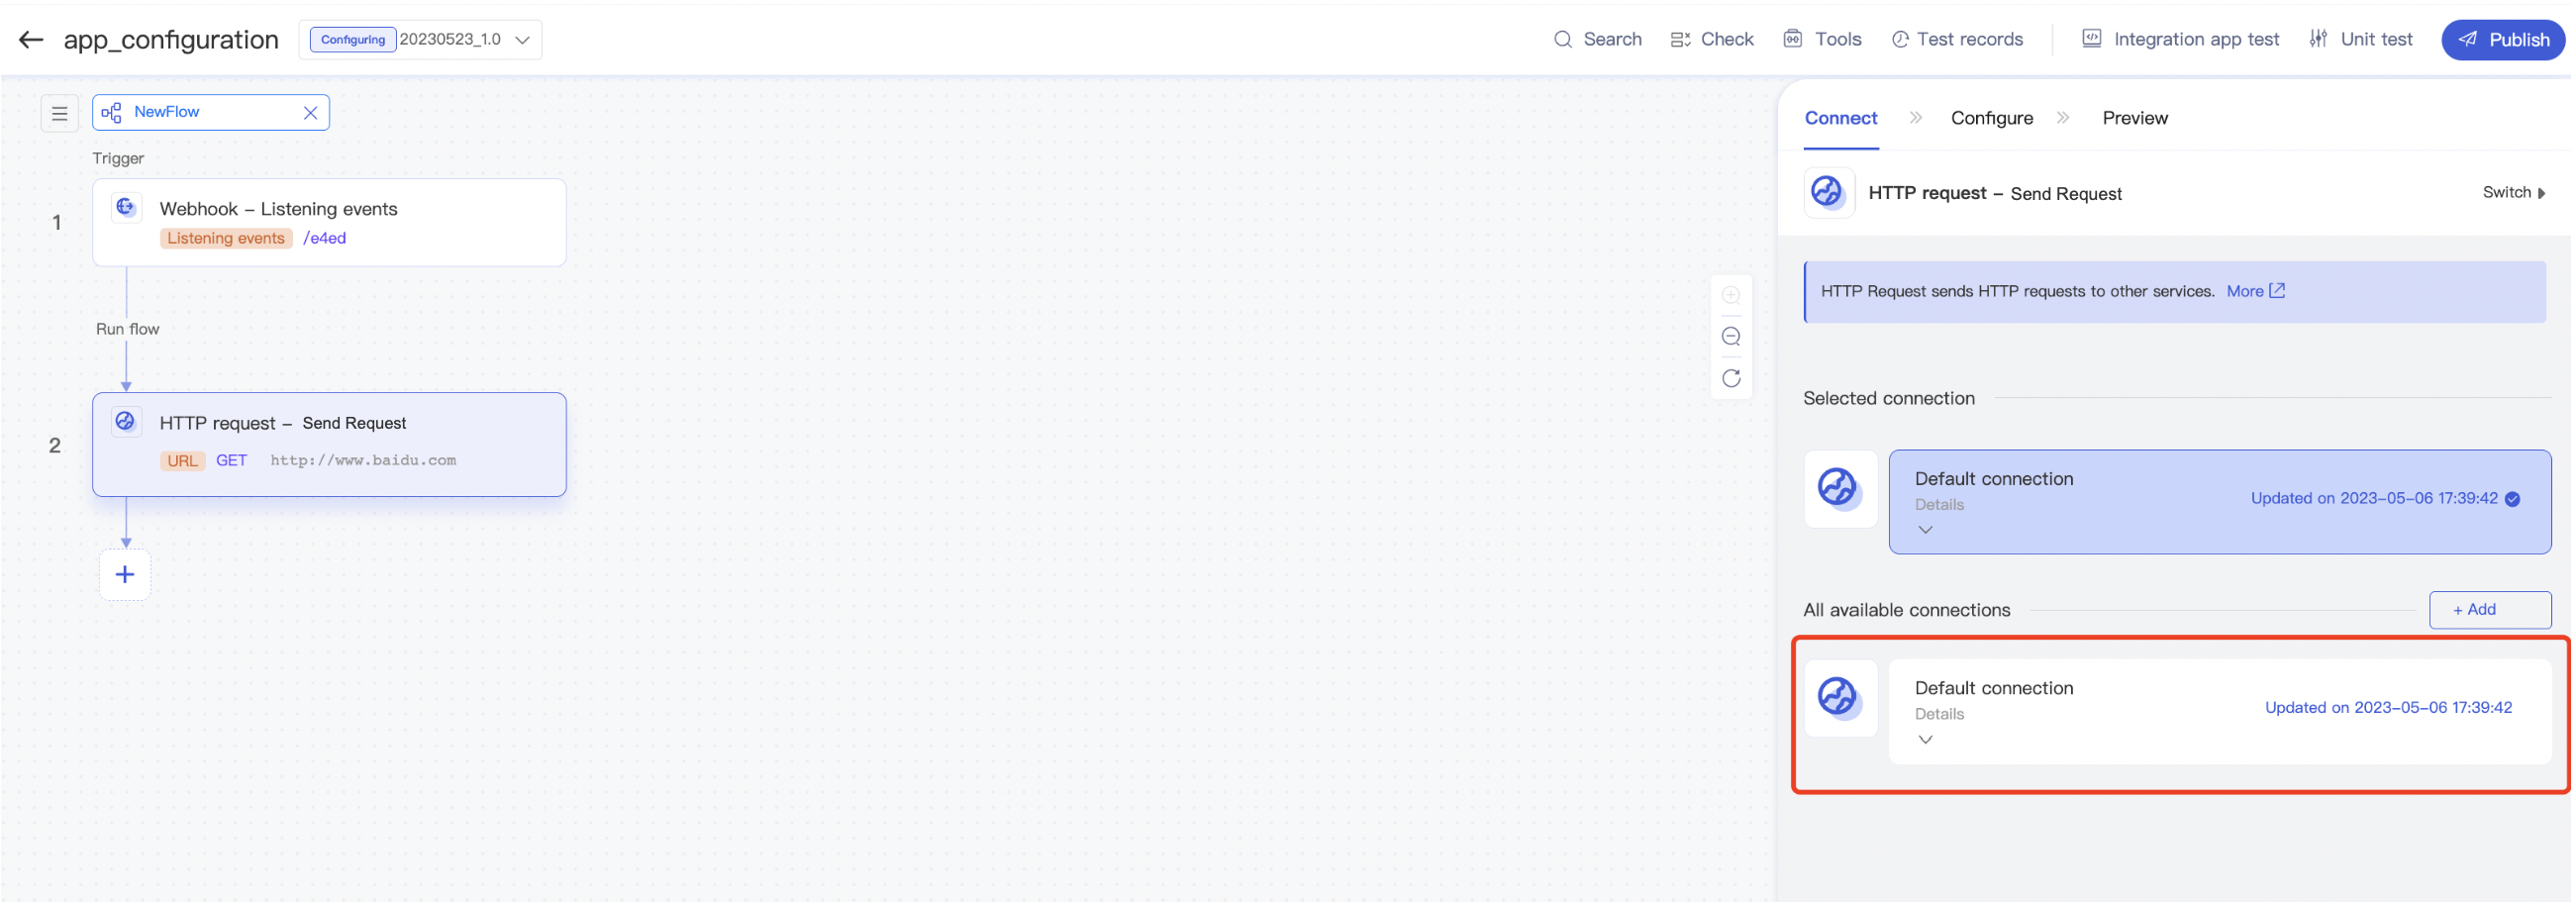
Connection: When a connector is created, its connections will be displayed on its Connection page. You can click Edit to enter the connection page and edit the connection information.
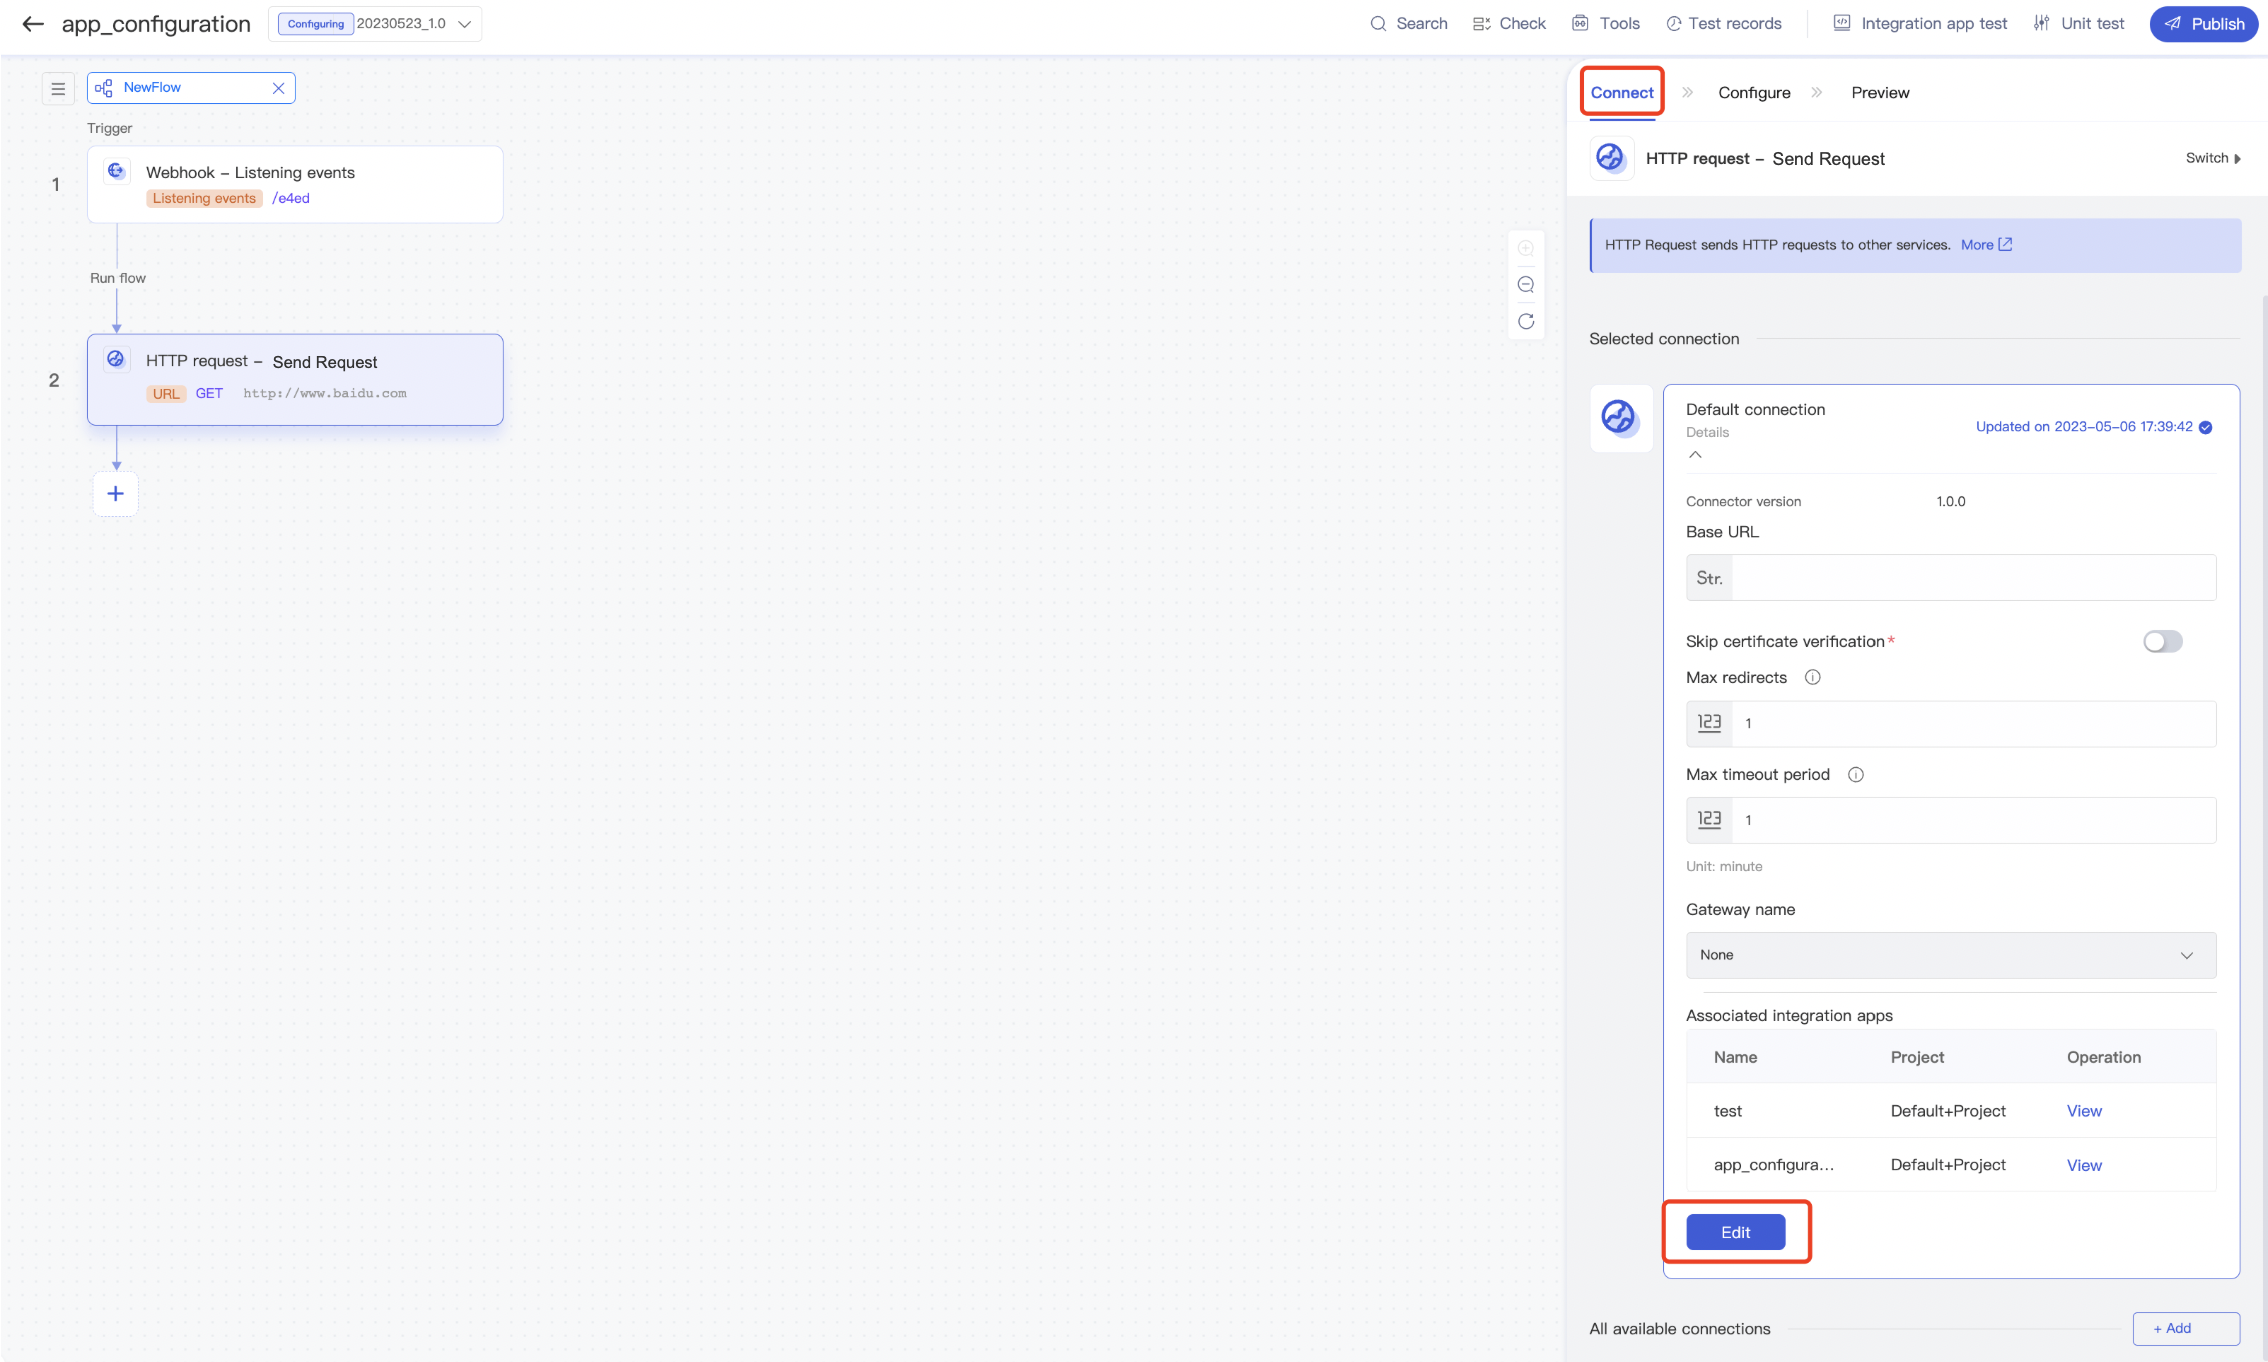
Switch the app connector version: If the selected app connector has multiple versions, you can click Tools in the top-right corner and click Connector version to switch to the target version.
Note:If there is a red exclamation mark after the selected version, the version is not the latest one.
Common connector configuration
Note:Common configurations are displayed only for apps created after the launch of the standalone console.
Reason: Connection configurations of common connectors (like HTTP Request) of apps created before the launch of the standalone console are called common configurations. Configurations of both common connectors and app connectors of apps created after the launch of the standalone console are collectively called connection configurations; therefore, common configurations are no longer displayed.Edit a common connector configuration: Select the target common connector, click Tools in the top-right corner, select Connection, and click the name of the target configuration to edit the configuration.
Delete a common connector configuration: Select the target common connector, click Tools in the top-right corner, select Connection, and click
 to delete the target configuration.
Online preview
After configuring a node, you can view the node's output data and schema immediately in the preview step.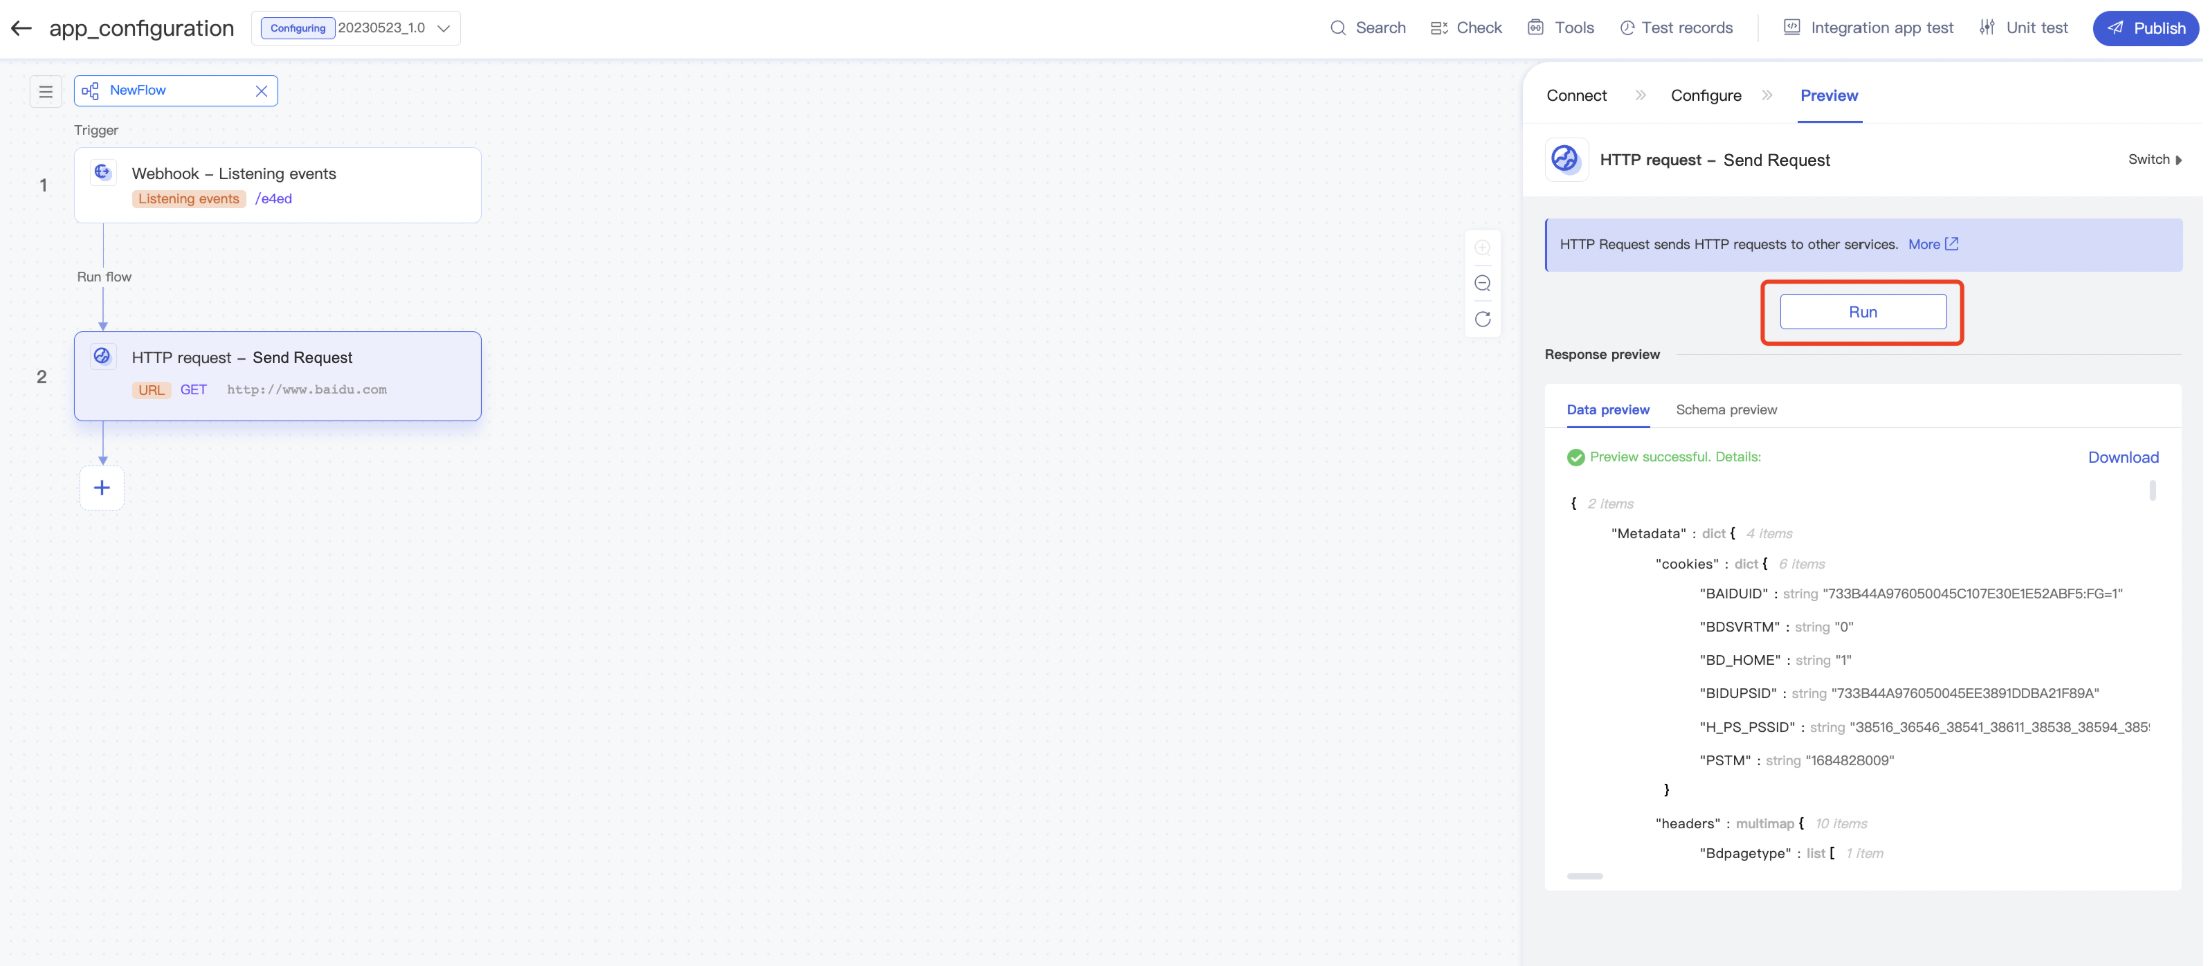
Flow data panel
After you click a flow node, the flow data panel will be displayed. You can select the data content on the previous nodes to reference data variables easily. If multiple variables are selected, they will be spliced automatically.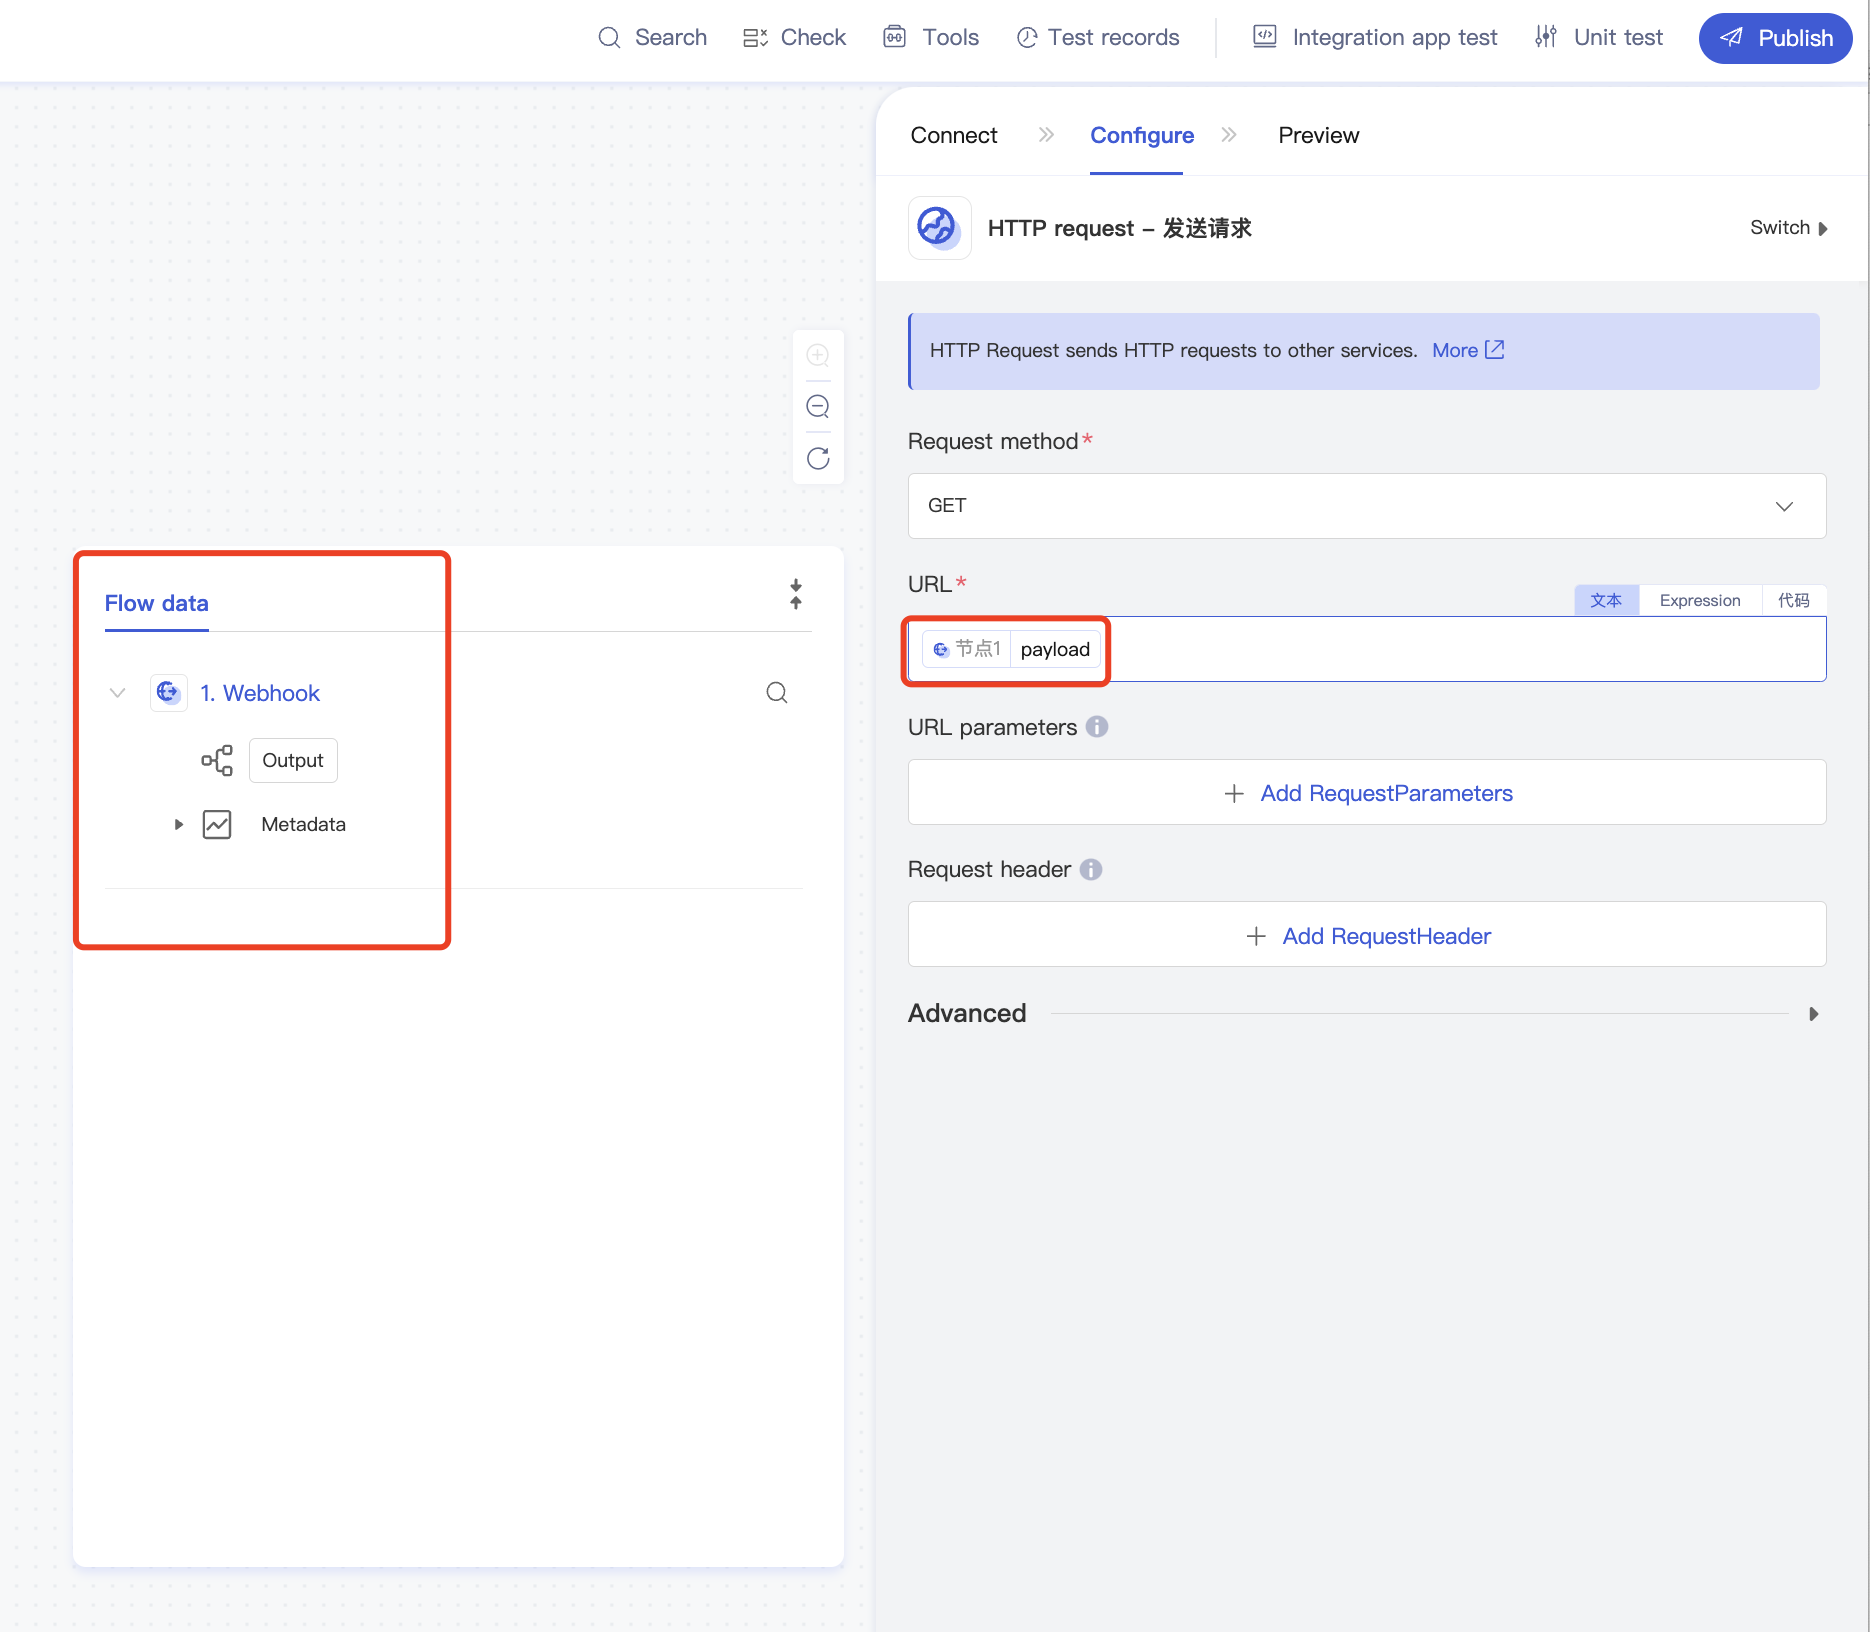
Single-line expression input
If you want to simply edit some variables when entering parameters, you don't need to open the code input box. Instead, you can switch to the Expression input mode to perform over 100 quick operations for orchestration, such as type conversion, operator, method reference, and attribute reference. The input process is further simplified through capabilities such as smart prompt and autocomplete.
Multi-User Collaboration Mode
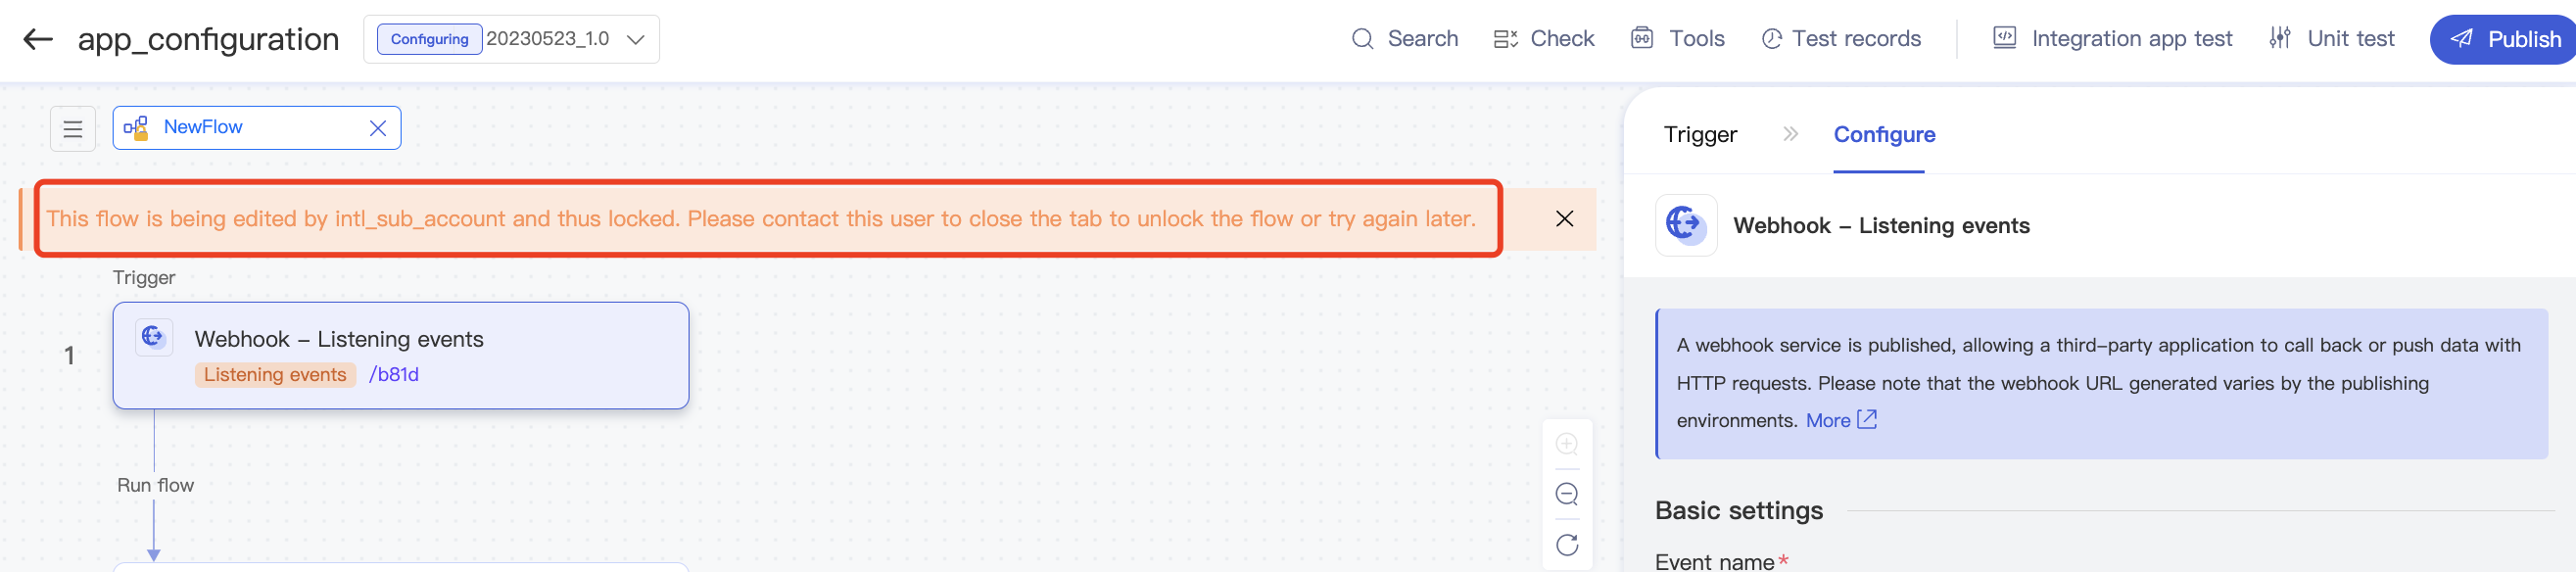
iPaaS supports multi-user collaboration. This feature allows multiple members in your team to develop the same integration app at the same time. In addition, you can enable the editing lock to avoid version inconsistency caused by simultaneous editing of the app by multiple users.
Note:In multi-user development, multiple users can develop multiple flows together in the same integration app, but a single flow can be edited by only one user at a time and is locked (uneditable) for other users during editing. This helps avoid version inconsistency caused by simultaneous editing of the app by multiple users.
Testing Feature
Integration app test
Viewing test information and errors
During integration app test, you can publish an integration app to the sandbox environment, directly copy the URL after the trigger, and simulate a trigger operation to debug the entire app. After the operation, the operation result will be displayed on the canvas. You can click the name of each component to view the detailed input and output information. All errors are displayed at the top of the page, and you can click View to view the error details of each component.
Viewing historical test records
Click the Test history drop-down list to view the test snapshot at each time point. In each snapshot, you can view the specific test parameters and errors at the corresponding time point. The last 10 test records are displayed to help you check the errors reported during each test.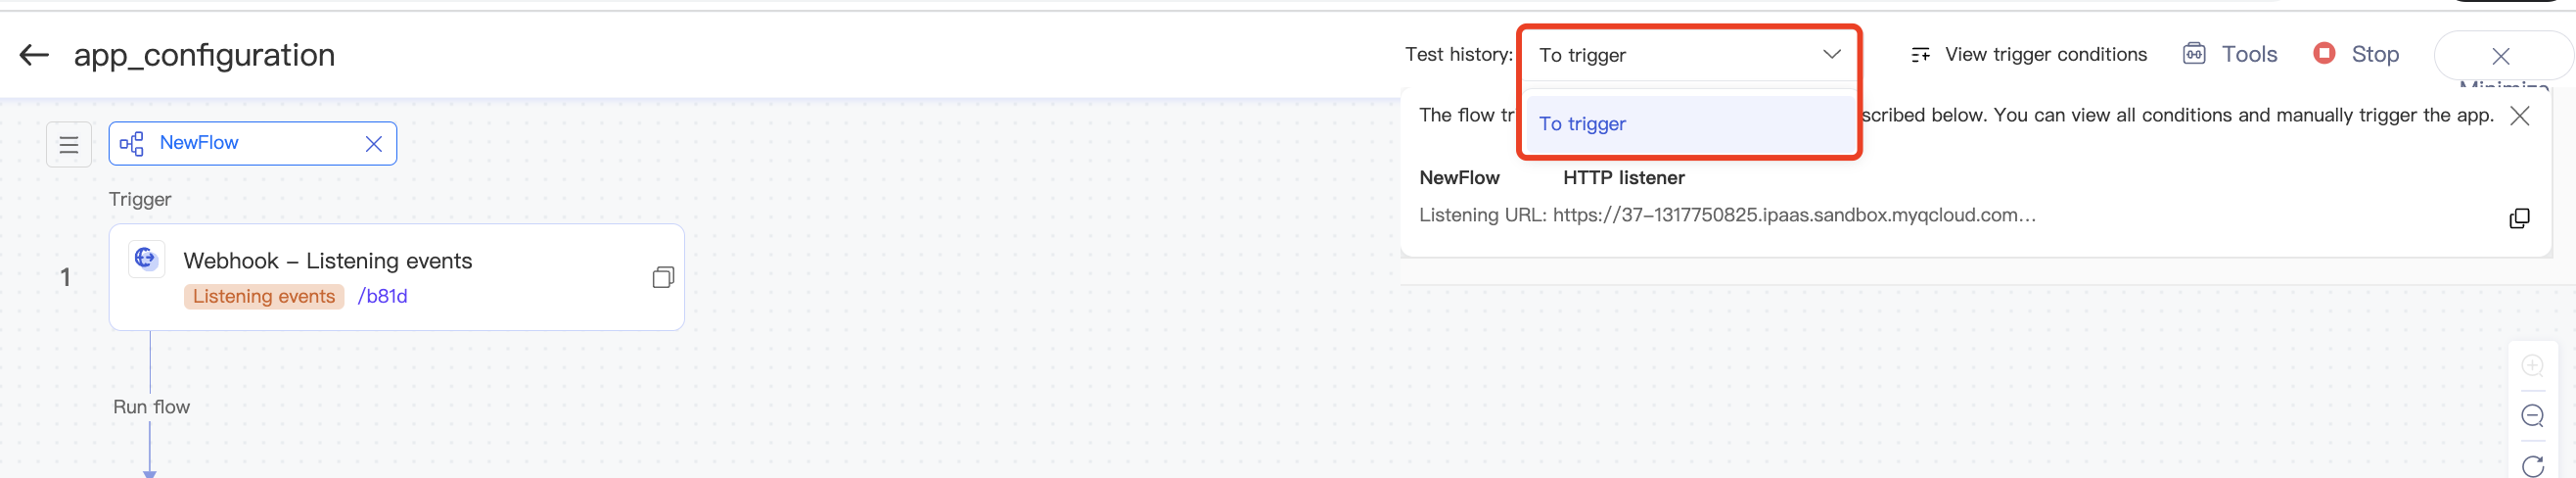
Viewing trigger conditions
You can view all trigger conditions of the current integration app and manually trigger the app. The following example shows how to manually trigger the Webhook component: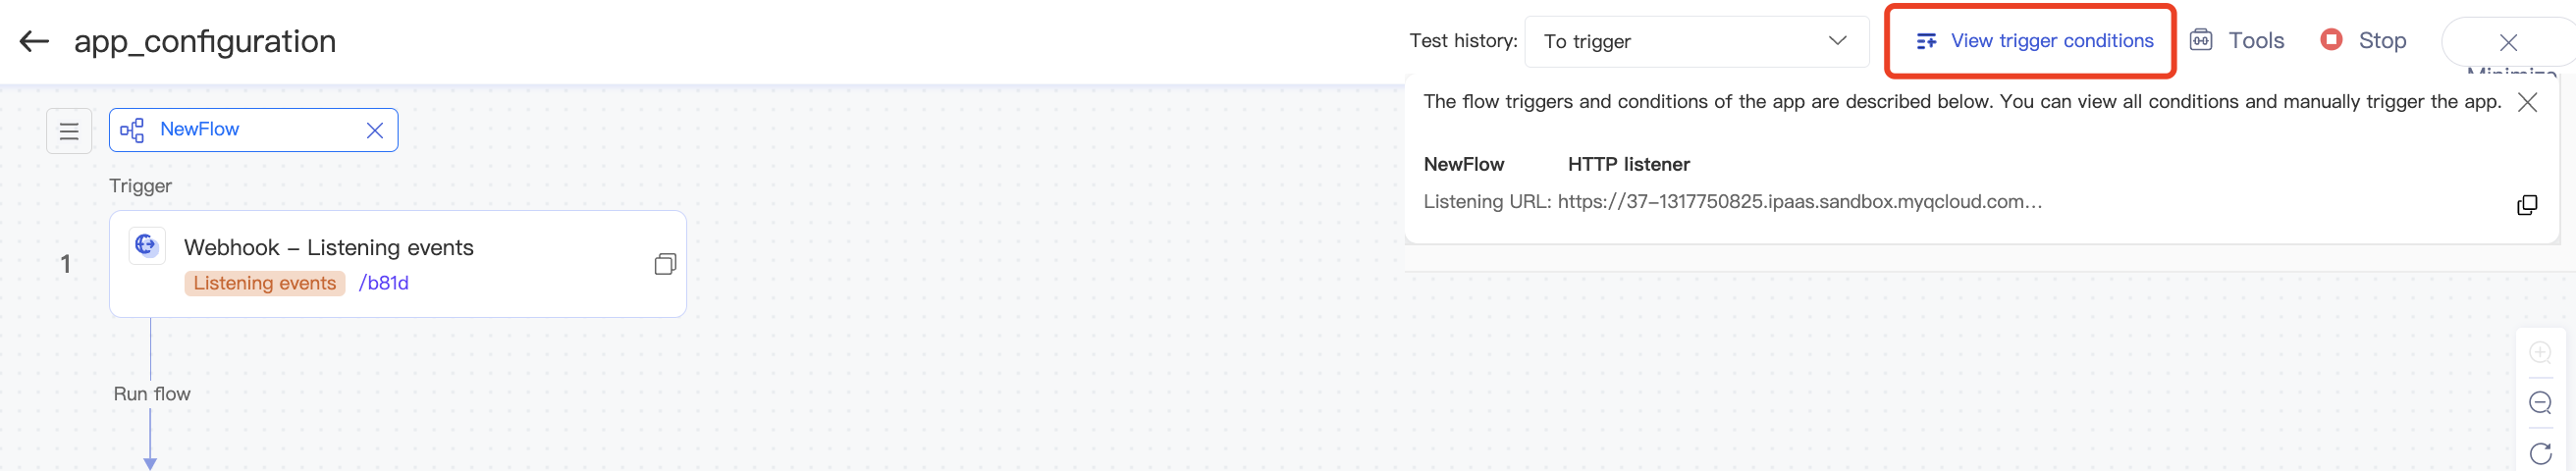
Unit test
In unit test, you can partially test one or multiple consecutive components. If the flow is complex, it may take a long time to test the entire app. In this case, you can perform partial testing to quickly locate possibly abnormal components (the first trigger component of the flow cannot be selected). To perform unit testing, click Unit test in the top-right corner and select the components to be tested. You can select only the first and last target components, and the nodes between them will be selected automatically, eliminating the need to click nodes one by one.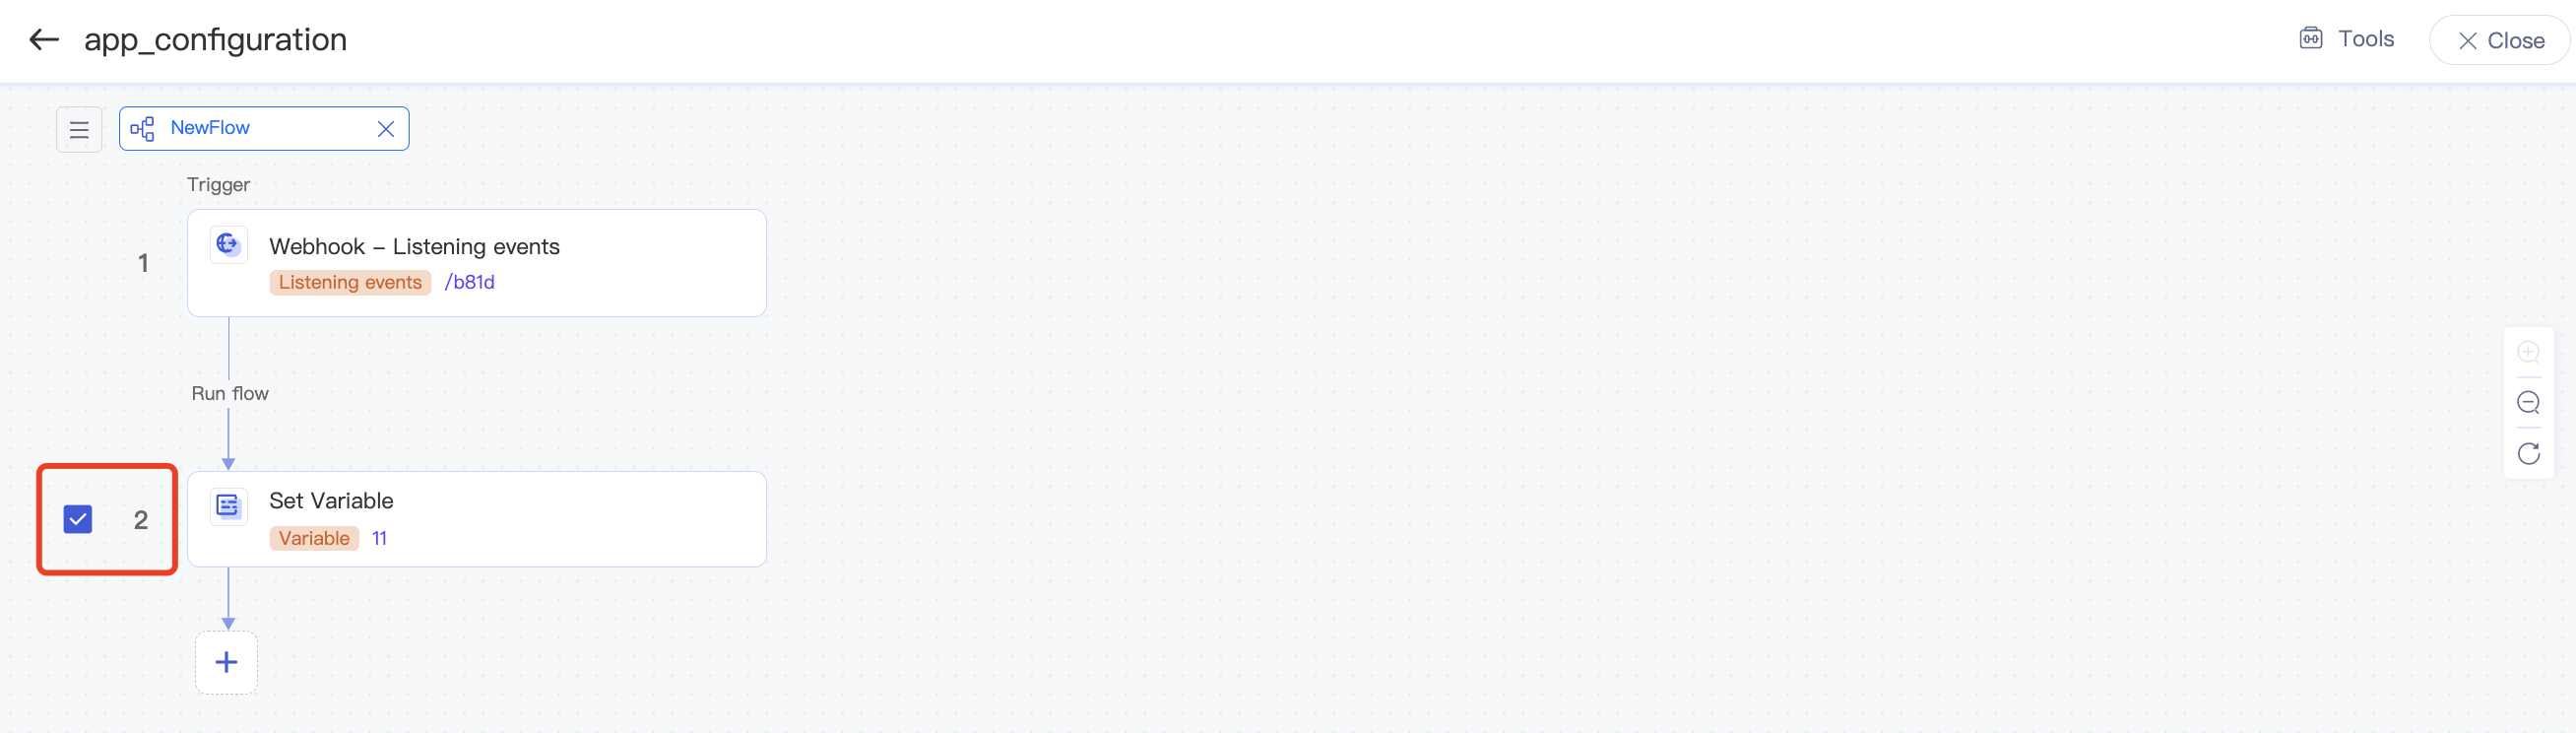
After you select the nodes for unit test, you need to simulate the input data for test. If you have performed unit or app test or previewed the component data before, the platform will automatically pull the historical test data, and you can select different historical data or automatically construct input data for test. If there is no historical data, you need to manually enter the simulated data for test.
Minimizing the test window
The test feature in the standalone console manipulates a certain version of the current app. You can still configure the app after minimizing the test window.
- In app test, you can click Minimize to minimize the app test window.
- In unit test, after you click Close, the unit test window will be minimized automatically.
Note:As the configured version and the tested version are separate, we recommend you test the app again after configuring it to verify the availability of the latest configured version.
You can also click the minimized test window to restore it and view the test details.
Viewing test records
After minimizing the test window, click Test record to view the historical app or unit test records.
Search
You can search for flows, components/connectors, and configuration content, so as to quickly confirm the valid content and built-in fields in the app.
Click Search and enter a keyword. Here, keyword webhook is used as an example.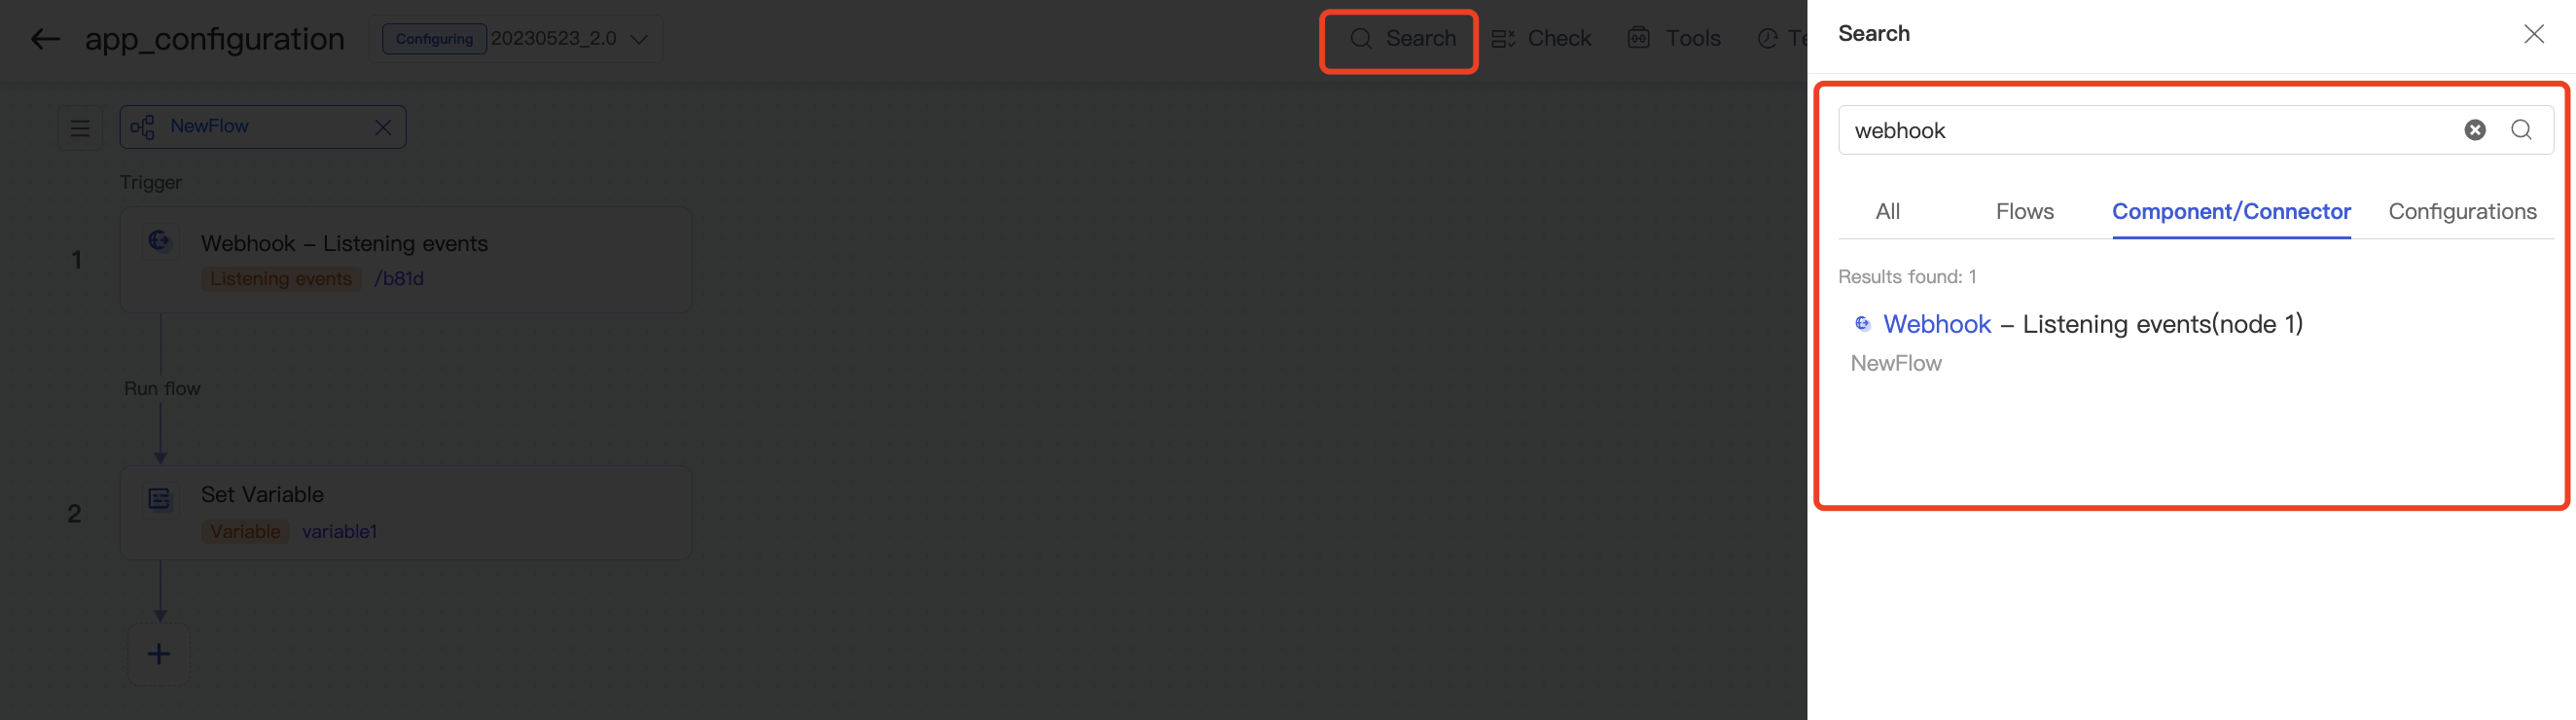
Tools
The toolbar provides many features such as connection group switch, connector version switch, and custom script configuration.
Note:Common configurations are displayed only for apps created after the launch of the standalone console.
Reason: Connection configurations of common connectors (like HTTP Request) of apps created before the launch of the standalone console are called common configurations. Configurations of both common connectors and app connectors of apps created after the launch of the standalone console are collectively called connection configurations; therefore, common configurations are no longer displayed.
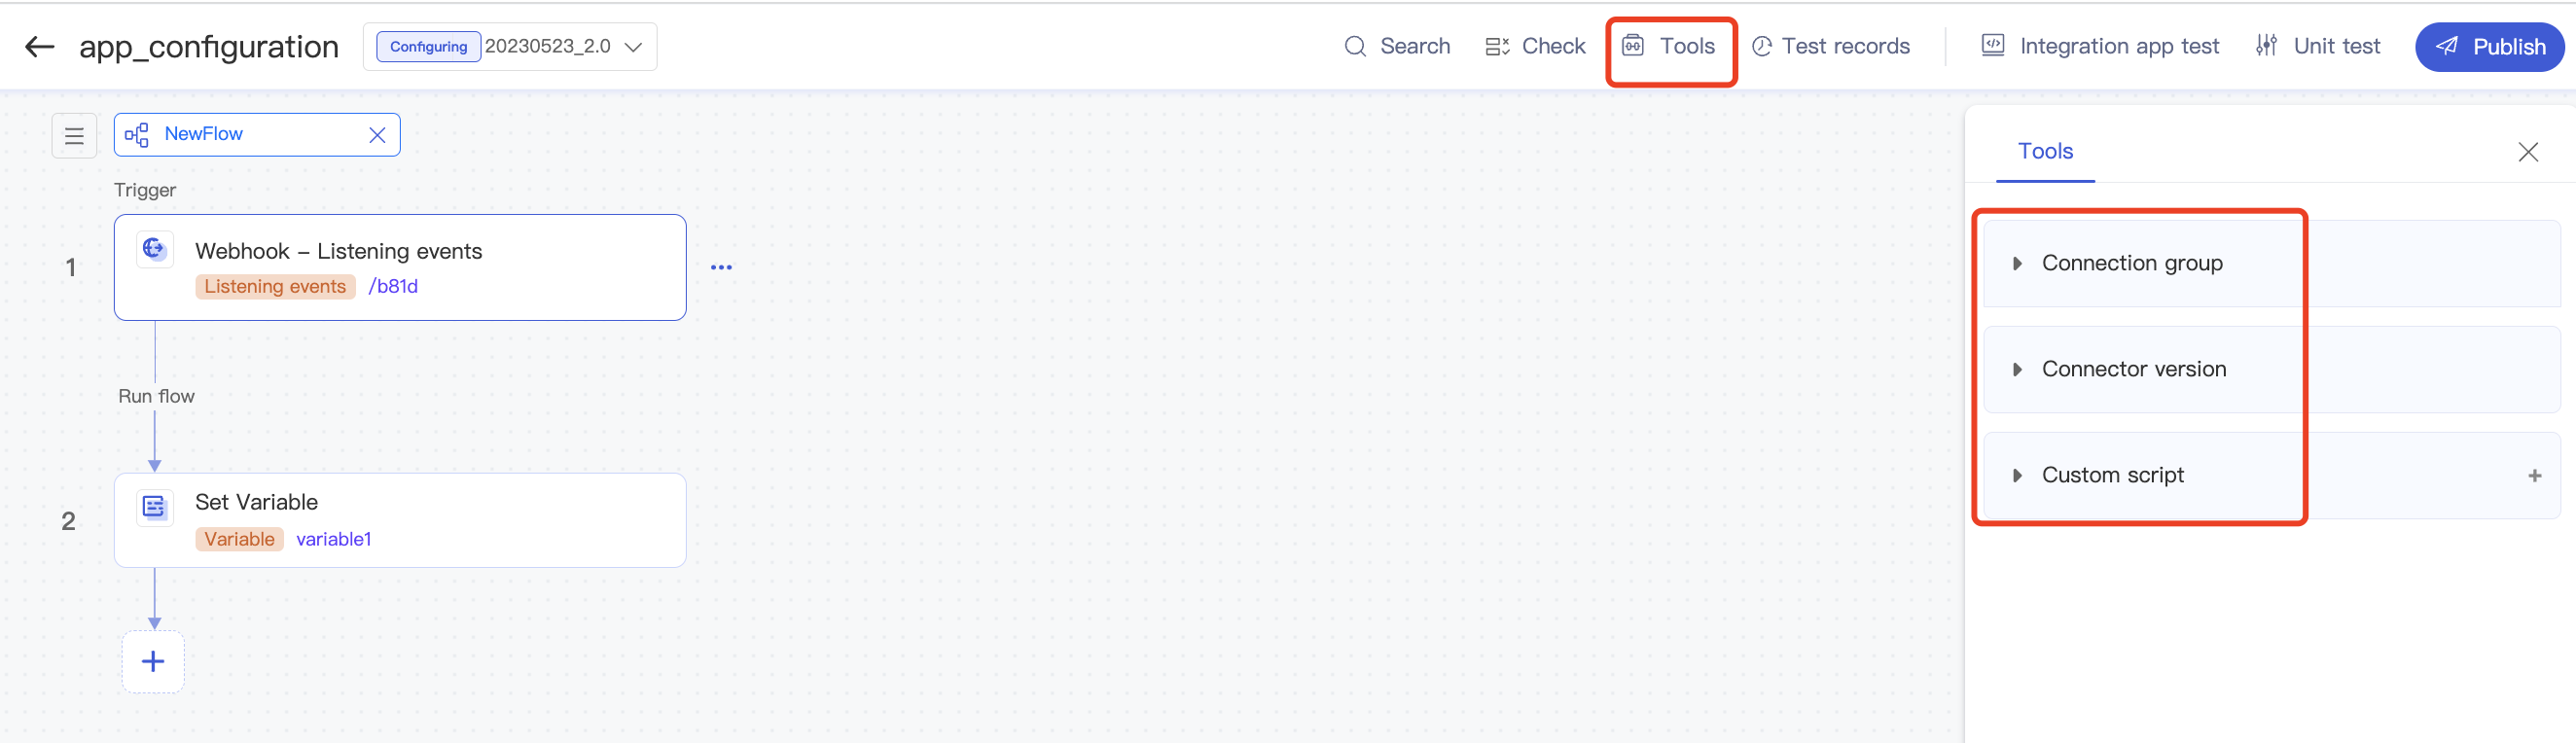
Switching connection groups
You can switch between connection groups on the toolbar for preview and testing.
Switching connector versions
Switch the app connector version: If the selected app connector has multiple versions, you can click Tools in the top-right corner and click Connector version to switch to the target version.
Note:If there is a red exclamation mark after the selected version, the version is not the latest one.
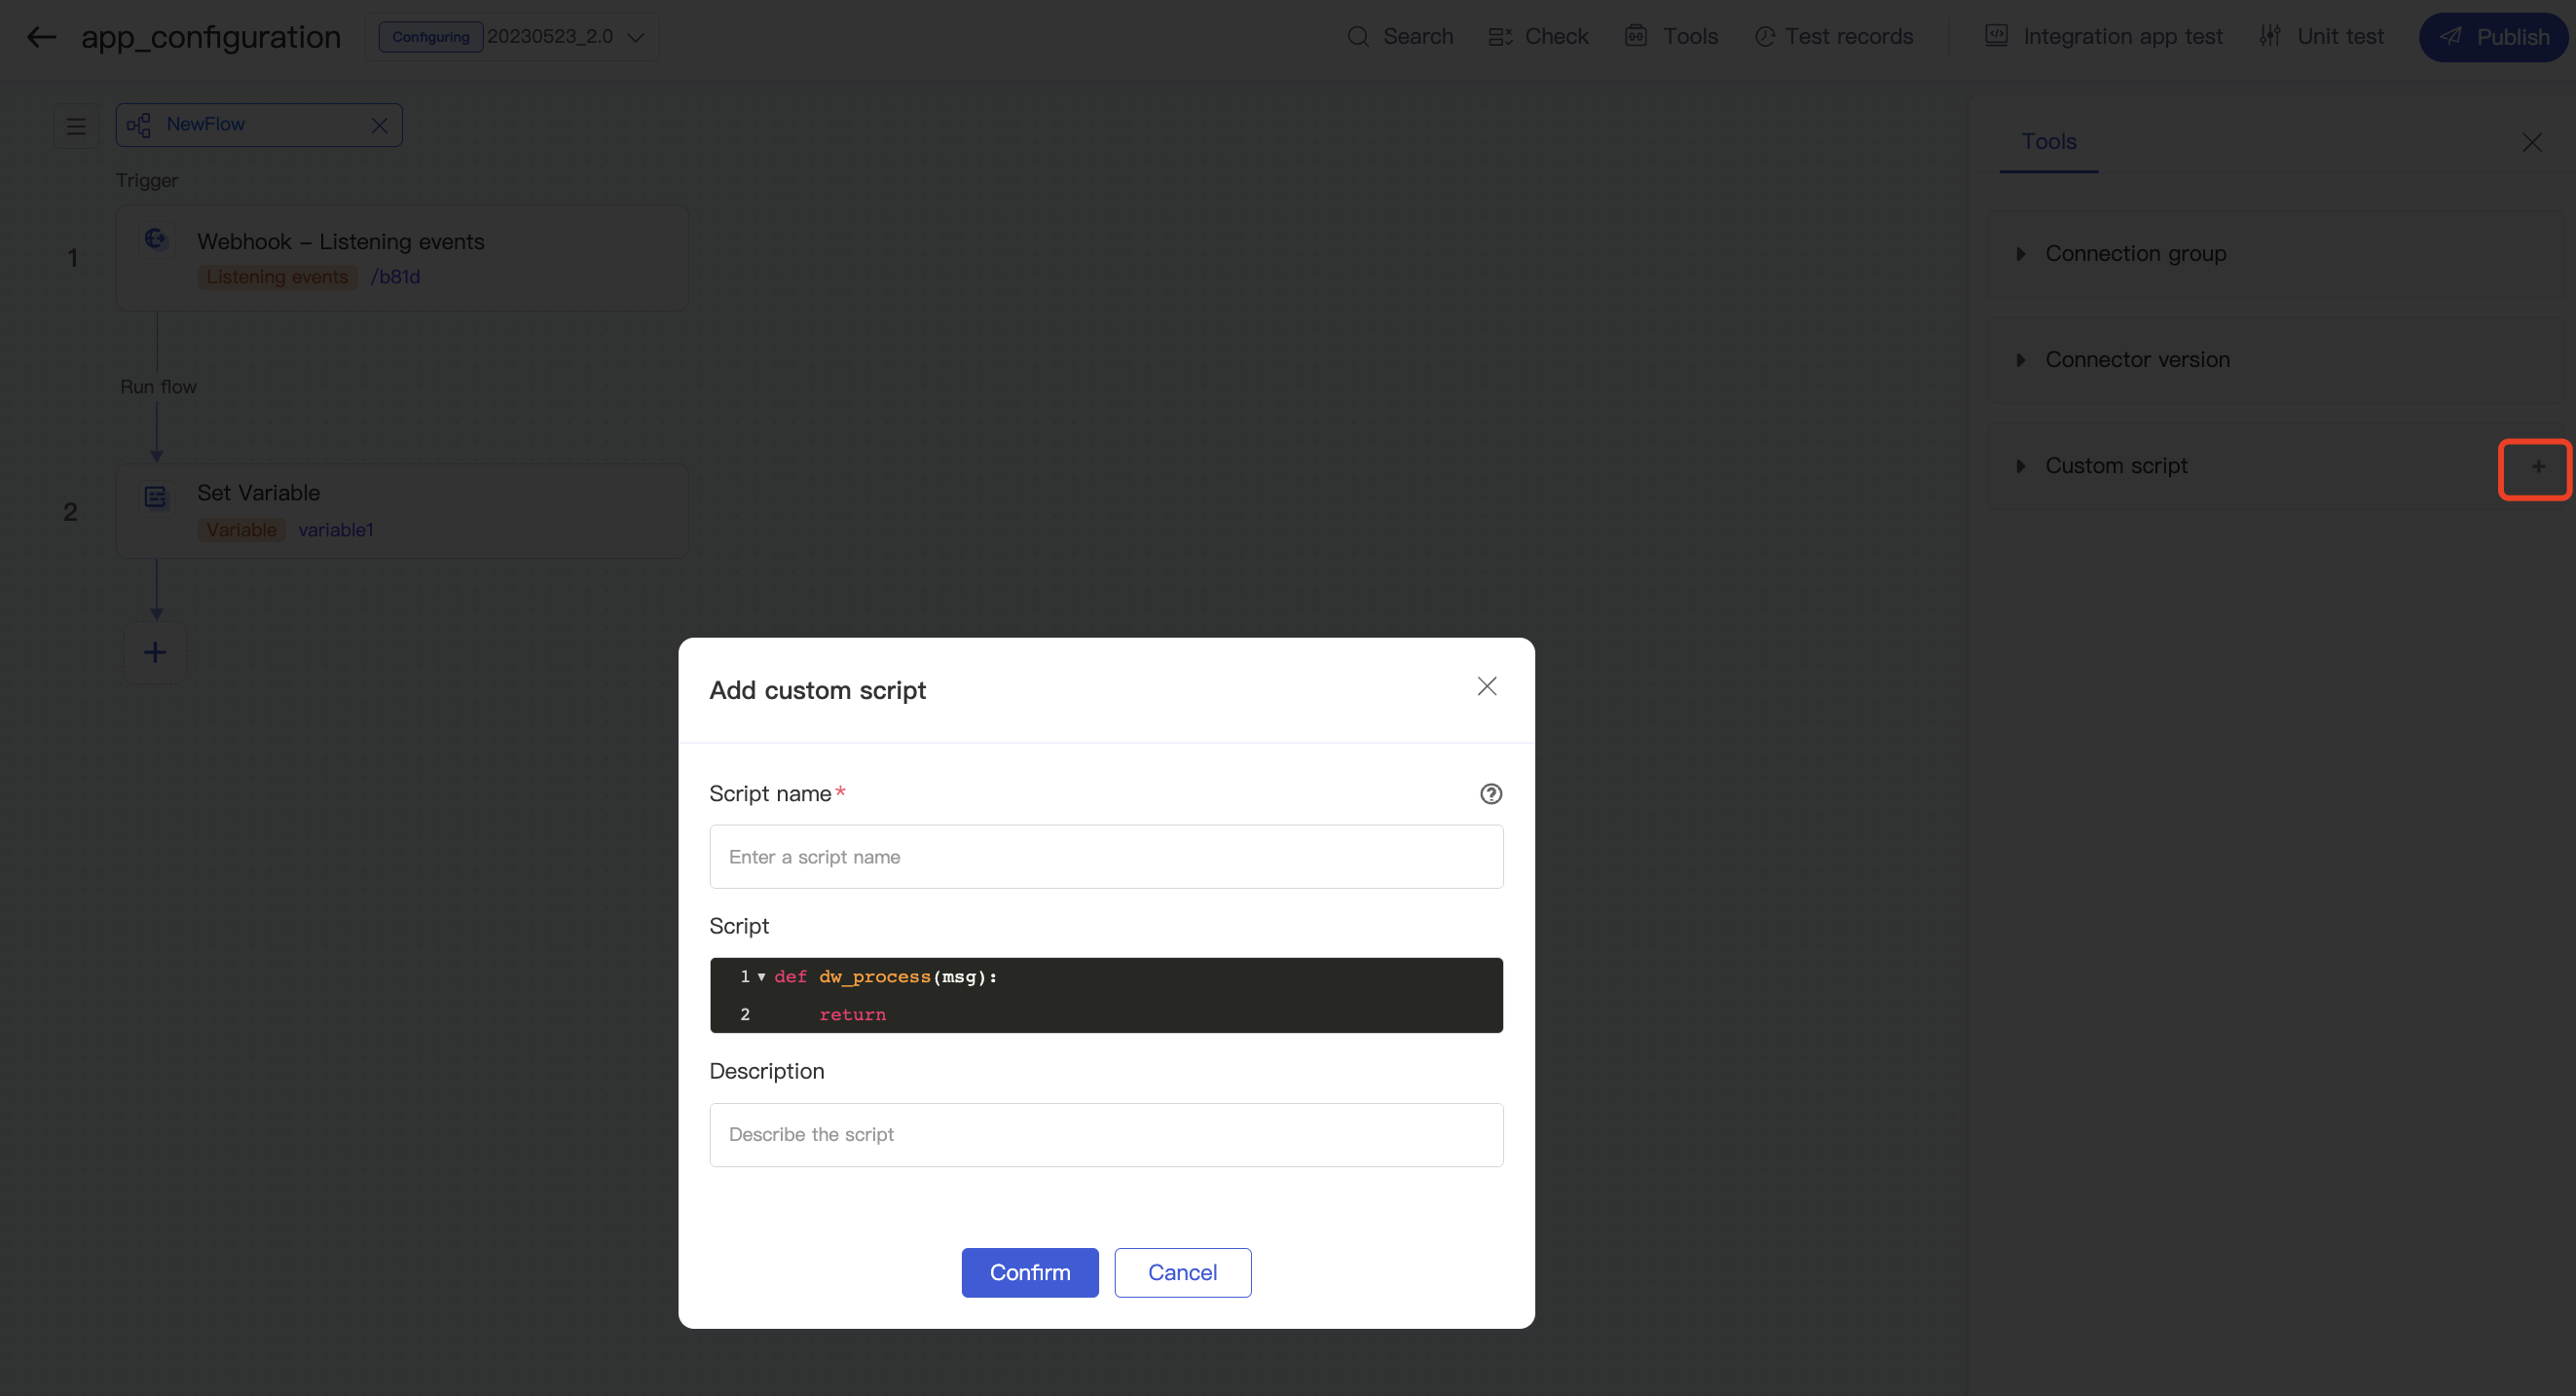
Custom script
iPaaS offers the custom Dataway script feature, which enables you to write custom functions and components. Custom scripts can be referenced only in the integration app where they are created. They cannot be referenced across projects or integration apps.
Adding/Deleting a custom script
Click Tools in the top-right corner and click + next to Custom script to add a custom script. Click a custom script name to view or modify the script. Click  to delete a script.
Note:Once a script is deleted, apps bound to it will throw an exception. Therefore, please exercise caution when deleting a script.
Referencing a custom script
After you select a component and click a Dataway expression for configuration, click  in the top-right corner or Click to bind to reference an existing custom script.
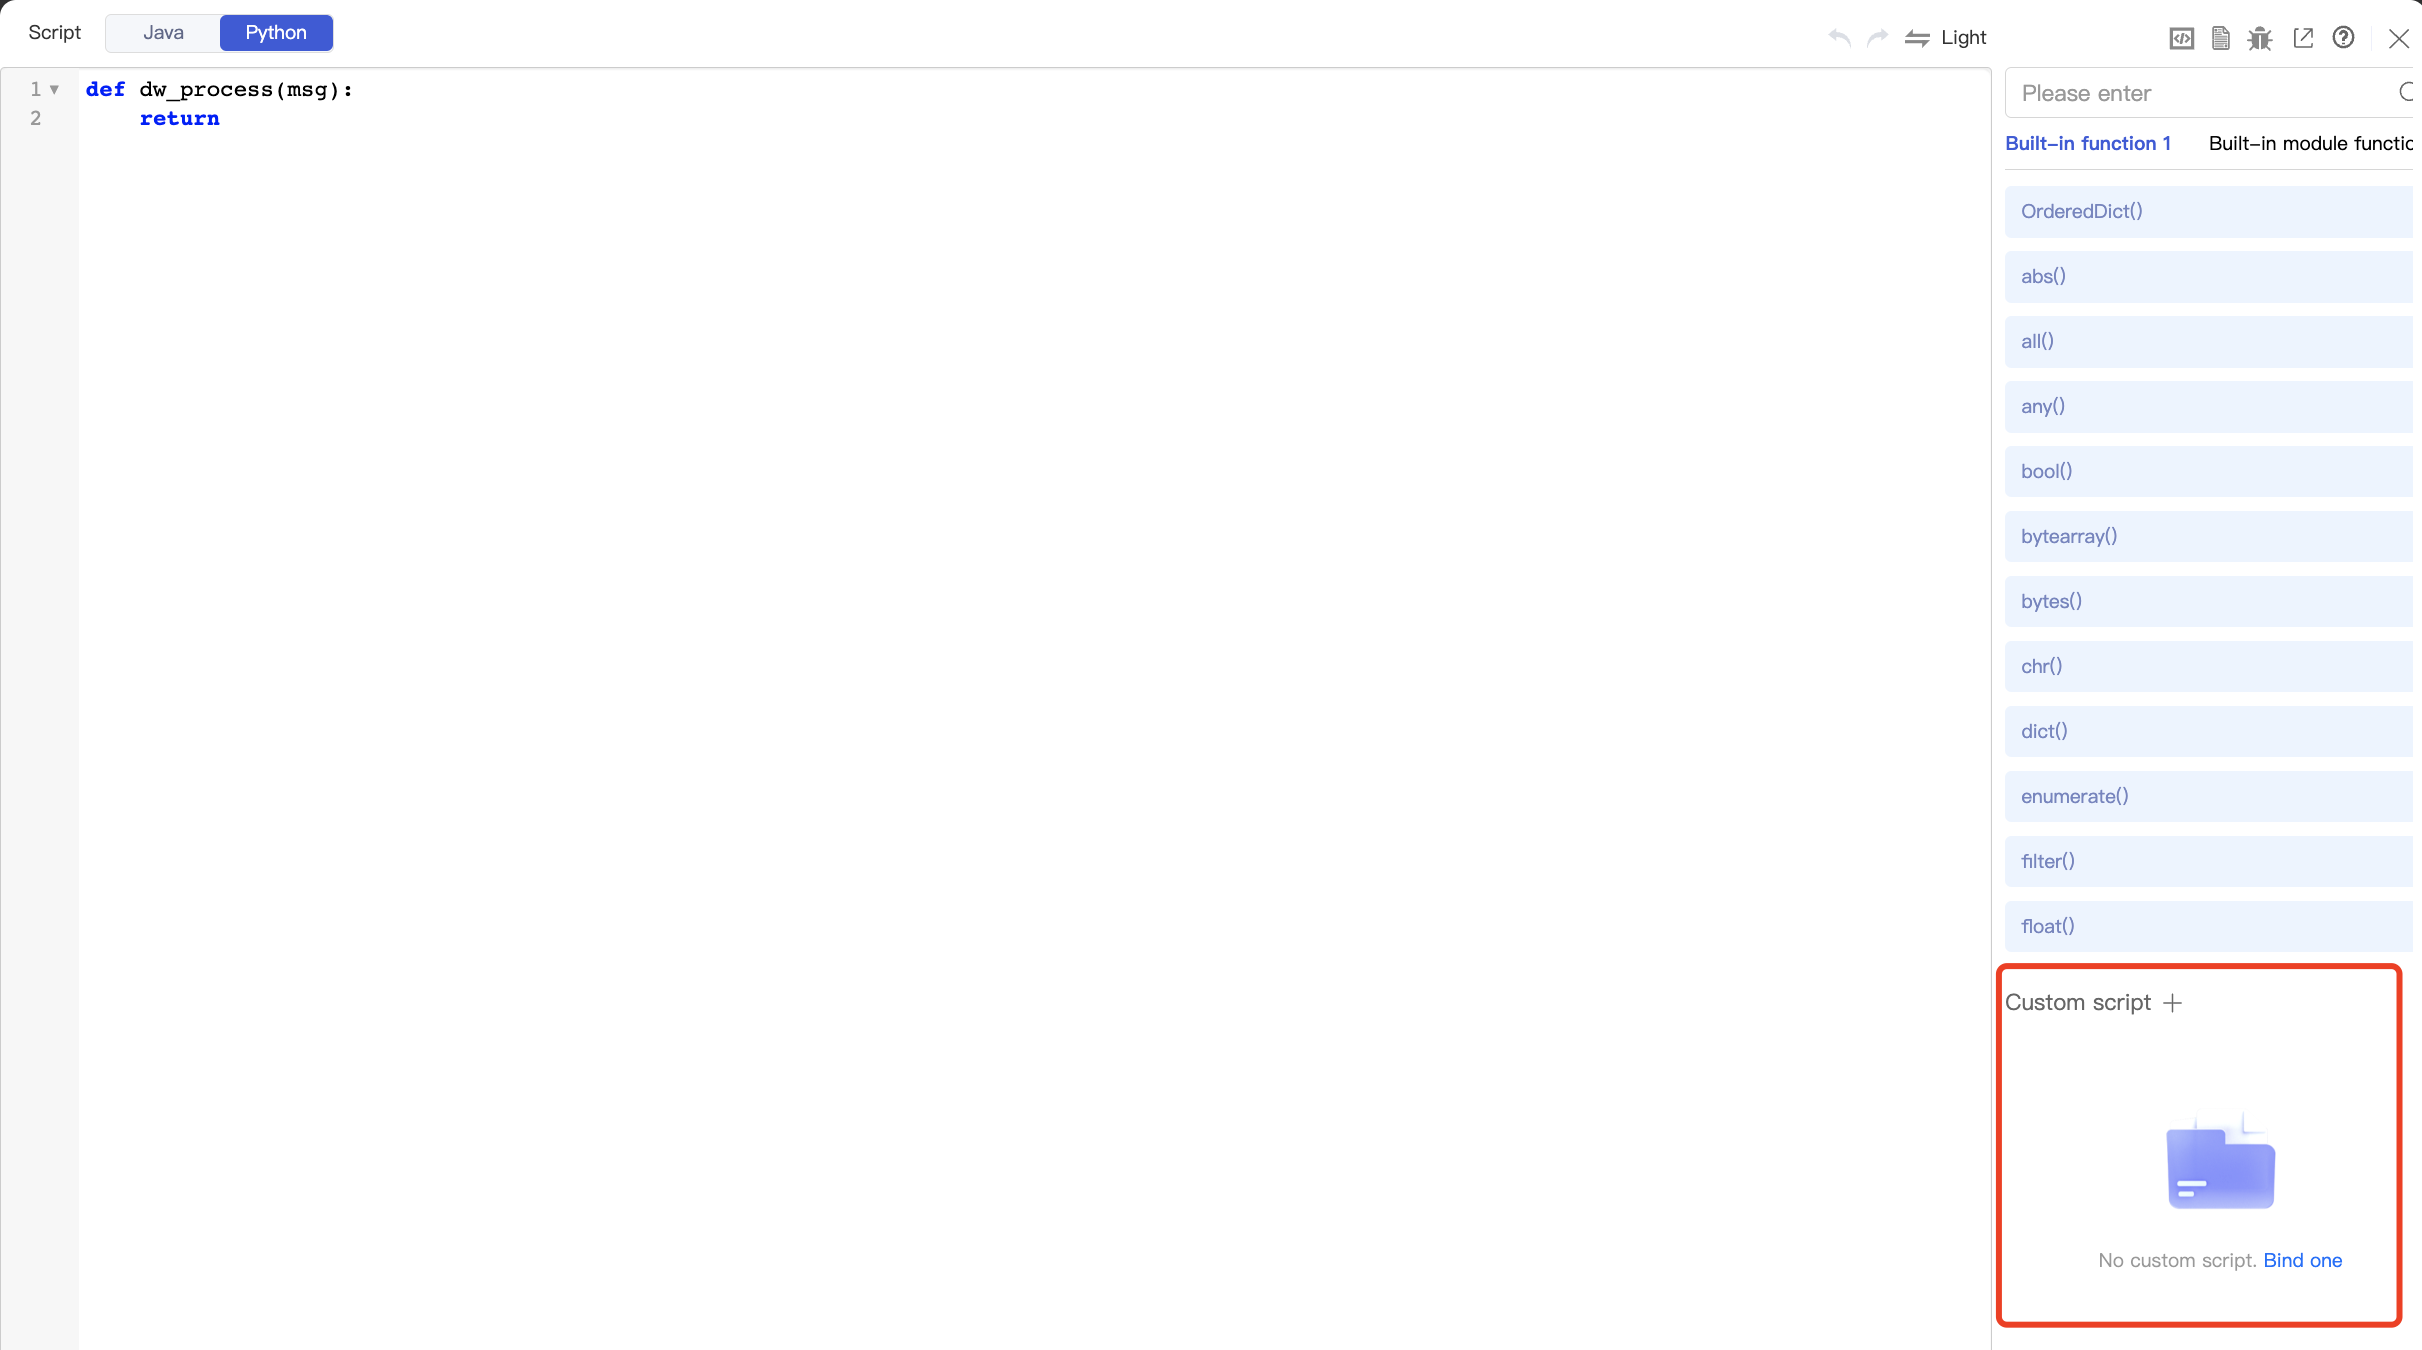
Publishing
After you have configured an integration app, you can publish it in one or multiple regions.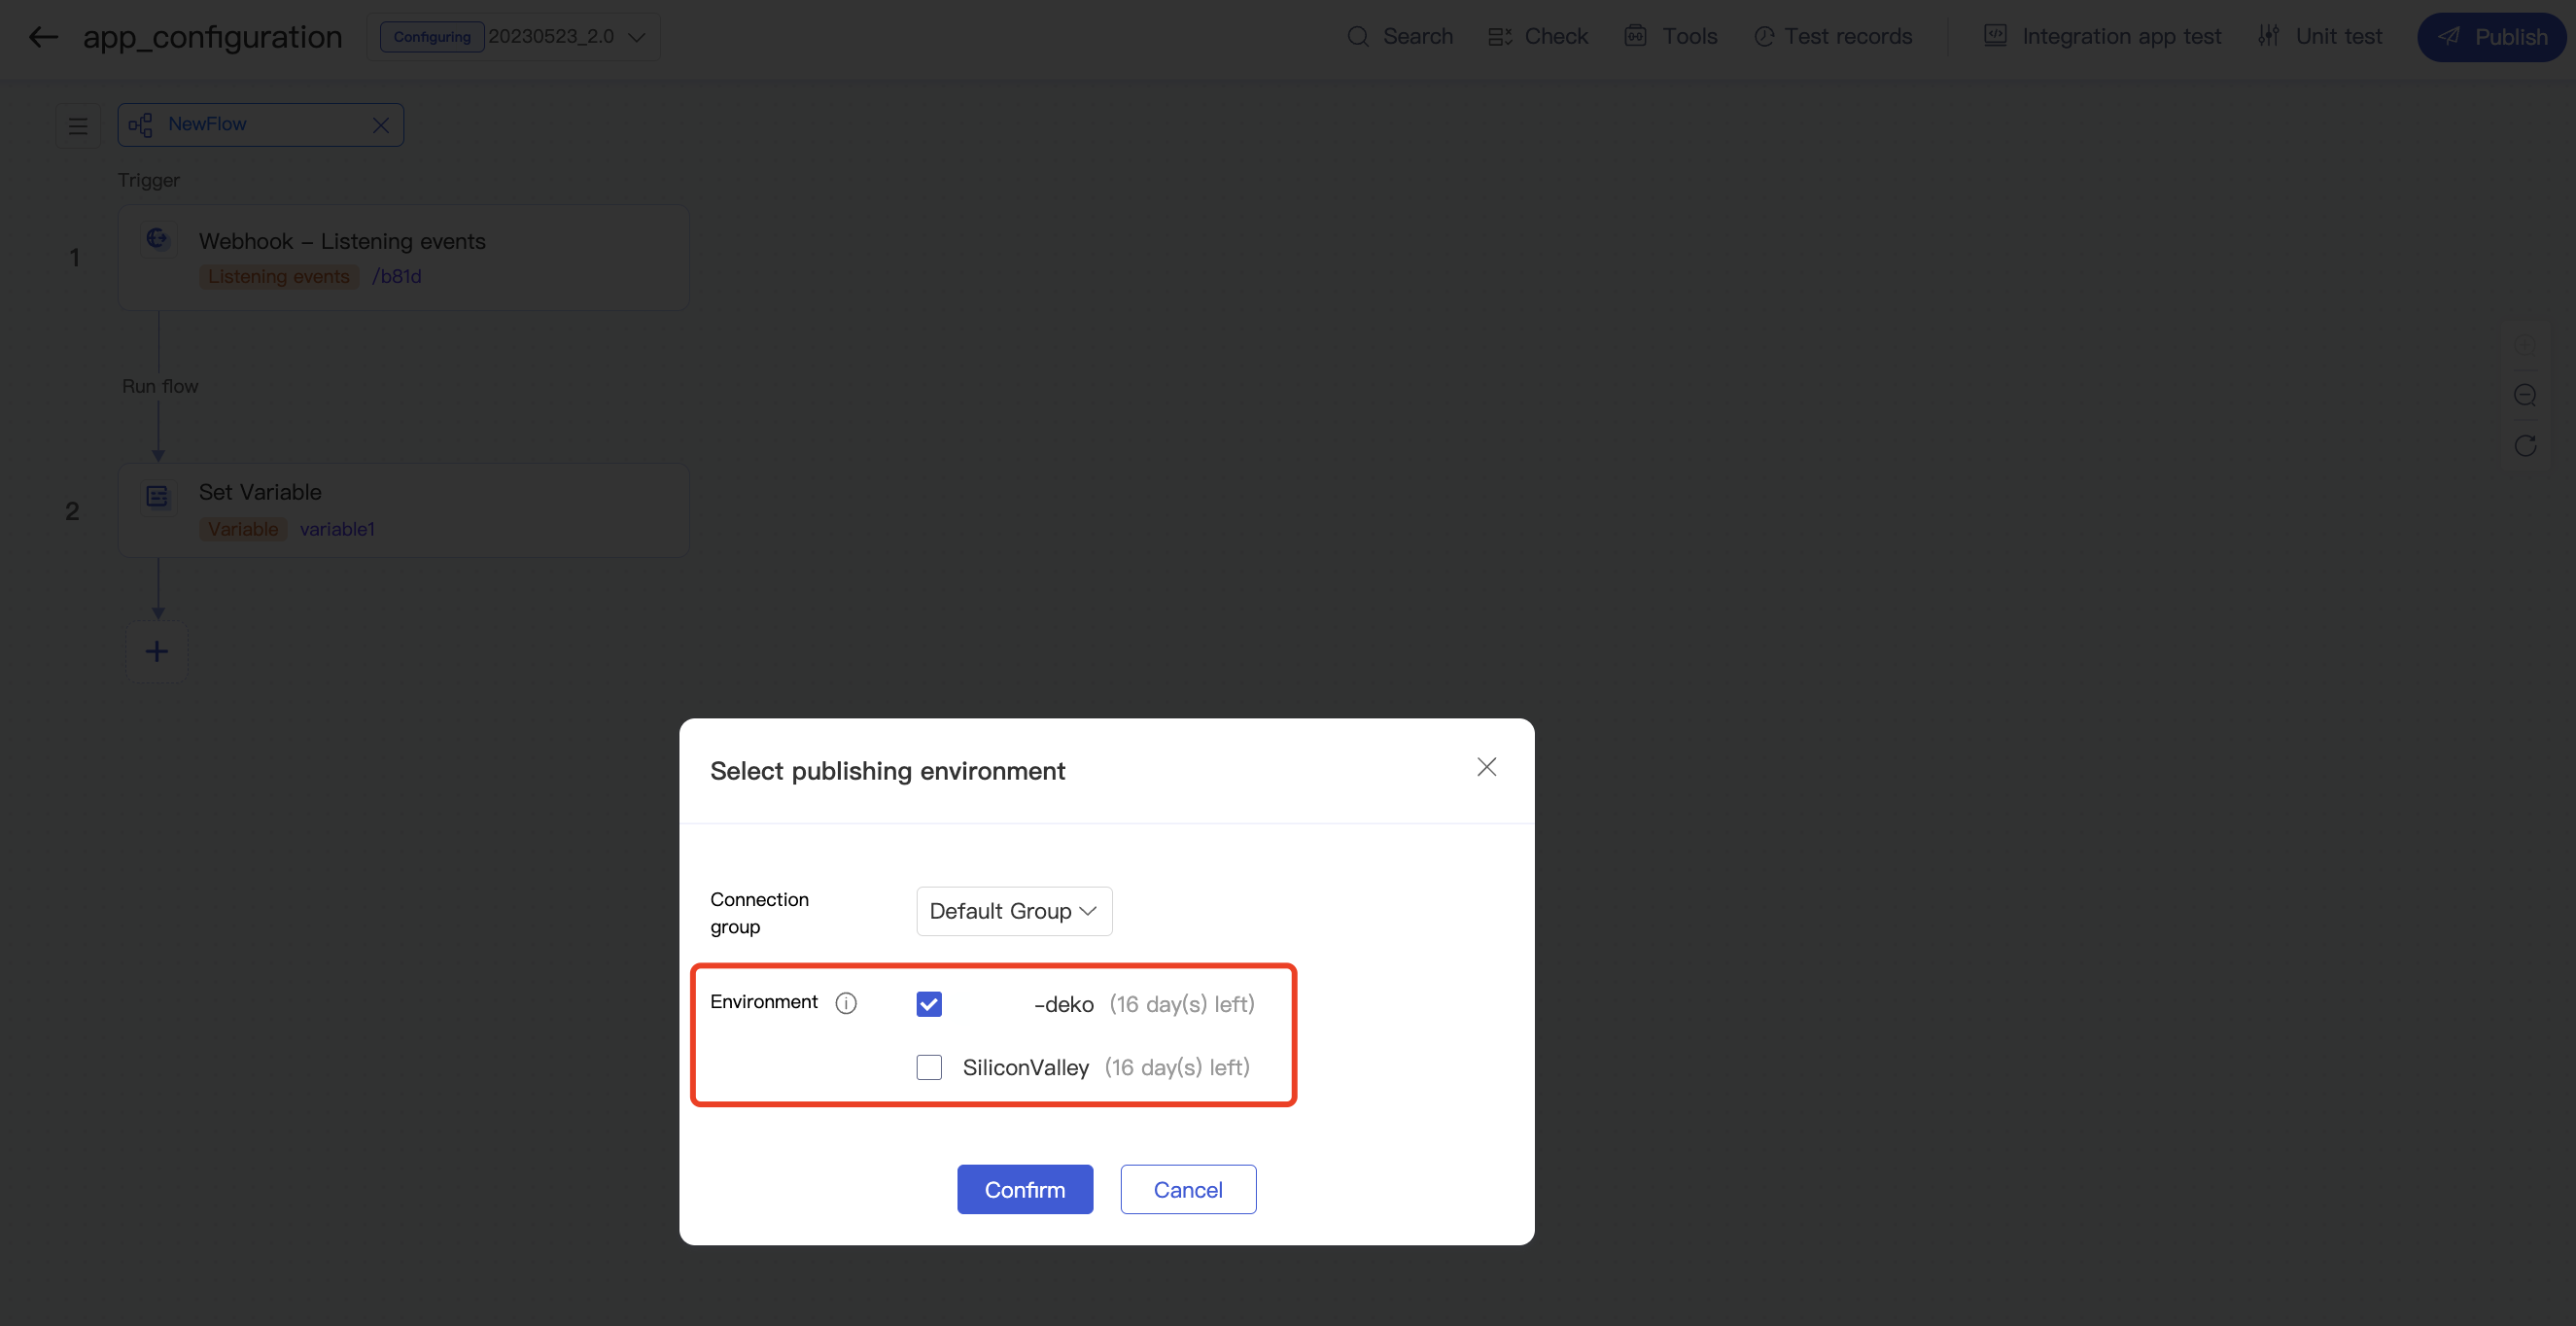
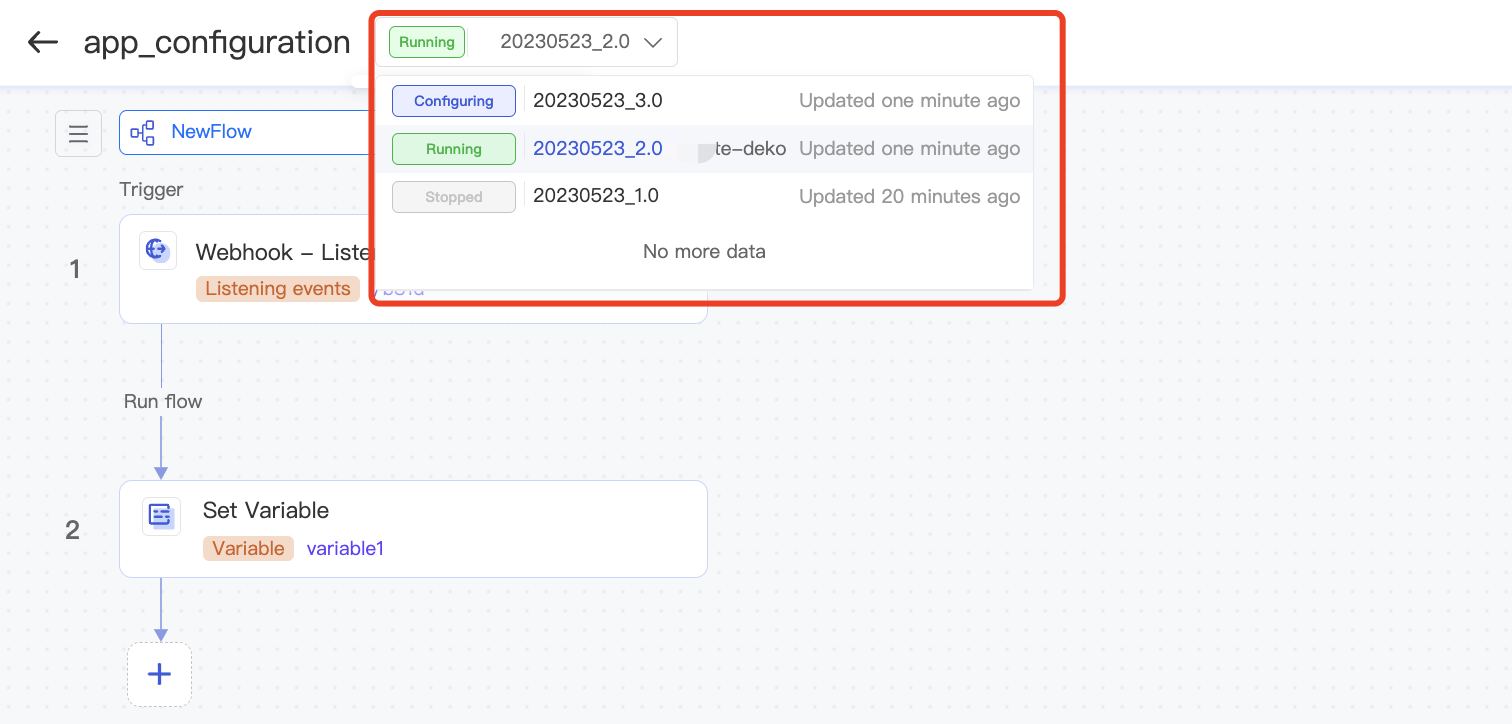
Versioning
Each integration app has a version number. After it is published, an integration app cannot be modified while it is running. In this case, you can copy the integration app to modify and debug a new version, which will not affect the version that is currently running.
Note:The Publishing environment field is added for apps created after September 20, 2022. When you publish an app again, the publishing environment selected last time is retained for easier management.

 Yes
Yes
 No
No
Was this page helpful?