tencent cloud

TencentCloud Managed Service for Prometheus

Product Introduction
Overview
Strengths
Use Cases
Concepts
Use Limits
Features
Service Regions
Purchase Guide
Billing Overview
Pay-as-You-Go (Postpaid)
Free Trial Introduction
Managed Collector Billing Introduction
Archive Storage Billing Introduction
Purchase Methods
Payment Overdue
Getting Started
Integration Guide
Scrape Configuration Description
Custom Monitoring
EMR Integration
Java Application Integration
Go Application Integration
Exporter Integration
Nacos Integration
Common Exporter
Health Check
Instructions for Installing Components in the TKE Cluster
Cloud Monitoring
Non-Tencent Cloud Host Monitoring
Read Cloud-Hosted Prometheus Instance Data via Remote Read
Agent Self-Service Access
Pushgateway Integration
Security Group Open Description
Operation Guide
Instance
TKE
Integration Center
Data Multi-Write
Recording Rule
Instance Diagnosis
Archive Storage
Alerting Rule
Tag
Access Control
Grafana
API Guide
TKE Metrics
Resource Usage and Billing Overview
Practical Tutorial
Migration from Self-Built Prometheus
Custom Integration with CVM
TKE Monitoring
Enabling Public Network Access for TKE Serverless Cluster
Connecting TMP to Local Grafana
Enabling Public Network Access for Prometheus Instances
Configuring a Public Network Address for a Prometheus Instance
Terraform
Terraform Overview
Managing Prometheus Instances Using Terraform
Managing the Integration Center of Prometheus Instances Using Terraform
Collecting Container Monitoring Data Using Terraform
Configuring Alarm Policies Using Terraform
FAQs
Basic Questions
Integration with TKE Cluster
Product Consulting
Use and Technology
Cloud Monitor FAQs
Service Level Agreement
TMP Policy
Privacy Policy
Data Processing And Security Agreement

EMR Metric Collection Component of Prometheus

PDF
Focus Mode
Font Size
Last updated: 2024-10-29 11:44:46

Overview

During the use of Tencent Cloud Elastic MapReduce (EMR), you need to report EMR monitoring metrics to TencentCloud Managed Service for Prometheus (TMP). This document will guide you on how to quickly collect EMR monitoring metrics.

Prerequisites

You have used EMR and enabled the Prometheus Exporter feature.
Use the same region and Virtual Private Cloud (VPC) as EMR to purchase a Tencent Cloud Prometheus monitoring instance. You can check the regions supported by TMP.

Directions

1. log in to  TCOP .
2. In the left menu bar, click Managed Service for Prometheus.
3. In the Prometheus instance list, select the corresponding Prometheus instance.
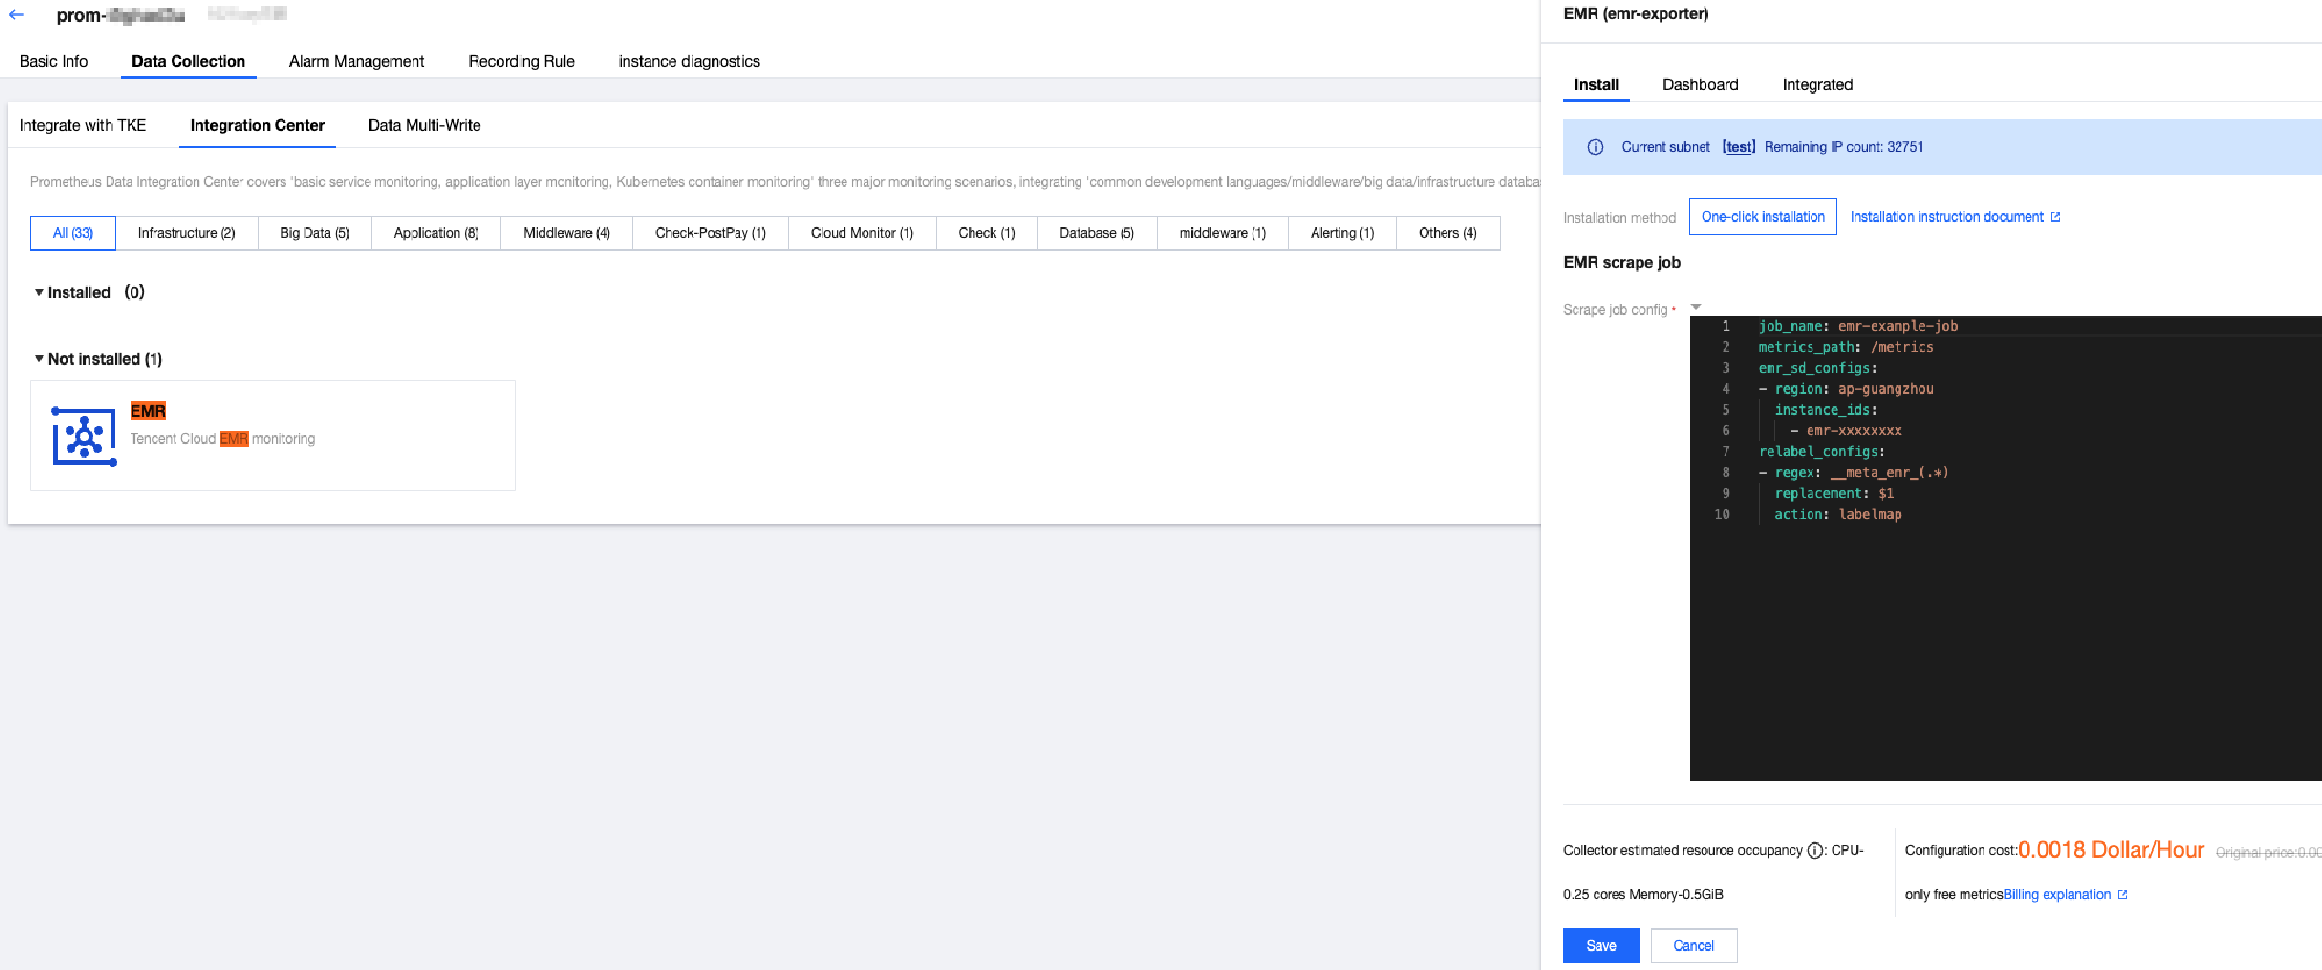
4. Enter the instance details page, click Data Collection > Integration Center.
5. Search for EMR in the integration center, and click it to pop up an installation window. Then, confirm the information and click Save.
Search for the required CAM policy as needed, and click to complete policy association.


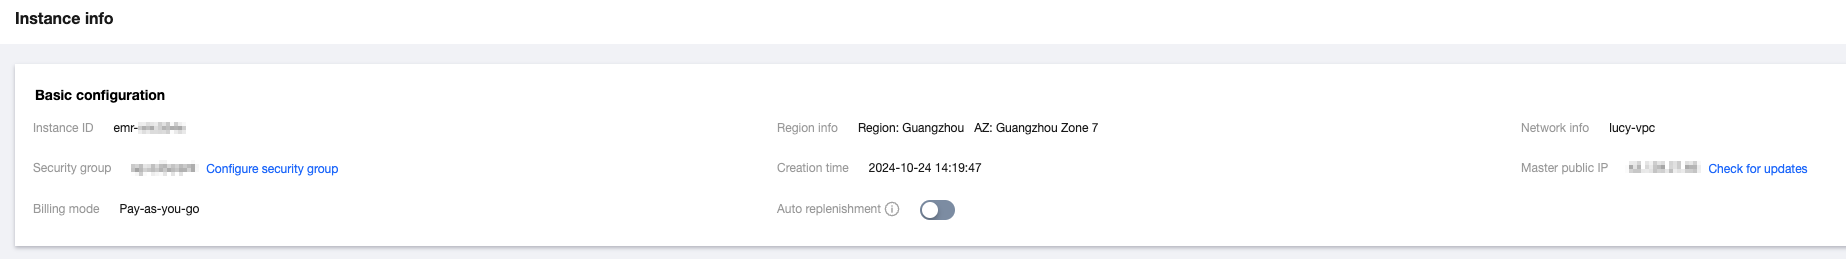
6. Log in to the EMR Console, click Cluster ID/Name > Instance info, and obtain the region where the EMR cluster is located and the EMR instance ID of the cluster.
Search for the required CAM policy as needed, and click to complete policy association.


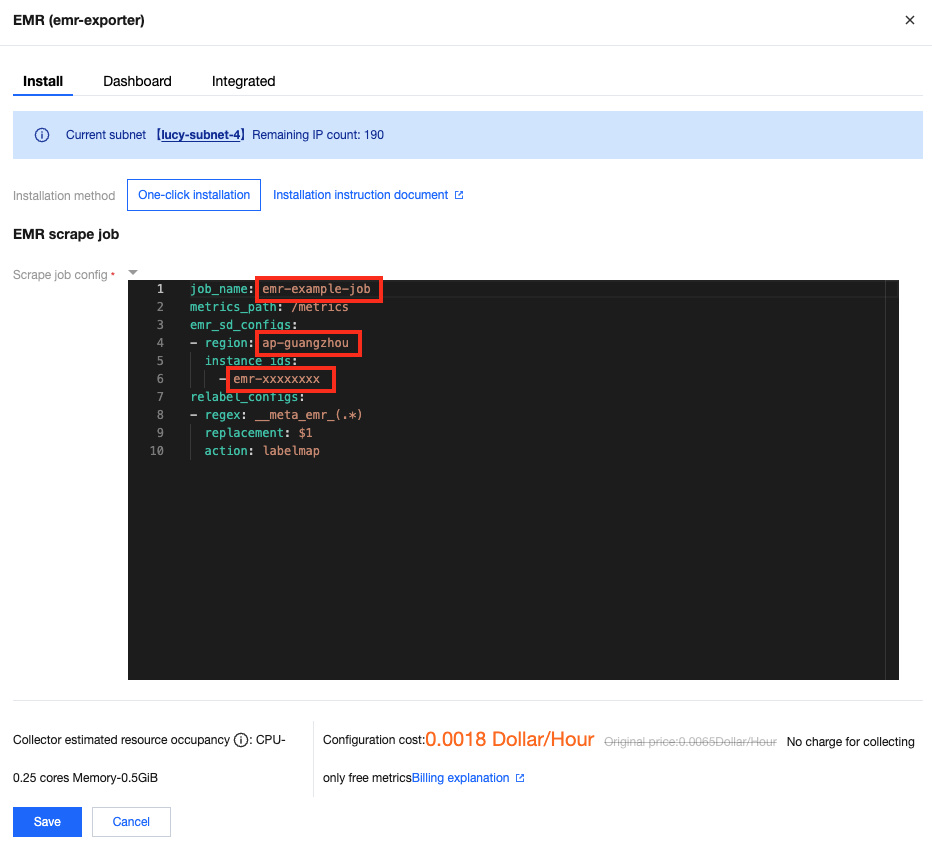
7. Fill in the task configuration (in YAML format) in EMR. Then, fill in the task name, region where the EMR cluster is located, and EMR instance ID in the red box of the following figure.
Note:
For the format of the region, see the region description in Service Region, for example, ap-guangzhou.
Multiple instance IDs are supported.
For the relabel_configs configuration, see Capture Configuration Instructions.
Search for the required CAM policy as needed, and click to complete policy association.


Supported Metrics

TMP supports all EMR metrics. For a detailed metric list, see EMR Cluster Monitoring Metrics.

Help and Support

Was this page helpful?

Help us improve! Rate your documentation experience in 5 mins.

Feedback