This document describes how to integrate CVM with TMP.
Purchasing a TMP Instance
Note:
The purchased TMP instance must be in the same VPC as the monitored CVM instance for network connectivity.
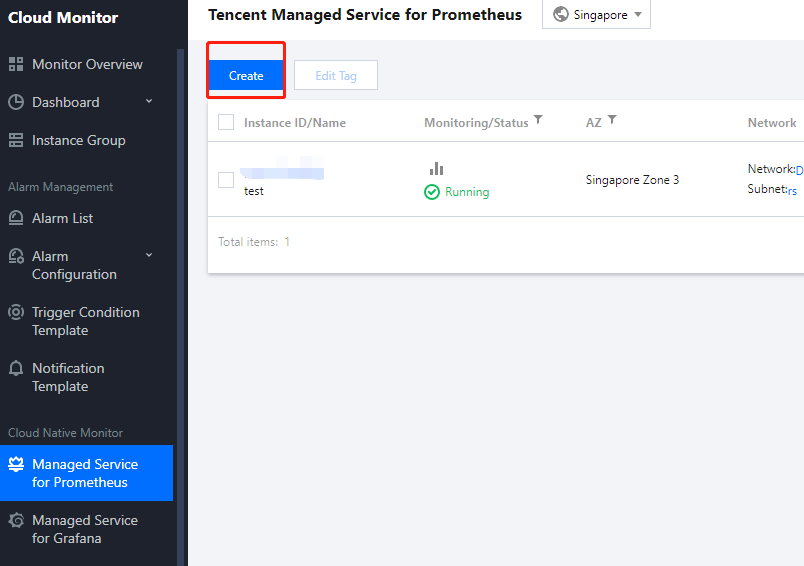
1. Log in to the TMP console and click Create to purchase a TMP instance.
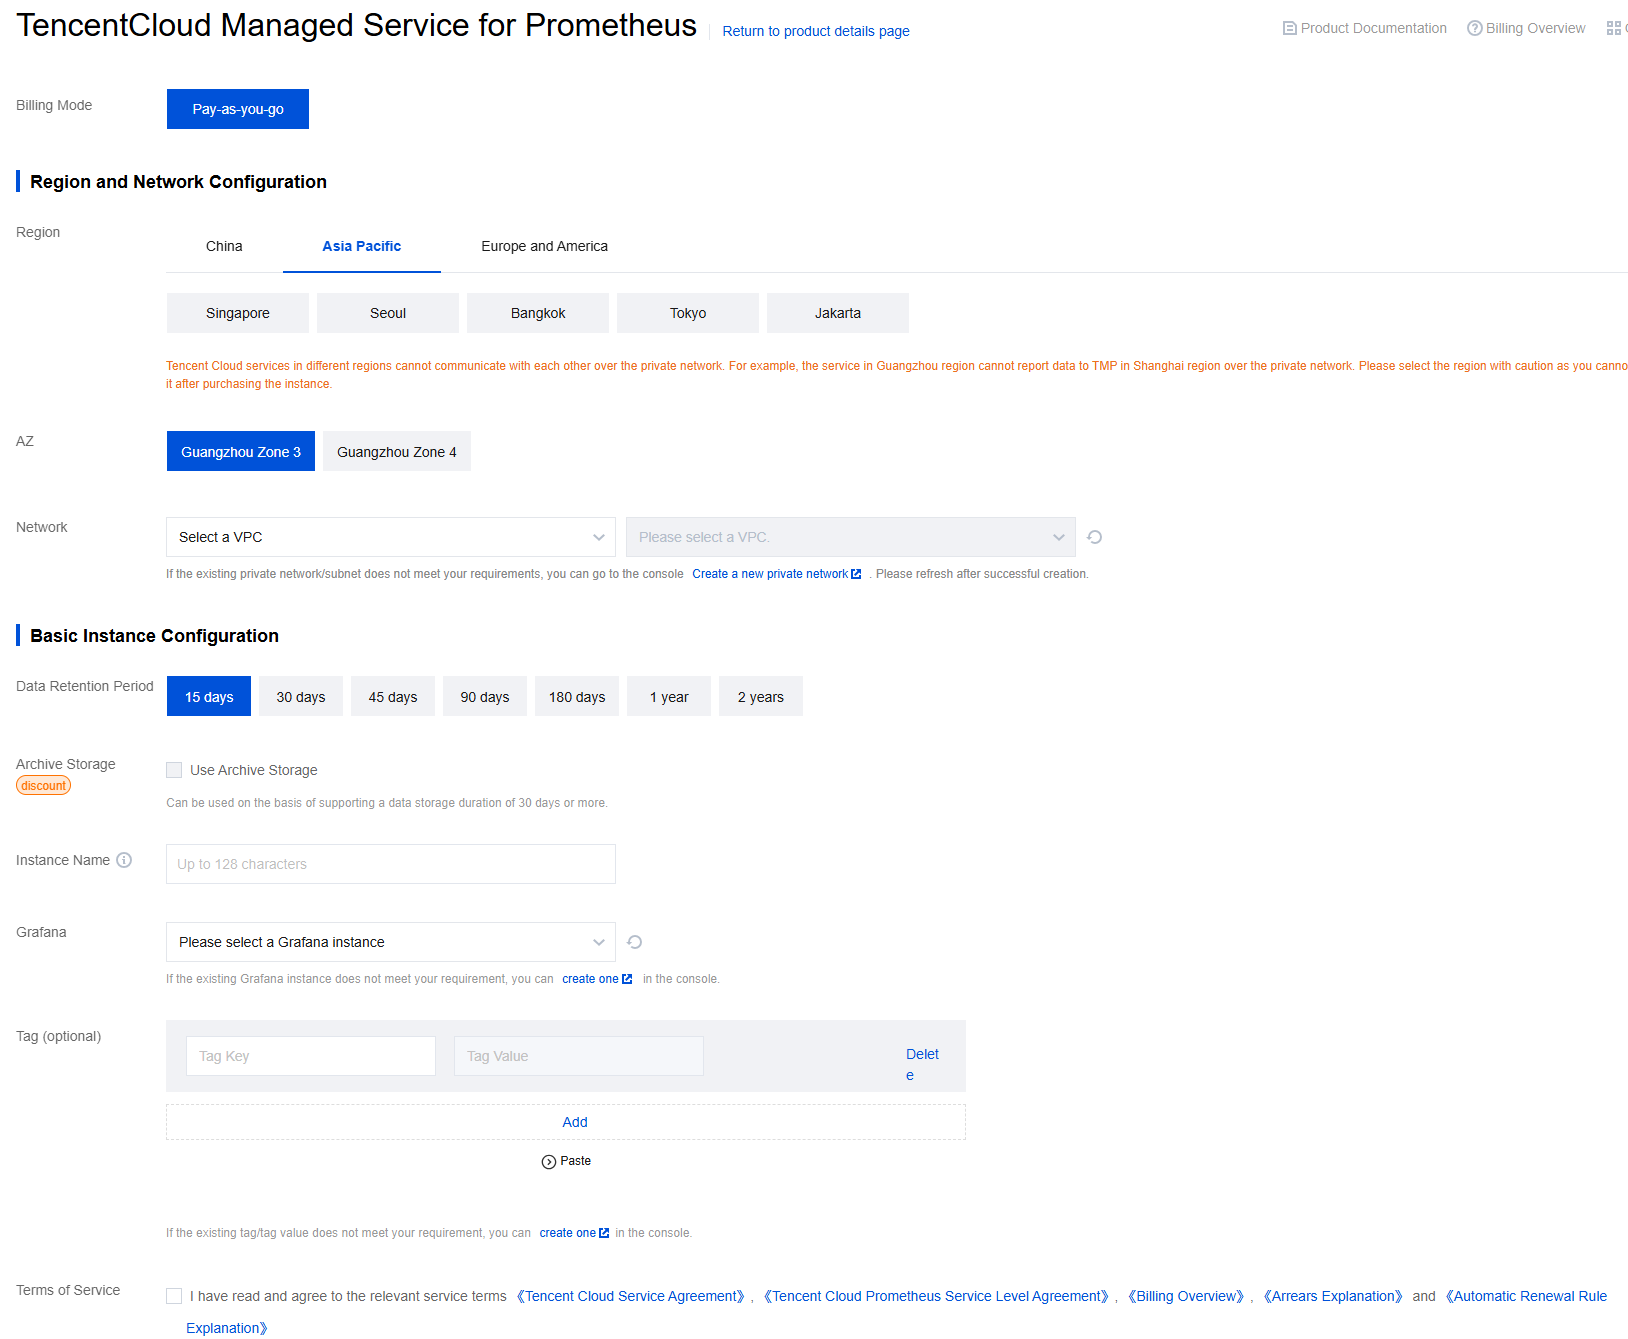
2. On the purchase page, select the target instance specification and network. Make sure that the TMP and CVM instances have the same VPC IP range so that data can be collected. Select the instance specification based on your reported data volume.
3. Click Buy Now and make the payment.
Integrating CVM Basic Metrics
1. Download and install Node Exporter.
Download and install Node Exporter (used to collect basic metric data) in the target CVM instance. Click here or run the following command for download:
2. Run Node Exporter to collect basic monitoring data.
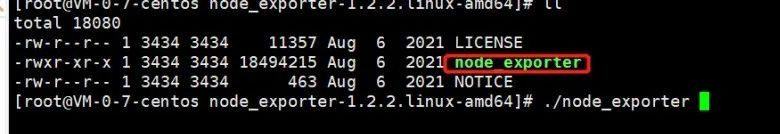
2.1 Go to the target folder and run Node Exporter.
cd node_exporter-1.3.1.linux-amd64
./node_exporter
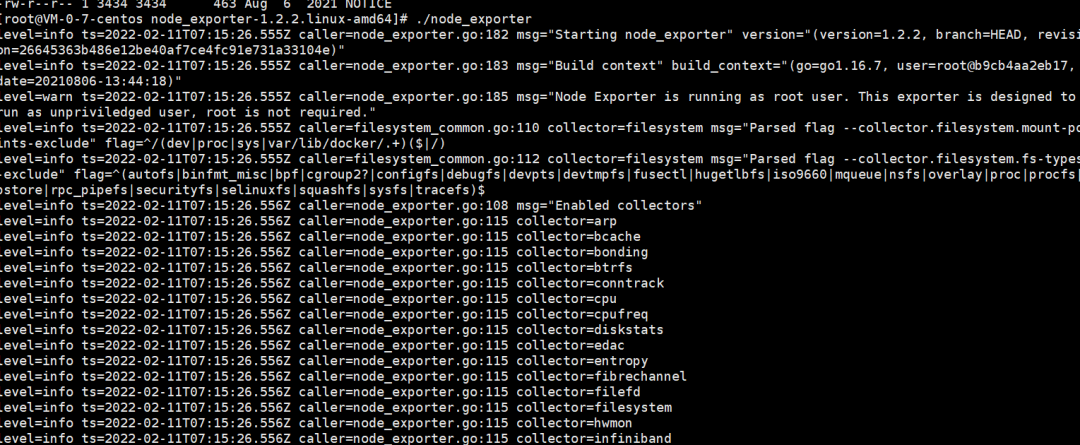
If the following result is displayed, basic monitoring data has been collected successfully.
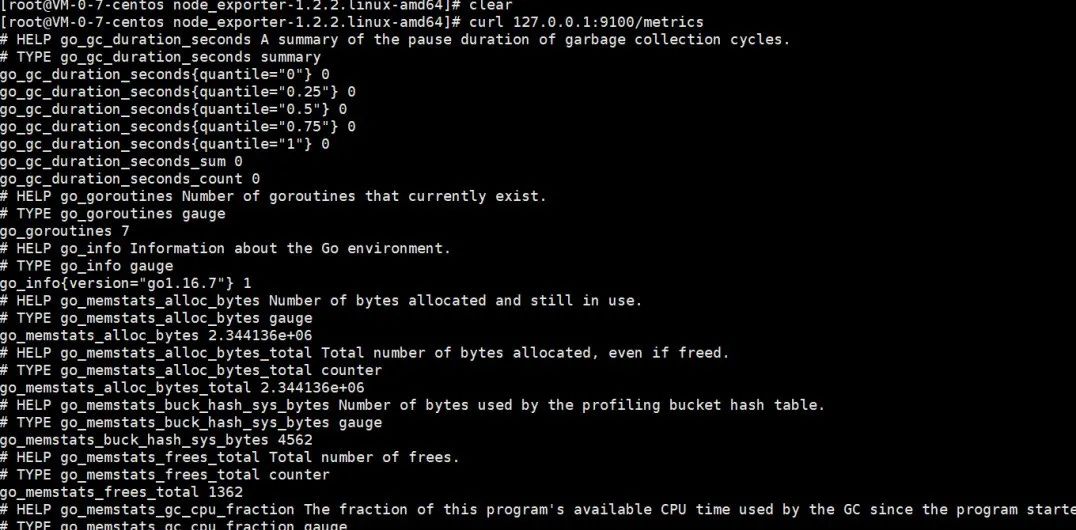
2.2 Run the following command to expose the basic monitoring data to port 9100:
curl127.0.0.1:9100/metrics
You can see the following metric monitoring data that is exposed after the command is executed.
3. Add a scrape task. Log in to the TMP console, select Data Collection > Integration Center > CVM Scrape Job, and configure the information in Task Configuration as prompted.
Below is a sample configuration of a scrape task:
job_name: example-job-name
metrics_path: /metrics
cvm_sd_configs:
- region: ap-guangzhou
ports:
- 9100
filters:
- name: tag:Sample tag key
values:
- Sample tag value
relabel_configs:
- source_labels: [__meta_cvm_instance_state]
regex: RUNNING
action: keep
- regex: __meta_cvm_tag_(.*)
replacement: $1
action: labelmap
- source_labels: [__meta_cvm_region]
target_label: region
action: replace
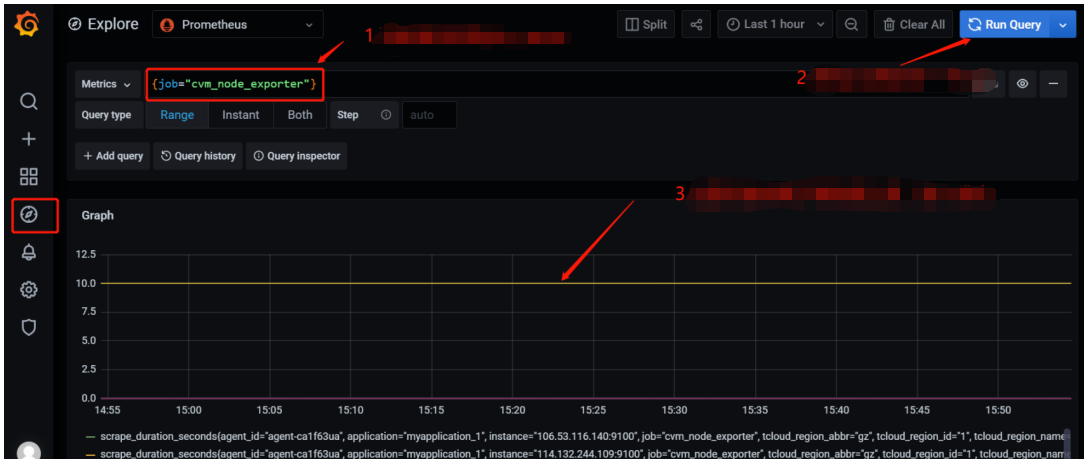
4. Check whether data is reported successfully.
Log in to the TMP console and click the Grafana icon to enter Grafana. Search for {job="cvm_node_exporter"} in Explore to see whether there is data, and if so, data is reported successfully.
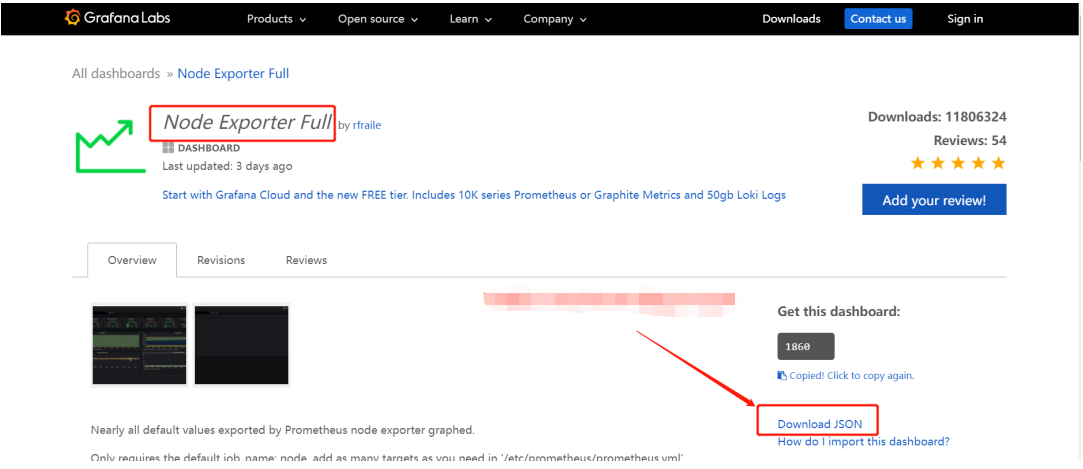
5. Configure the dashboard page: Every product has some existing JSON files that can be directly imported into the dashboard.
5.1 Download a dashboard file: Go to the Dashboard page, search for node_exporter, and select the latest dashboard for download.
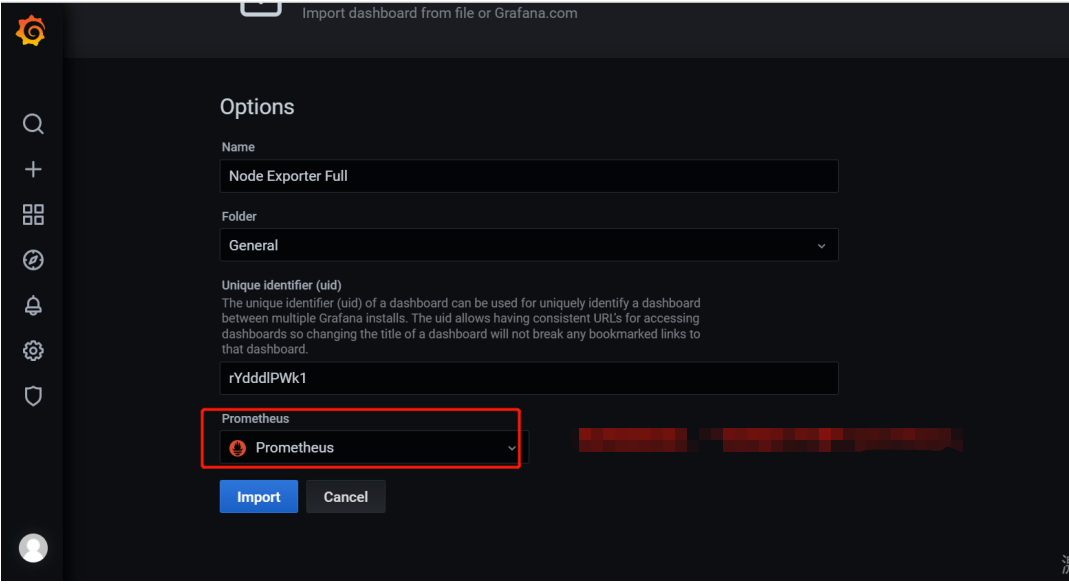
5.2 Import a JSON file into the dashboard: Log in to the TMP console, select Basic Info > Grafana Address to enter Grafana. In the Grafana console, select Create > Import and upload the dashboard file in Upload JSON file.
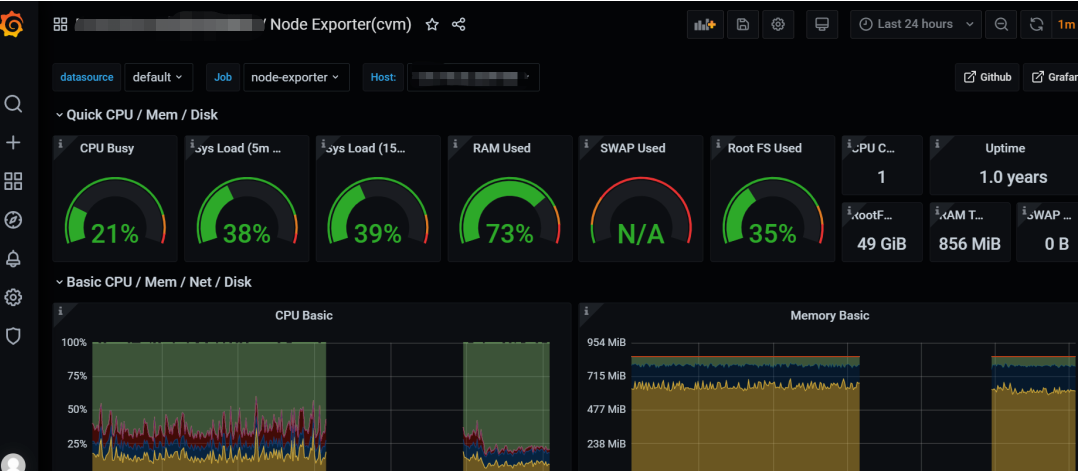
The effect after configuring is as follows:
Integrating CVM Metrics at the Business Layer
Prometheus provides four metric types for different monitoring scenarios: Counter, Gauge, Histogram, and Summary. The Prometheus community provides SDKs for multiple programing languages, which are basically similar in usage and mainly differ in the syntax. The following uses Go as an example to describe how to report custom monitoring metrics. For detailed directions of other metric types, see Custom Monitoring.
Counter
A metric in Counter type increases monotonically and will be reset after service restart. You can use counters to monitor the numbers of requests, exceptions, user logins, orders, etc.
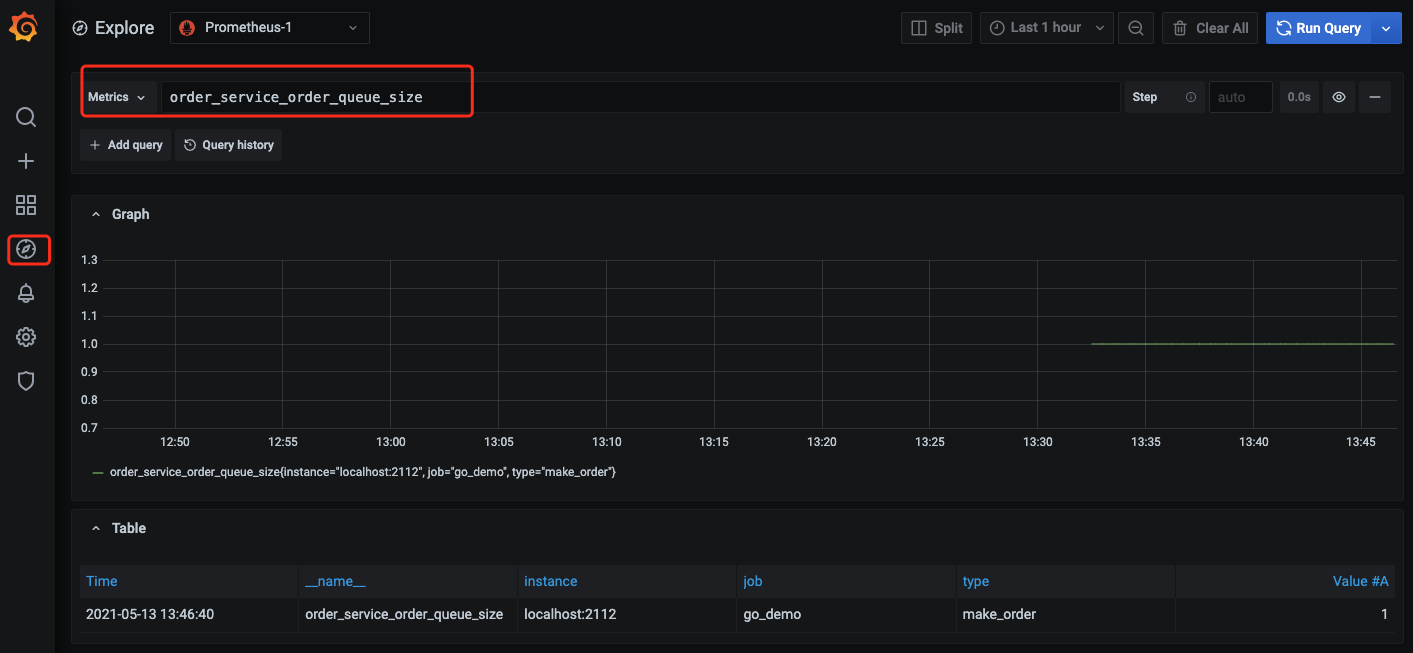
1. You can use a counter to monitor the number of orders as follows:
After the tracking of custom metrics for your business is completed and the application is released, you can use Prometheus to collect the monitoring metric data. After the collection is completed, wait a few minutes and then you can view the business metric monitoring data in Grafana integrated in TMP.