tencent cloud

Tencent Cloud Observability Platform

Release Notes and Announcements
Release Notes
Product Introduction
Overview
Strengths
Basic Features
Basic Concepts
Use Cases
Use Limits
Purchase Guide
Tencent Cloud Product Monitoring
Application Performance Management
Mobile App Performance Monitoring
Real User Monitoring
Cloud Automated Testing
Prometheus Monitoring
Grafana
EventBridge
PTS
Quick Start
Monitoring Overview
Instance Group
Tencent Cloud Product Monitoring
Application Performance Management
Real User Monitoring
Cloud Automated Testing
Performance Testing Service
Prometheus Getting Started
Grafana
Dashboard Creation
EventBridge
Alarm Service
Cloud Product Monitoring
Tencent Cloud Service Metrics
Operation Guide
CVM Agents
Cloud Product Monitoring Integration with Grafana
Troubleshooting
Practical Tutorial
Application Performance Management
Product Introduction
Access Guide
Operation Guide
Practical Tutorial
Parameter Information
FAQs
Mobile App Performance Monitoring
Overview
Operation Guide
Access Guide
Practical Tutorial
Tencent Cloud Real User Monitoring
Product Introduction
Operation Guide
Connection Guide
FAQs
Cloud Automated Testing
Product Introduction
Operation Guide
FAQs
Performance Testing Service
Overview
Operation Guide
Practice Tutorial
JavaScript API List
FAQs
Prometheus Monitoring
Product Introduction
Access Guide
Operation Guide
Practical Tutorial
Terraform
FAQs
Grafana
Product Introduction
Operation Guide
Guide on Grafana Common Features
FAQs
Dashboard
Overview
Operation Guide
Alarm Management
Console Operation Guide
Troubleshooting
FAQs
EventBridge
Product Introduction
Operation Guide
Practical Tutorial
FAQs
Report Management
FAQs
General
Alarm Service
Concepts
Monitoring Charts
CVM Agents
Dynamic Alarm Threshold
CM Connection to Grafana
Documentation Guide
Related Agreements
Application Performance Management Service Level Agreement
APM Privacy Policy
APM Data Processing And Security Agreement
RUM Service Level Agreement
Mobile Performance Monitoring Service Level Agreement
Cloud Automated Testing Service Level Agreement
Prometheus Service Level Agreement
TCMG Service Level Agreements
PTS Service Level Agreement
PTS Use Limits
Cloud Monitor Service Level Agreement
API Documentation
History
Introduction
API Category
Making API Requests
Monitoring Data Query APIs
Alarm APIs
Legacy Alert APIs
Notification Template APIs
TMP APIs
Grafana Service APIs
Event Center APIs
TencentCloud Managed Service for Prometheus APIs
Monitoring APIs
Data Types
Error Codes
Glossary

Agent Self-Service Access

PDF
Focus Mode
Font Size
Last updated: 2024-08-15 16:10:55

Application Scenario

To collect services on self-built IDC, deploy Agent and manage collection configurations, and report monitoring data to the cloud TMP. For cloud services, we recommend using Integration Center, which will manage Agent, offering automated integration for multiple middlewares and scraping tasks.

Obtaining Prometheus Instance Access Configuration

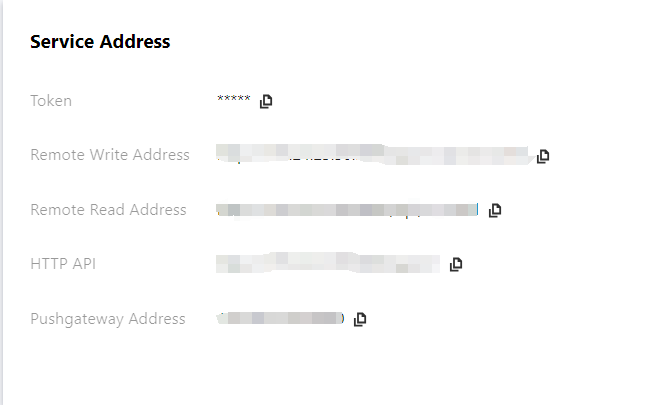
1. Go to Prometheus Monitoring Console, select the corresponding instance ID/Name, and on the Basic Info > Service Address page, obtain the Remote Write address and Token.


2. Obtain APPID on the Account Information page.

Confirming the Network Environment and Connectivity with Cloud Instances

Based on the acquired RemoteWrite address, execute the following command. If the network is connected, the returned information will include 401 Unauthorized.
curl -v -X POST ${RemoteWriteURL}

Installing and Starting vmagent

vmagent uses fewer resources and is widely used due to its compatibility with Prometheus collection configuration and Remote Write protocol. This document only describes common startup options for vmagent, managed through Systemd or Docker. For more detailed information, please see the official documentation.

Common Startup Options

-promscrape.noStaleMarkers: If the collection target disappears, a stale marker for all associated metrics is generated and written to remote storage by default. Setting this option disables this behavior and can reduce memory usage.
-loggerTimezone: The time zone for the time in logs, for example, Asia/Shanghai, Europe/Berlin or Local (UTC by default).
-remoteWrite.tmpDataPath: The file path for temporary data storage to be written after collection.
-remoteWrite.url: The URL where data is written to remote storage.
-remoteWrite.basicAuth.username: Remote storage -remoteWrite.url corresponding basic auth username.
-remoteWrite.basicAuth.password: Remote storage -remoteWrite.url corresponding basic auth password.
-promscrape.config: Path of the collection configuration, which can be a file path or HTTP URL. For more details, please see Reference Documentation.
-promscrape.configCheckInterval: Interval for checking the -promscrape.config configuration changes. For configuration updates, please see Reference Documentation.

Managing via Docker

1. On the vmagent Release Page, select the image version. It is recommended to use latest.
2. Replace the Prometheus instance information in the script and start vmagent.
mkdir /etc/prometheus
touch /etc/prometheus/scrape-config.yaml
docker run -d --name vmagent --restart always --net host -v /etc/prometheus:/etc/prometheus victoriametrics/vmagent:latest \\
-promscrape.noStaleMarkers \\
-loggerTimezone=Local \\
-remoteWrite.url="${RemoteWriteURL}" \\
-remoteWrite.basicAuth.username="${APPID}" \\
-remoteWrite.basicAuth.password='${Token}' \\
-remoteWrite.tmpDataPath=/var/lib/vmagent \\
-promscrape.config=/etc/prometheus/scrape-config.yaml \\
-promscrape.configCheckInterval=5s
3. View vmagent logs
docker ps
docker logs vmagent
If it starts normally, executing the following command will return OK.
curl localhost:8429/health

Managing via Systemd

1. On the vmagent Release page, download the corresponding vmutils-* compressed package according to your operating system and CPU architecture, and decompress it.
2. Replace the access information of the Prometheus instance in the script and start vmagent.
mkdir /etc/prometheus
touch /etc/prometheus/scrape-config.yaml
cat >/usr/lib/systemd/system/vmagent.service <<EOF
[Unit]
Description=VictoriaMetrics Agent
After=network.target

[Service]
LimitNOFILE=10240
ExecStart=/usr/bin/vmagent \\
-promscrape.noStaleMarkers \\
-loggerTimezone=Local \\
-remoteWrite.url="${RemoteWriteURL}" \\
-remoteWrite.basicAuth.username="${APPID}" \\
-remoteWrite.basicAuth.password="${Token}" \\
-remoteWrite.tmpDataPath=/var/lib/vmagent \\
-promscrape.config=/etc/prometheus/scrape-config.yaml \\
-promscrape.configCheckInterval=5s
Restart=always
RestartSec=10s

[Install]
WantedBy=multi-user.target
EOF
systemctl daemon-reload
systemctl enable vmagent
systemctl start vmagent
sleep 3
systemctl status vmagent
3. View logs
journalctl -u vmagent
If it starts normally, executing the following command will return OK.
curl localhost:8429/health

Managing the Configuration

Modifying the Configuration File

Edit the collection configuration file /etc/prometheus/scrape-config.yaml to add/update/delete collection tasks. For Prometheus collection task configuration, see Official Documentation.
global:
scrape_interval: 30s
scrape_configs:
- job_name: agent-monitor
static_configs:
- targets:
- localhost:8429
After the configuration is modified, it will only take effect after the time set by the option -promscrape.configCheckInterval.

Viewing Monitoring Target Information

Execute the following command to view the collection target and check whether the configuration is effective and meets expectations.
curl localhost:8429/api/v1/targets


Help and Support

Was this page helpful?

Help us improve! Rate your documentation experience in 5 mins.

Feedback