Traffic
Download
Focus Mode
Font Size
This article introduces the overview, configuration, and usage of features in the traffic monitoring module for Android and iOS platforms.
Android
Feature Background
The core feature of traffic monitoring is its ability to track application data usage in real time. Through real-time monitoring, you can stay informed about data consumption patterns and promptly identify issues such as unexpected traffic usage. This helps you avoid exceeding data plans or incurring additional charges. Additionally, traffic monitoring assists in optimizing application power consumption and reducing unnecessary data requests to deliver a more efficient user experience and extend the battery life. This feature also enables drilling down to the domain level, allowing you to identify which domains or services consume a large amount of traffic, facilitating targeted measures to optimize data transmission.
Open configuration
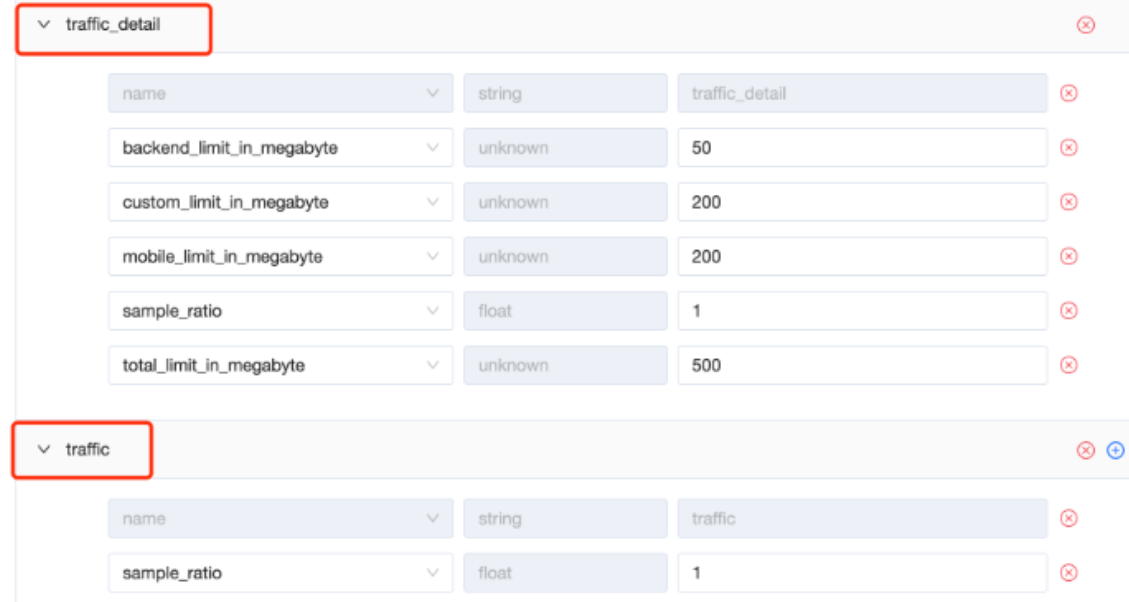
traffic: refers to the per-process traffic, for which the device sampling rate can be configured.
traffic_detail: refers to the 10-minute traffic, for which the device sampling rate and the threshold for abnormal traffic can be configured.
The unit for these traffic thresholds is MB.
During the integration phase, it is recommended to set both device sampling rates (sample_ratio) to 1.0, i.e., full sampling.
Parameter | Configuration field name | Description |
Total traffic is excessive. | total_limit_in_megabyte | The traffic consumed within 10 minutes exceeds the configured threshold for abnormal traffic. |
Background traffic is excessive. | backend_limit_in_megabyte | The traffic consumed in the background scenario within 10 minutes exceeds the configured threshold for background abnormal traffic. |
Mobile traffic is excessive. | mobile_limit_in_megabyte | The mobile traffic consumed within 10 minutes exceeds the configured threshold for abnormal mobile traffic. |
Custom scenario traffic is excessive. | custom_limit_in_megabyte | The custom scenario defined by the business checks whether the traffic consumption exceeds the defined threshold. |
SDK Integration
The integration approach for traffic monitoring is not significantly different from other features such as lag, Java memory leaks, etc. The monitoring capabilities of the SDK are generally jointly controlled by the client and backend configuration. That is, the client must execute the following statement during initialization while enabling the traffic monitoring feature in the backend configuration to activate it.
RumProBuilder.addMonitor(RumProMonitorName.TRAFFIC);RumProBuilder.addMonitor(RumProMonitorName.TRAFFIC_DETAIL);RumPro.init(application, RumProBuilder);
Enable success logs
12-20 16:13:27.470 21408 21449 I TrafficMonitor: traffic monitor start
Report logs
1. Traffic report logs every 10 minutes (reported every 10 minutes).04-22 01:04:26.665 17704 17758 D RMonitor_report_Json: url: ********************** eventName: traffic_detail, client_identify: ****6415c412a9ed43cd0f43d601****2. Process traffic metrics report logs (reported 5 minutes after process restart).04-22 01:04:26.665 17704 17758 D RMonitor_report_Json: url: ********************* eventName: traffic, client_identify: *****415c412a9ed43cd0f43*****
Custom Scenario Traffic Reporting API
CustomTrafficStatistic.getInstance().addHttpToQueue(SocketInfo socketInfo);
SocketInfo contains many other fields. To collect traffic statistics, you need to assign values only to the following fields. Other member variables can be ignored.
class SocketInfo {receivedBytes; // Bytes received.sendBytes; // Bytes sent.networkType; // Network type. Set to 1 for Wi-Fi traffic, 2 for 5G traffic, or 3 for no network.frontState; // Foreground and background state. Set to 1 for foreground, or 2 for background.host; // Domain name, such as www.baidu.com.startTimeStamp; // Timestamp when the network request starts, in milliseconds.......}
iOS
Feature Background
The core feature of traffic monitoring is its ability to track application data usage in real time. Through real-time monitoring, you can stay informed about data consumption patterns and promptly identify issues such as unexpected traffic usage. This helps you avoid exceeding data plans or incurring additional charges. Additionally, traffic monitoring assists in optimizing application power consumption and reducing unnecessary data requests to deliver a more efficient user experience and extend the battery life. This feature also enables drilling down to the domain level, allowing you to identify which domains or services consume a large amount of traffic, facilitating targeted measures to optimize data transmission.
Open configuration
To enable traffic monitoring, you must also ensure that the traffic monitoring module is enabled in the SDK configuration. For details about the SDK configuration, refer to SDK Configuration.
For the traffic monitoring configuration, which is consistent with the Android version, refer to Android Traffic Monitoring Configuration for reference.
SDK Integration
Traffic monitoring is a submodule of the SDK and does not require separate integration by the business. Simply upgrade to a supported SDK version to include the corresponding module. Therefore, when initializing the SDK, ensure that the enabled modules include RumPro_MODULE_NETWORK or use the RM_MODULE_ALL type. For details, refer to SDK Initialization.
Note:
Traffic monitoring requires version 2.7.53 or later.
Traffic Monitoring Enablement Verification
After you have successfully started the traffic monitoring feature, the following log indicates that the traffic monitoring feature is enabled:
[RumPro][Event][RumProNetworkMonitor.mm:281]RumPro_MODUEL_NETWORK start network monitor: 1048576, 1048576, 1048576
Traffic monitoring reports process traffic or 10-minute traffic when the process starts and every 10 minutes. When reporting is triggered, the following log appears:
[RumPro][Event][RMReportQueue.m:601][Report] [resource.traffic] report id:xxxx error:(null)// or[RumPro][Event][RMReportQueue.m:601][Report] [resource.traffic_detail] report id:xxxx error:(null)
Custom API
By default, the SDK monitors all traffic within the App, including HTTP network requests made via NSURLSession and TCP network requests made via BSD Socket.
However, due to the limitations of BSD Socket, the monitoring information can only provide IP and port details. To offer more flexibility in network traffic monitoring, RUM Pro provides a custom network monitoring API.
In RumProNetworkTracer+Public.h and RumPro_network_tracer.hpp, interfaces for custom network traffic monitoring are defined for invocation at the Objective-C layer or C++ layer, respectively, to implement custom network traffic monitoring.
Calling the traceConnectComplete API of the tracer object automatically records the traffic monitoring information captured by this tracer to the SDK and reports it.
Note:
Due to identified issues with network monitoring on iOS 12.0 and earlier systems, starting from version 2.7.55.1, network monitoring no longer supports devices running iOS 12.0 or earlier, but only supports iOS 13.0 and later systems.
For example:
NSString *peerName = @"..."; // Connection URL and other informationRumProNetworkTracer *tracer = [RumProNetworkTracer tracerWithPeerName:peerNametype:RumProNetworkConnectHTTP|RumProNetworkConnectCustom];// This method injects the tracer object into the _self object. In asynchronous processing scenarios, injecting it into the context object facilitates later retrieval.[tracer injectToObj:_self];// The connection starts.[tracer traceConnectStart];// Record connection sending data[tracer traceConnectSend:request.HTTPBody.length];// ... other logic// This method retrieves the tracer object from the registered objects via the context object.RumProNetworkTracer *tracer = [RumProNetworkTracer tracerFromObj:_self];// The tracer completes and records itself to the SDK.[tracer traceConnectComplete];
The usage of other APIs is similar. For details, refer to the definitions in the file.
Usage of Feature
The following content uses the Android platform's traffic monitoring module as an example for explanation. For iOS, refer to the content below.
Metric Analysis
The metrics analysis includes three Tabs: Per-process traffic, 10-minute traffic, and Custom scenario traffic.
Single process traffic: Refers to all traffic consumed by a process during a single execution.
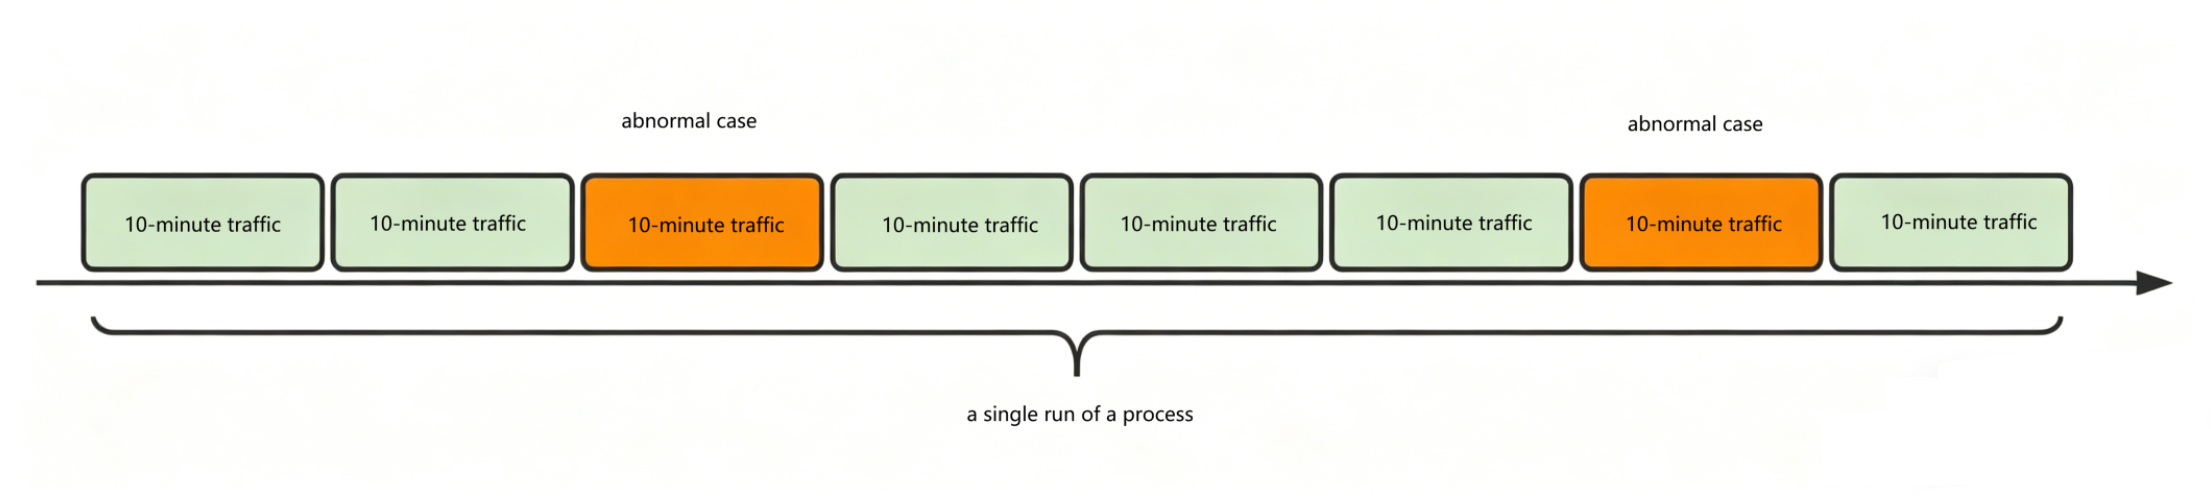
10-minute traffic: Describes all traffic consumed by sampled devices during a 10-minute monitoring period.
custom scene traffic: Describes either per-process traffic or 10-minute traffic within business-critical scenarios.
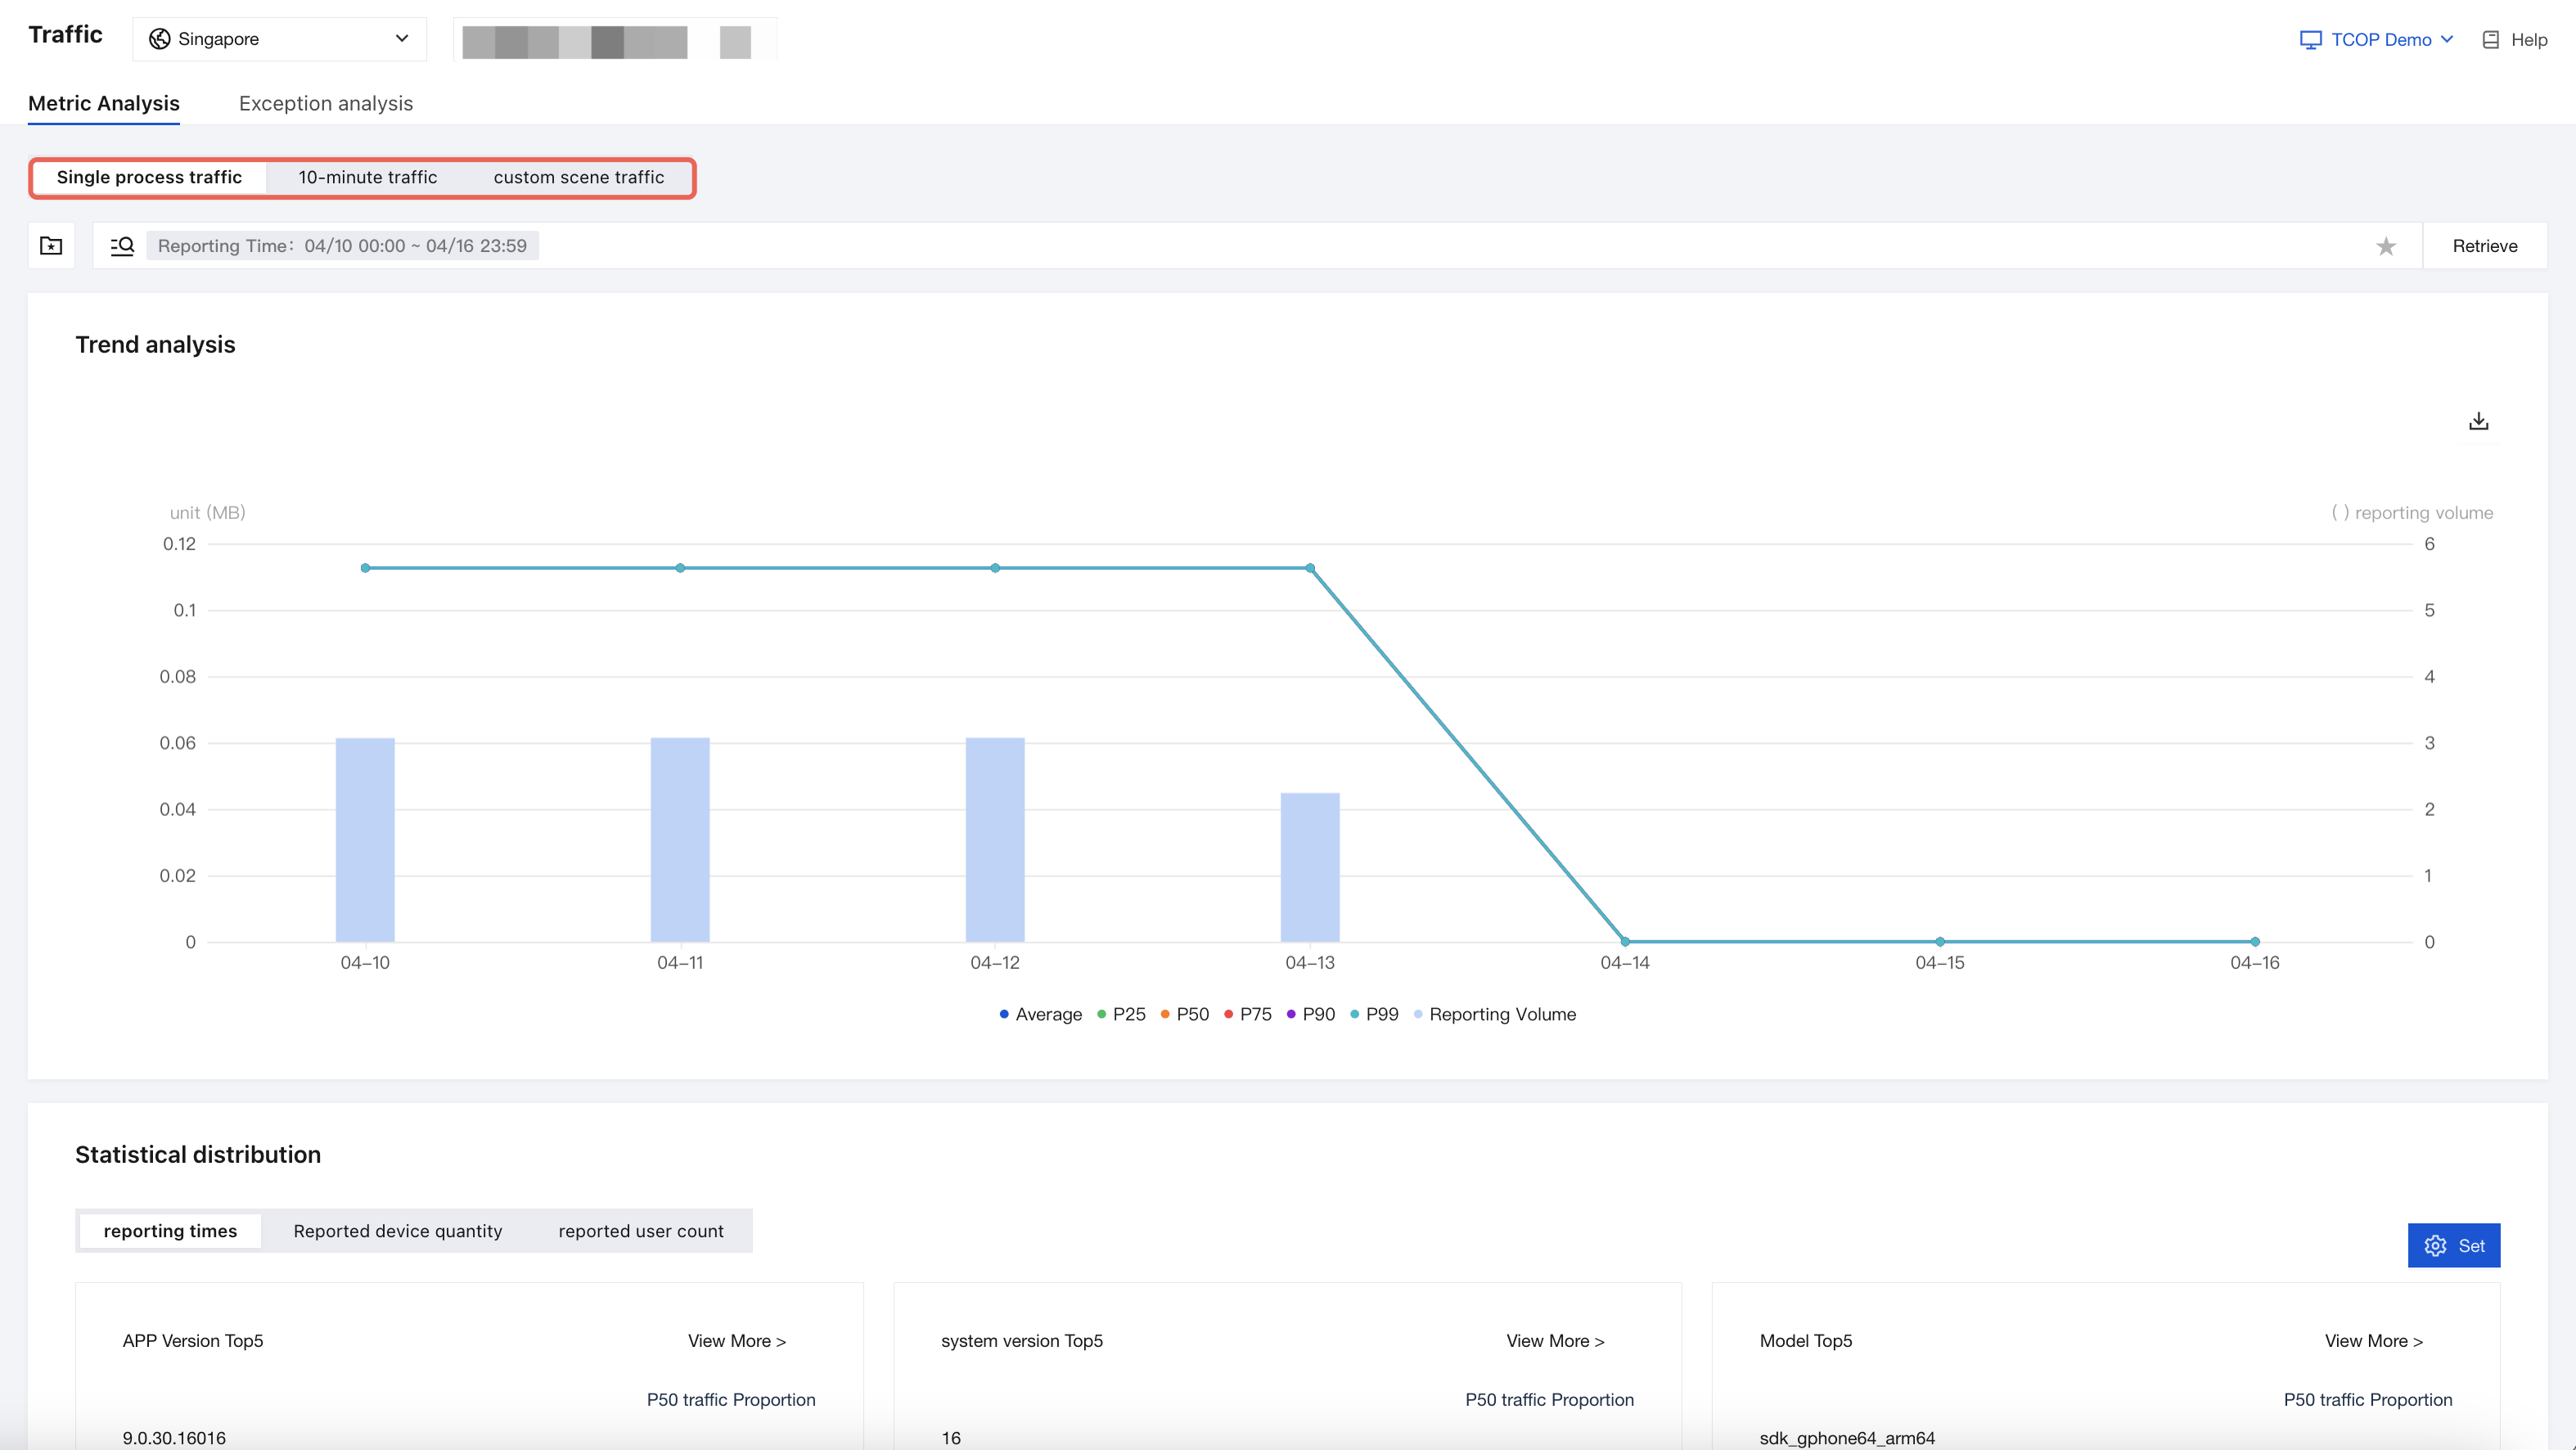
The metrics of all three Tabs include trend analysis, statistical distribution, and traffic attribution.
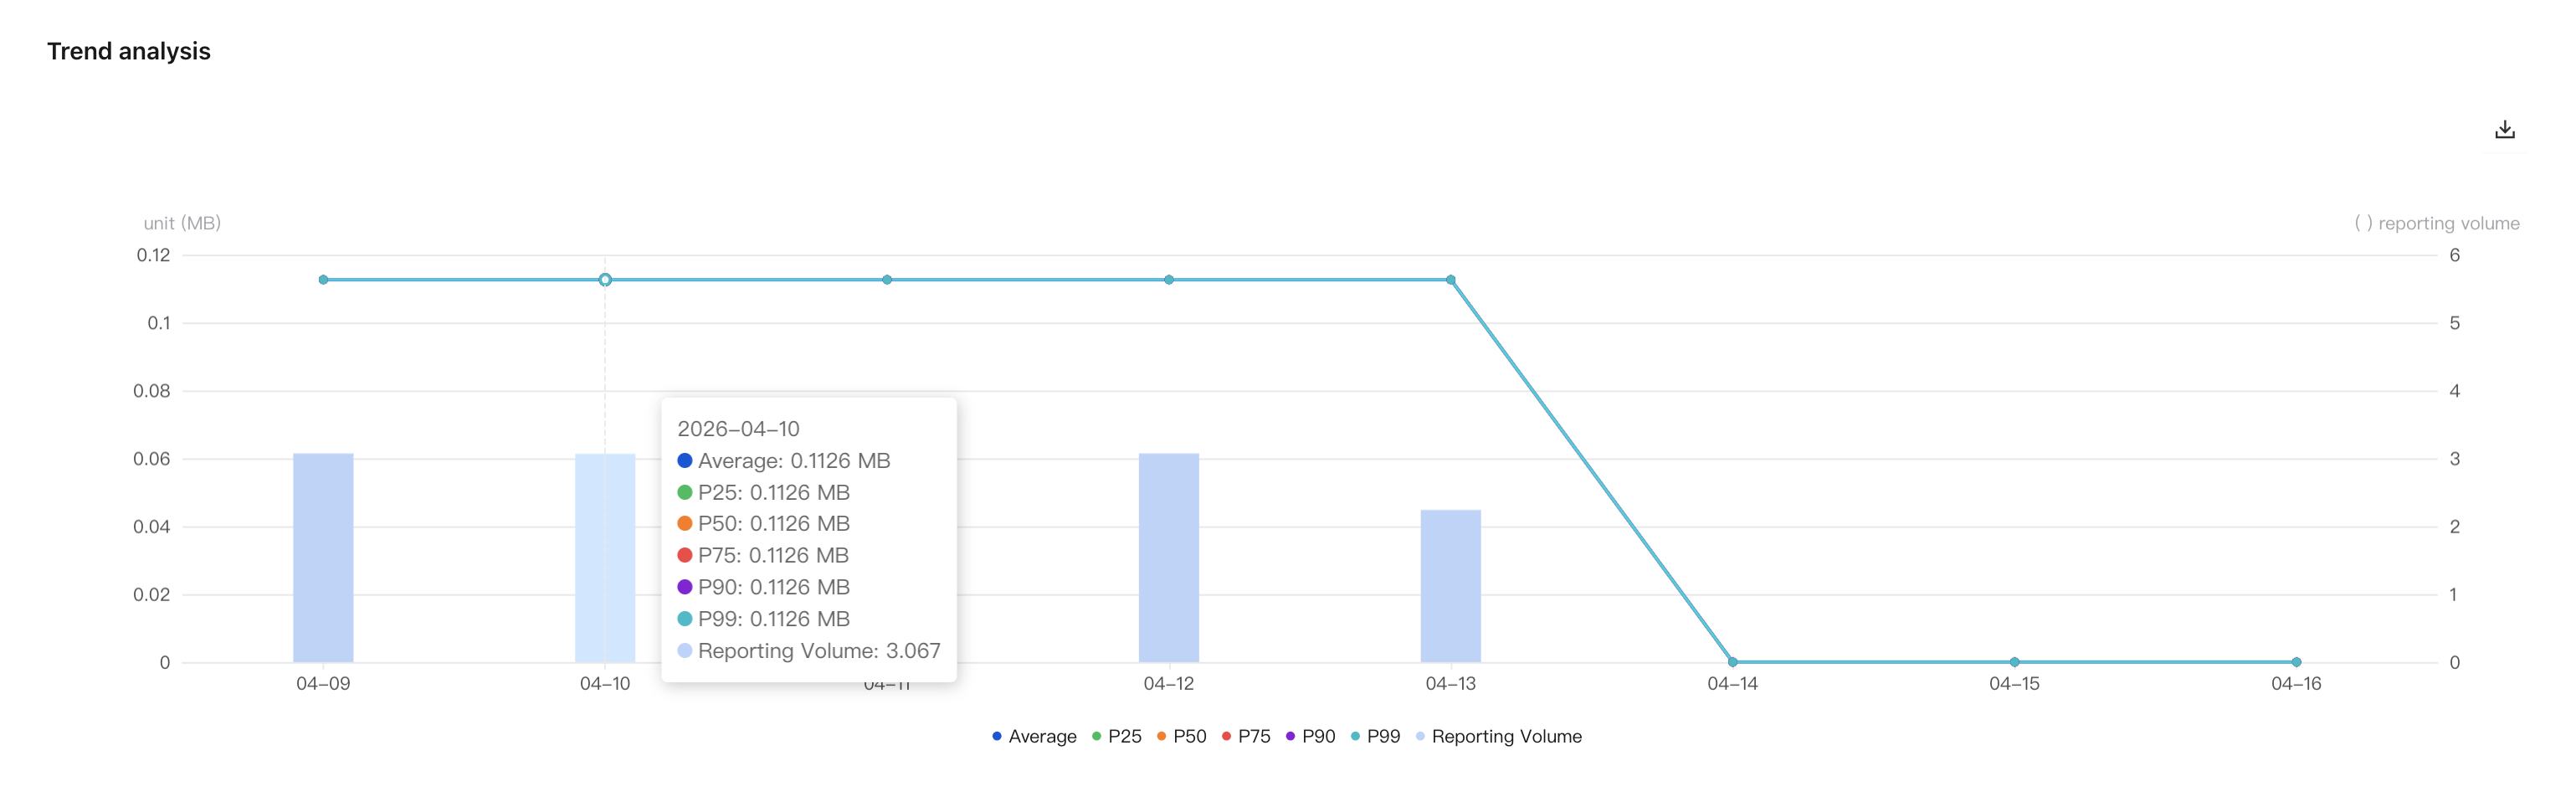
Whether it is per-process traffic or 10-minute traffic, each report counts as one sample.
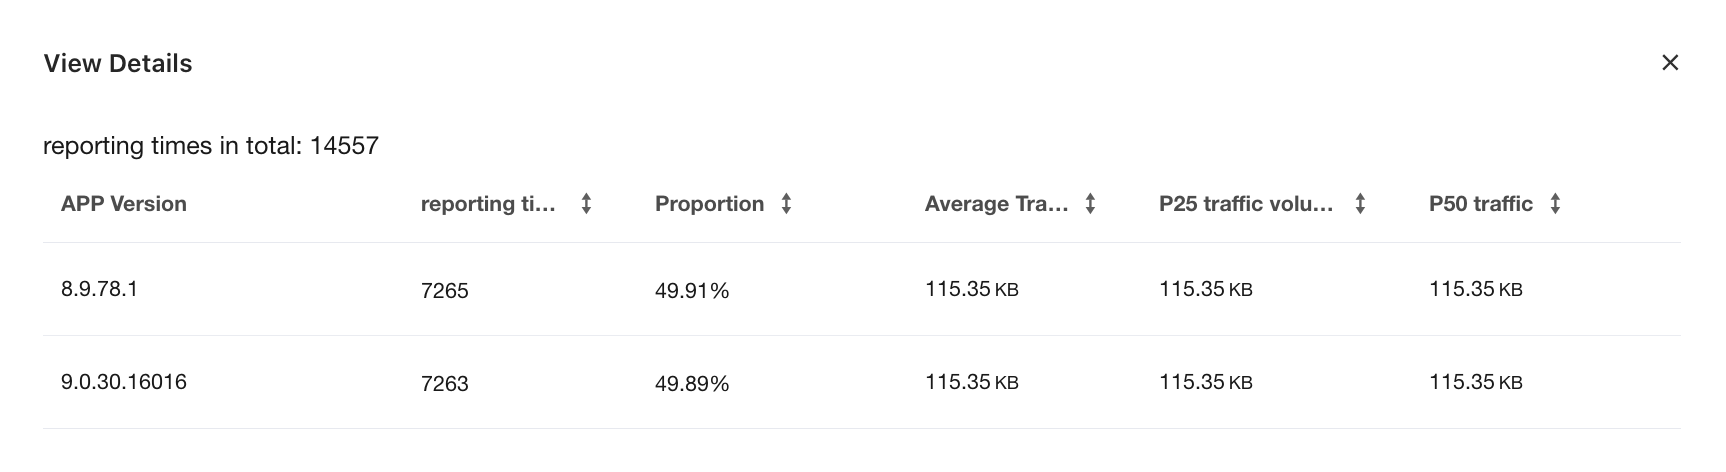
Reporting Volume represents the sample size. As shown below, the Reporting Volume is 106,857, indicating a total of 106,857 reports. The average and percentile values such as P25 are calculated based on these reported samples.
Statistical distribution shows the distribution of these samples across specified dimensions.
The distribution by App version shows that version 8.9.78.1 has the highest number of reported samples, accounting for 49.91%.
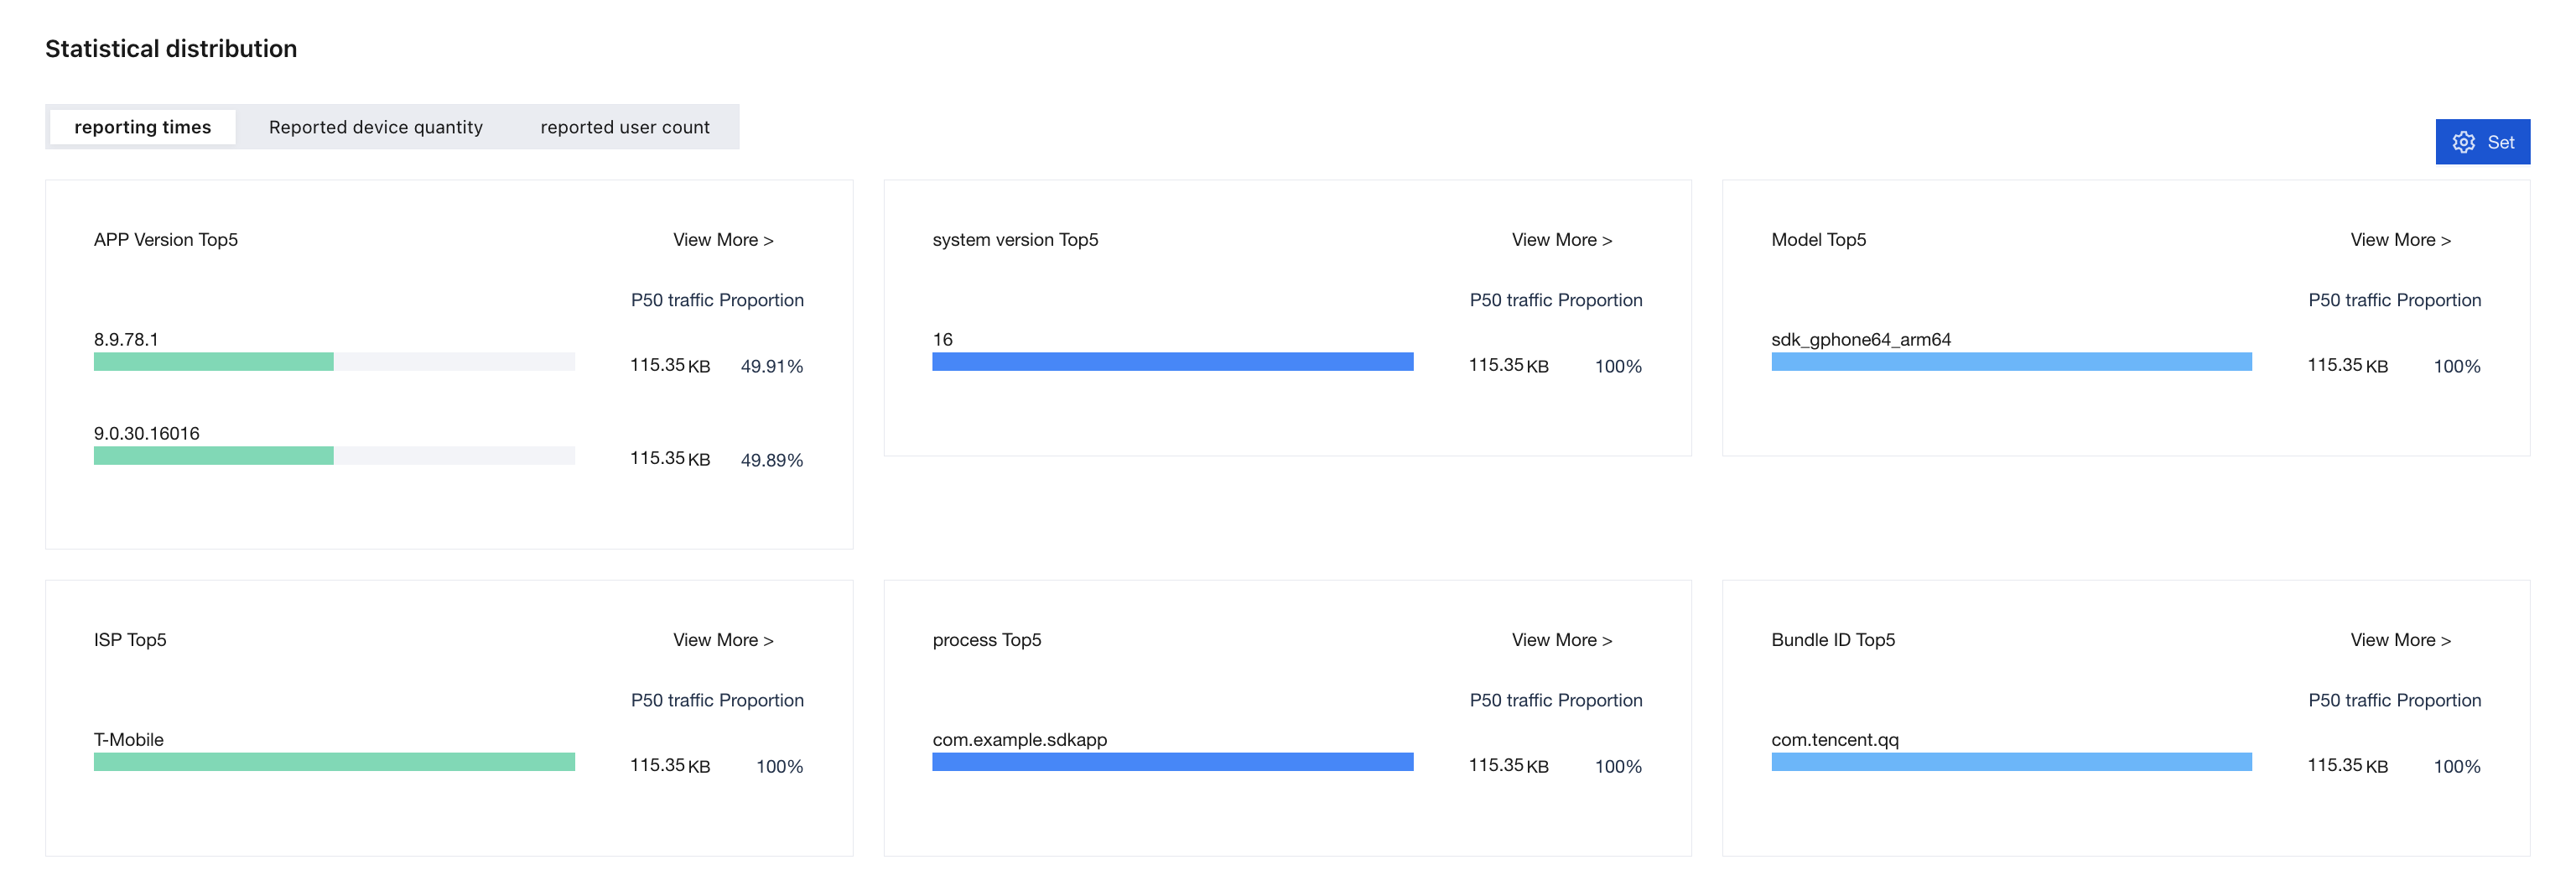
Click View More to view the reporting details.
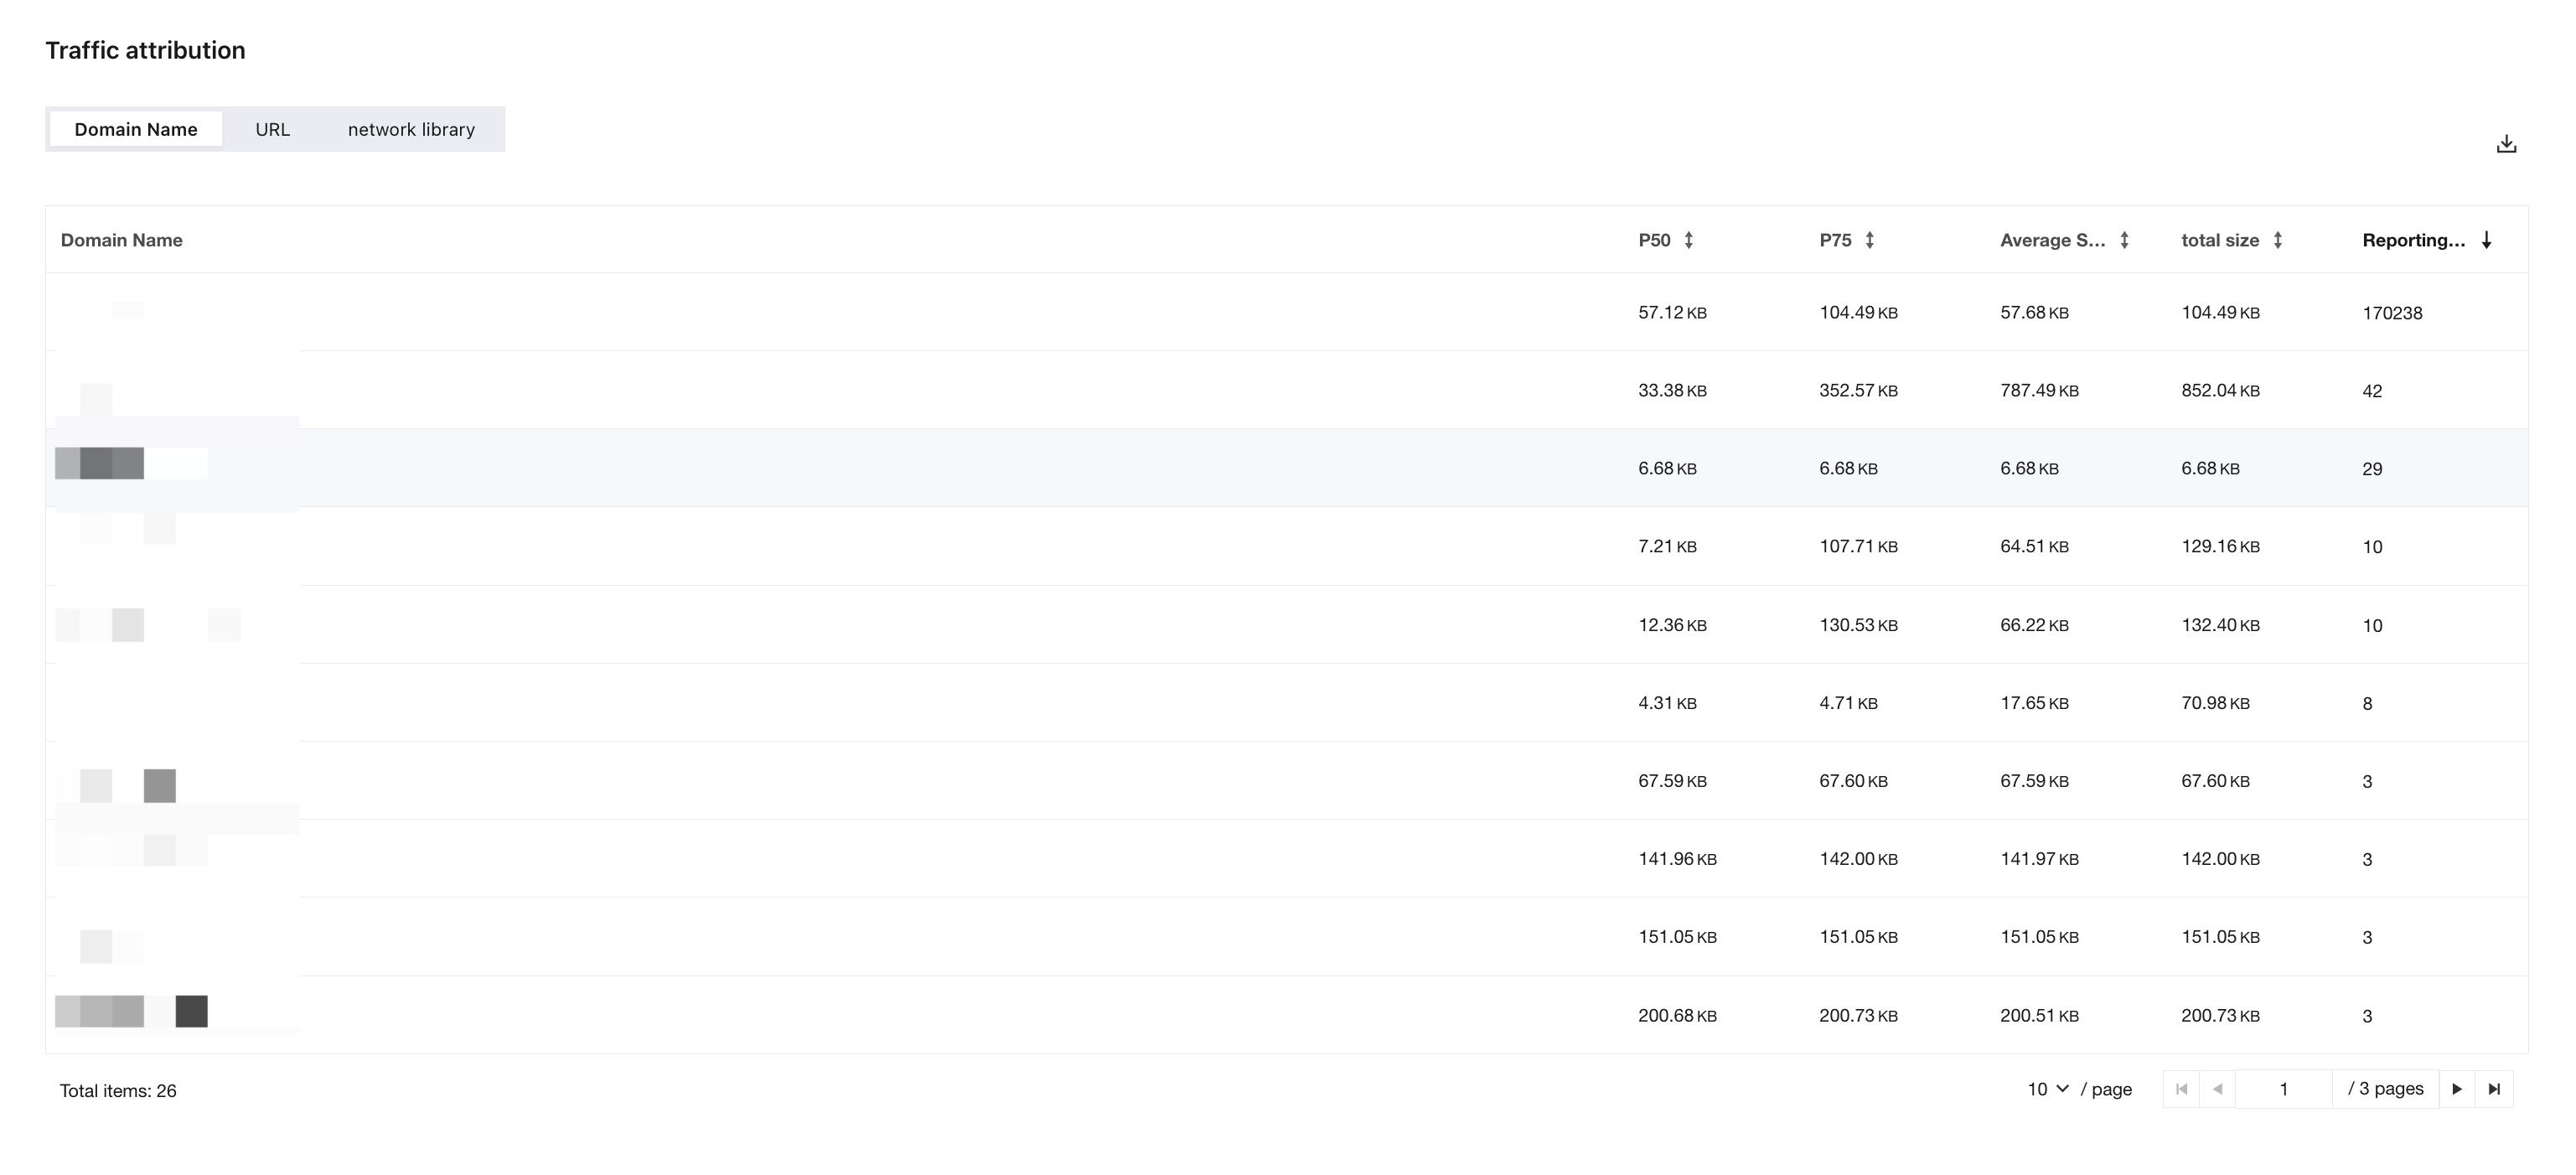
Traffic Attribution currently supports domains, URLs, and network libraries.
Exception analysis
During the statistical period, if traffic consumption exceeds the configured threshold, it is determined that an abnormal situation will occur.
After an exception is detected, detailed connection information is collected and reported to the backend. Users can configure their own exception detection thresholds.
Parameter | Configuration field name | Description |
Total traffic is excessive. | total_limit_in_megabyte | The traffic consumed within 10 minutes exceeds the configured threshold for abnormal traffic. |
Background traffic is excessive. | backend_limit_in_megabyte | The traffic consumed in the background scenario within 10 minutes exceeds the configured threshold for background abnormal traffic. |
Mobile traffic is excessive. | mobile_limit_in_megabyte | The mobile traffic consumed within 10 minutes exceeds the configured threshold for abnormal mobile traffic. |
Custom scenario traffic is excessive. | custom_limit_in_megabyte | The custom scenario defined by the business checks whether the traffic consumption exceeds the defined threshold. |
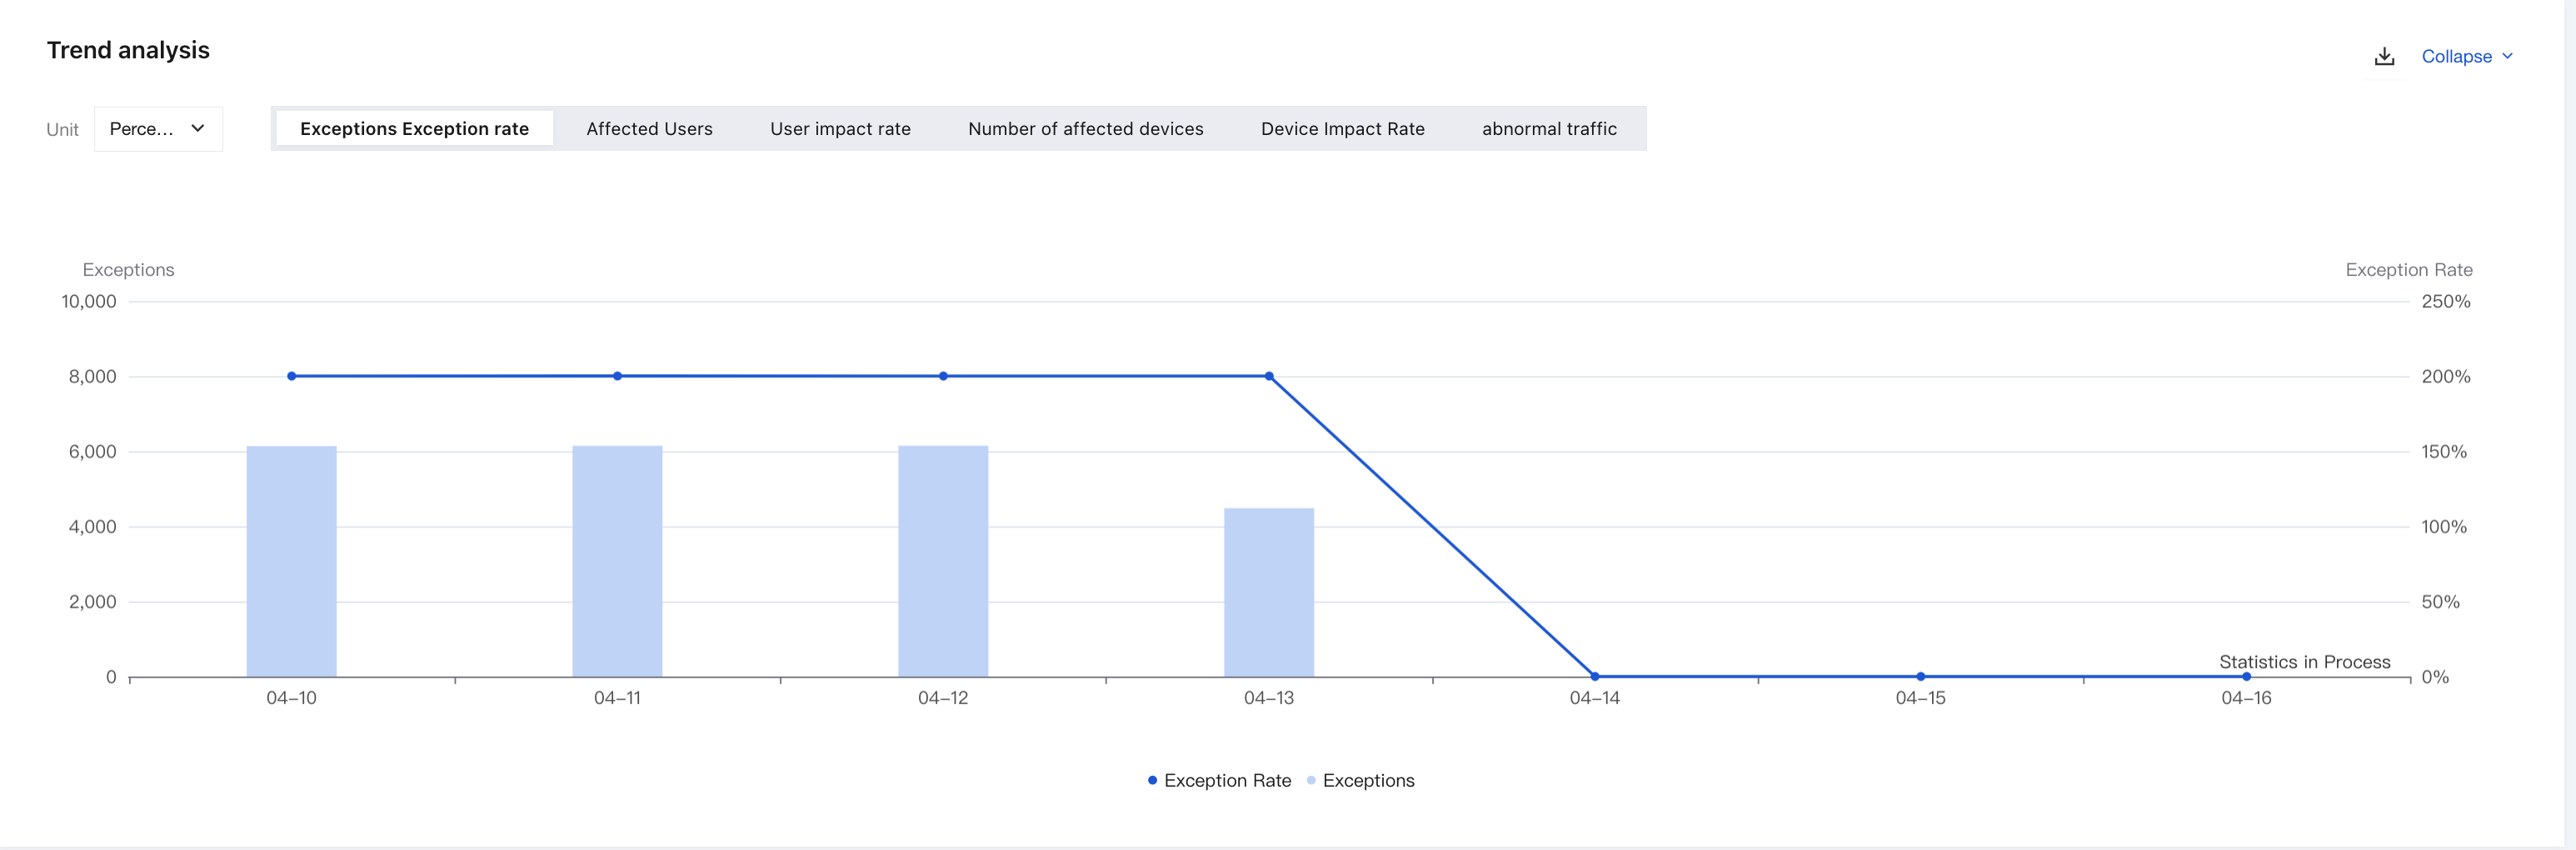
The Abnormal Analysis page displays abnormal metrics and trends.
In abnormal metrics, the numerator represents the reported abnormal instances, while the denominator is the reported sample size of the 10-minute traffic.
The currently defined abnormalities are all based on the results of 10-minute traffic statistics.
Metric | Description |
Exceptions | Reported volume of abnormal traffic under filter conditions. |
Exception rate | Reported volume of abnormal traffic under filter conditions / Total reported sampling volume under filter conditions (10min, only supports time range + App version). |
Affected Users | Affected users of abnormal traffic under filter conditions. |
User impact rate | Affected users of abnormal traffic under filter conditions / Total reported users under filter conditions (10min). |
Number of affected devices | Affected devices of abnormal traffic under filter conditions. |
Device Impact Rate | Affected devices of abnormal traffic under filter conditions / Total reported devices under filter conditions (10min). |
After selecting filter conditions, users can view exception cases that meet the conditions.
Users can sort exception cases by dimensions such as abnormal traffic or collection time to locate desired cases for analysis.
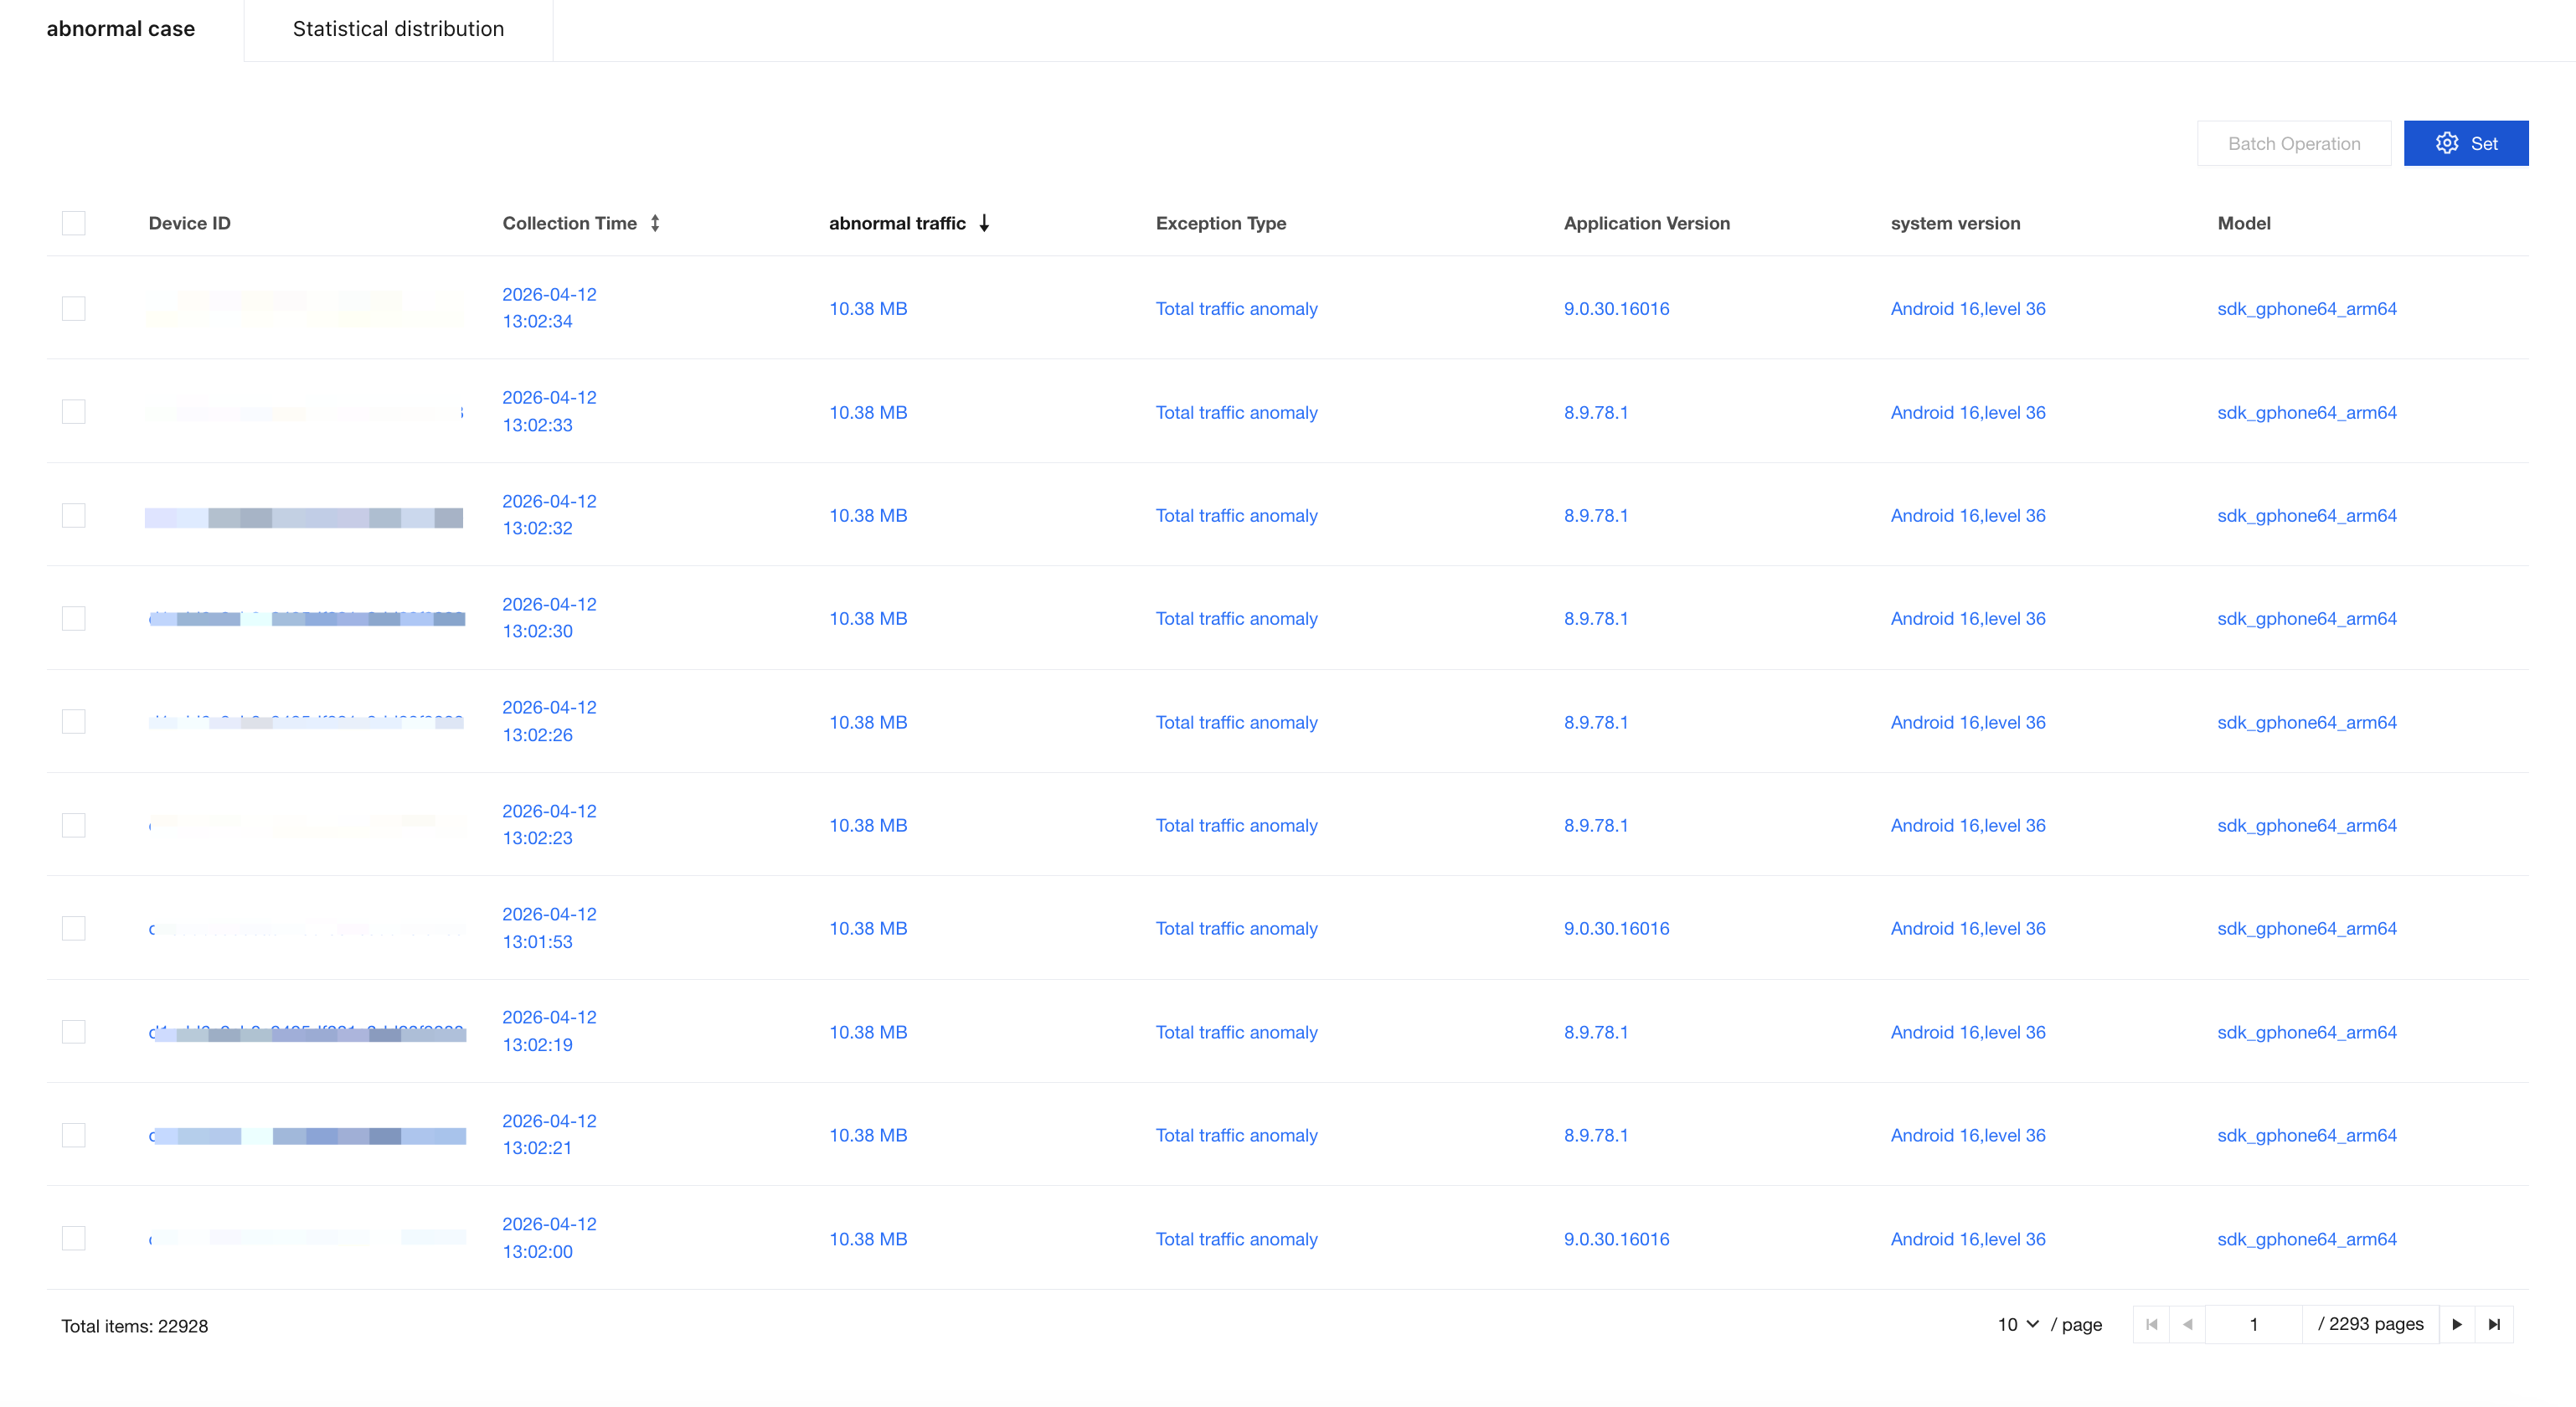
Click an exception case to go to its details and view the connection details.
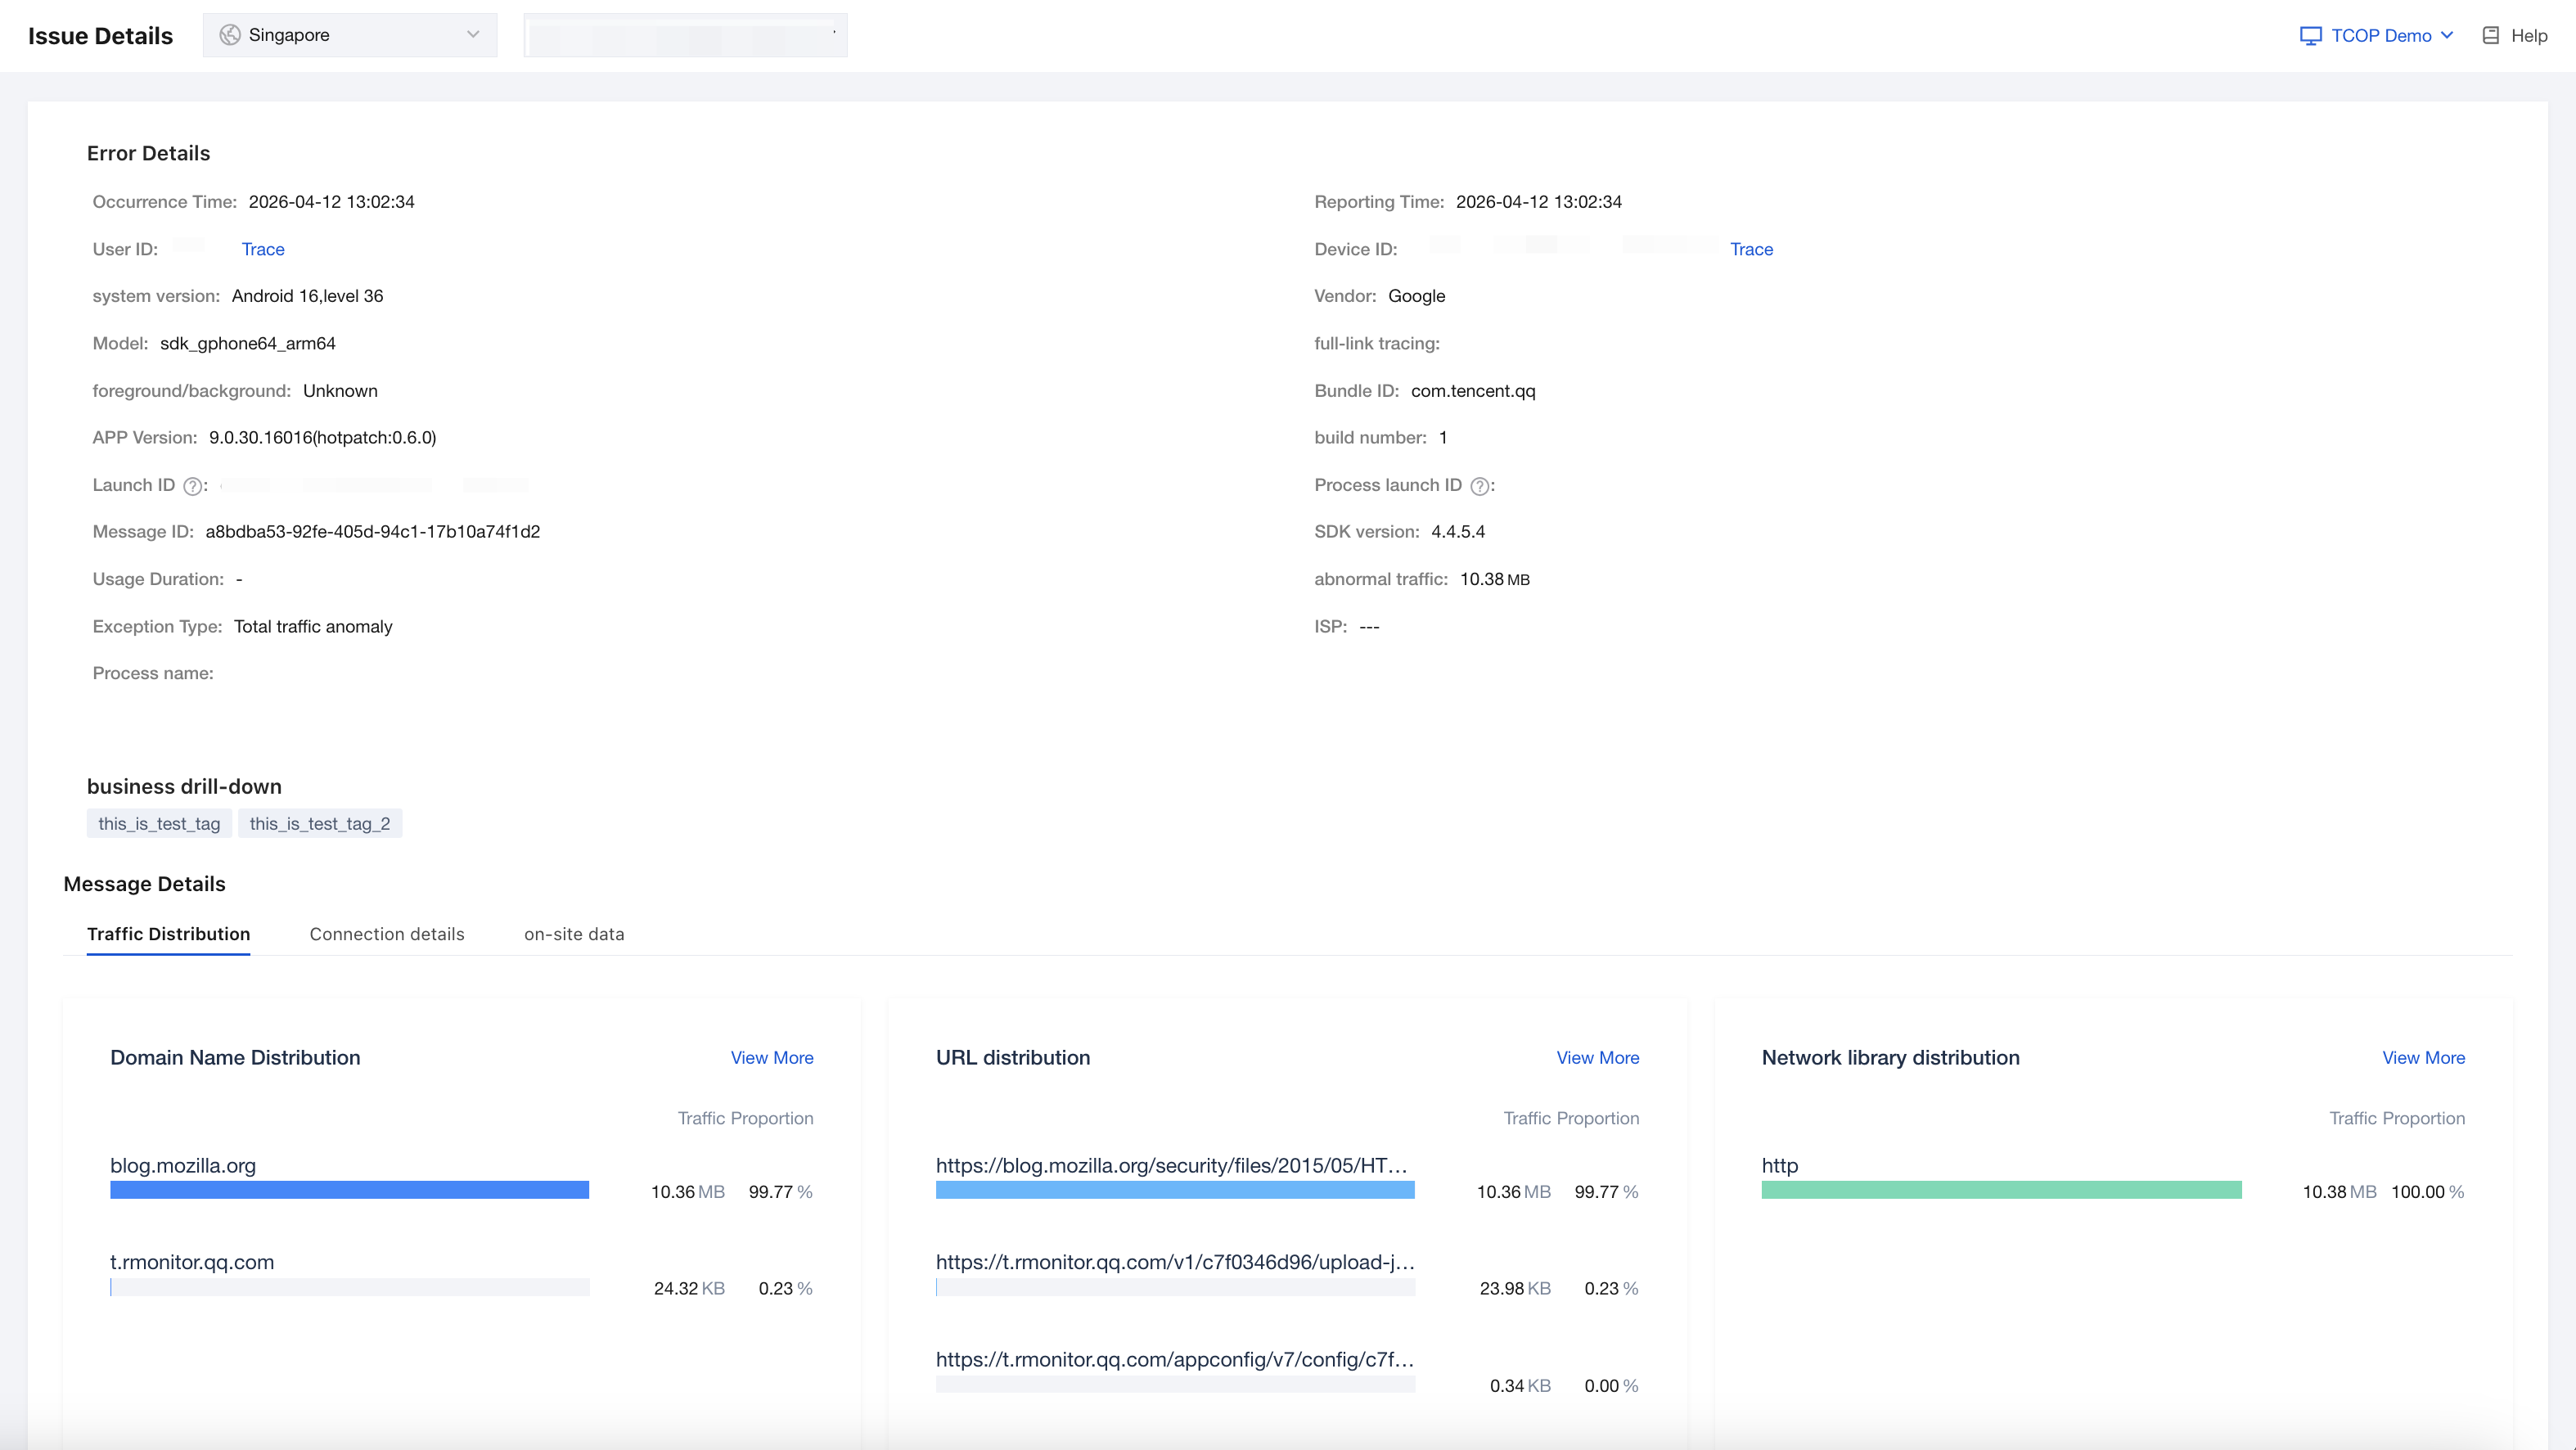
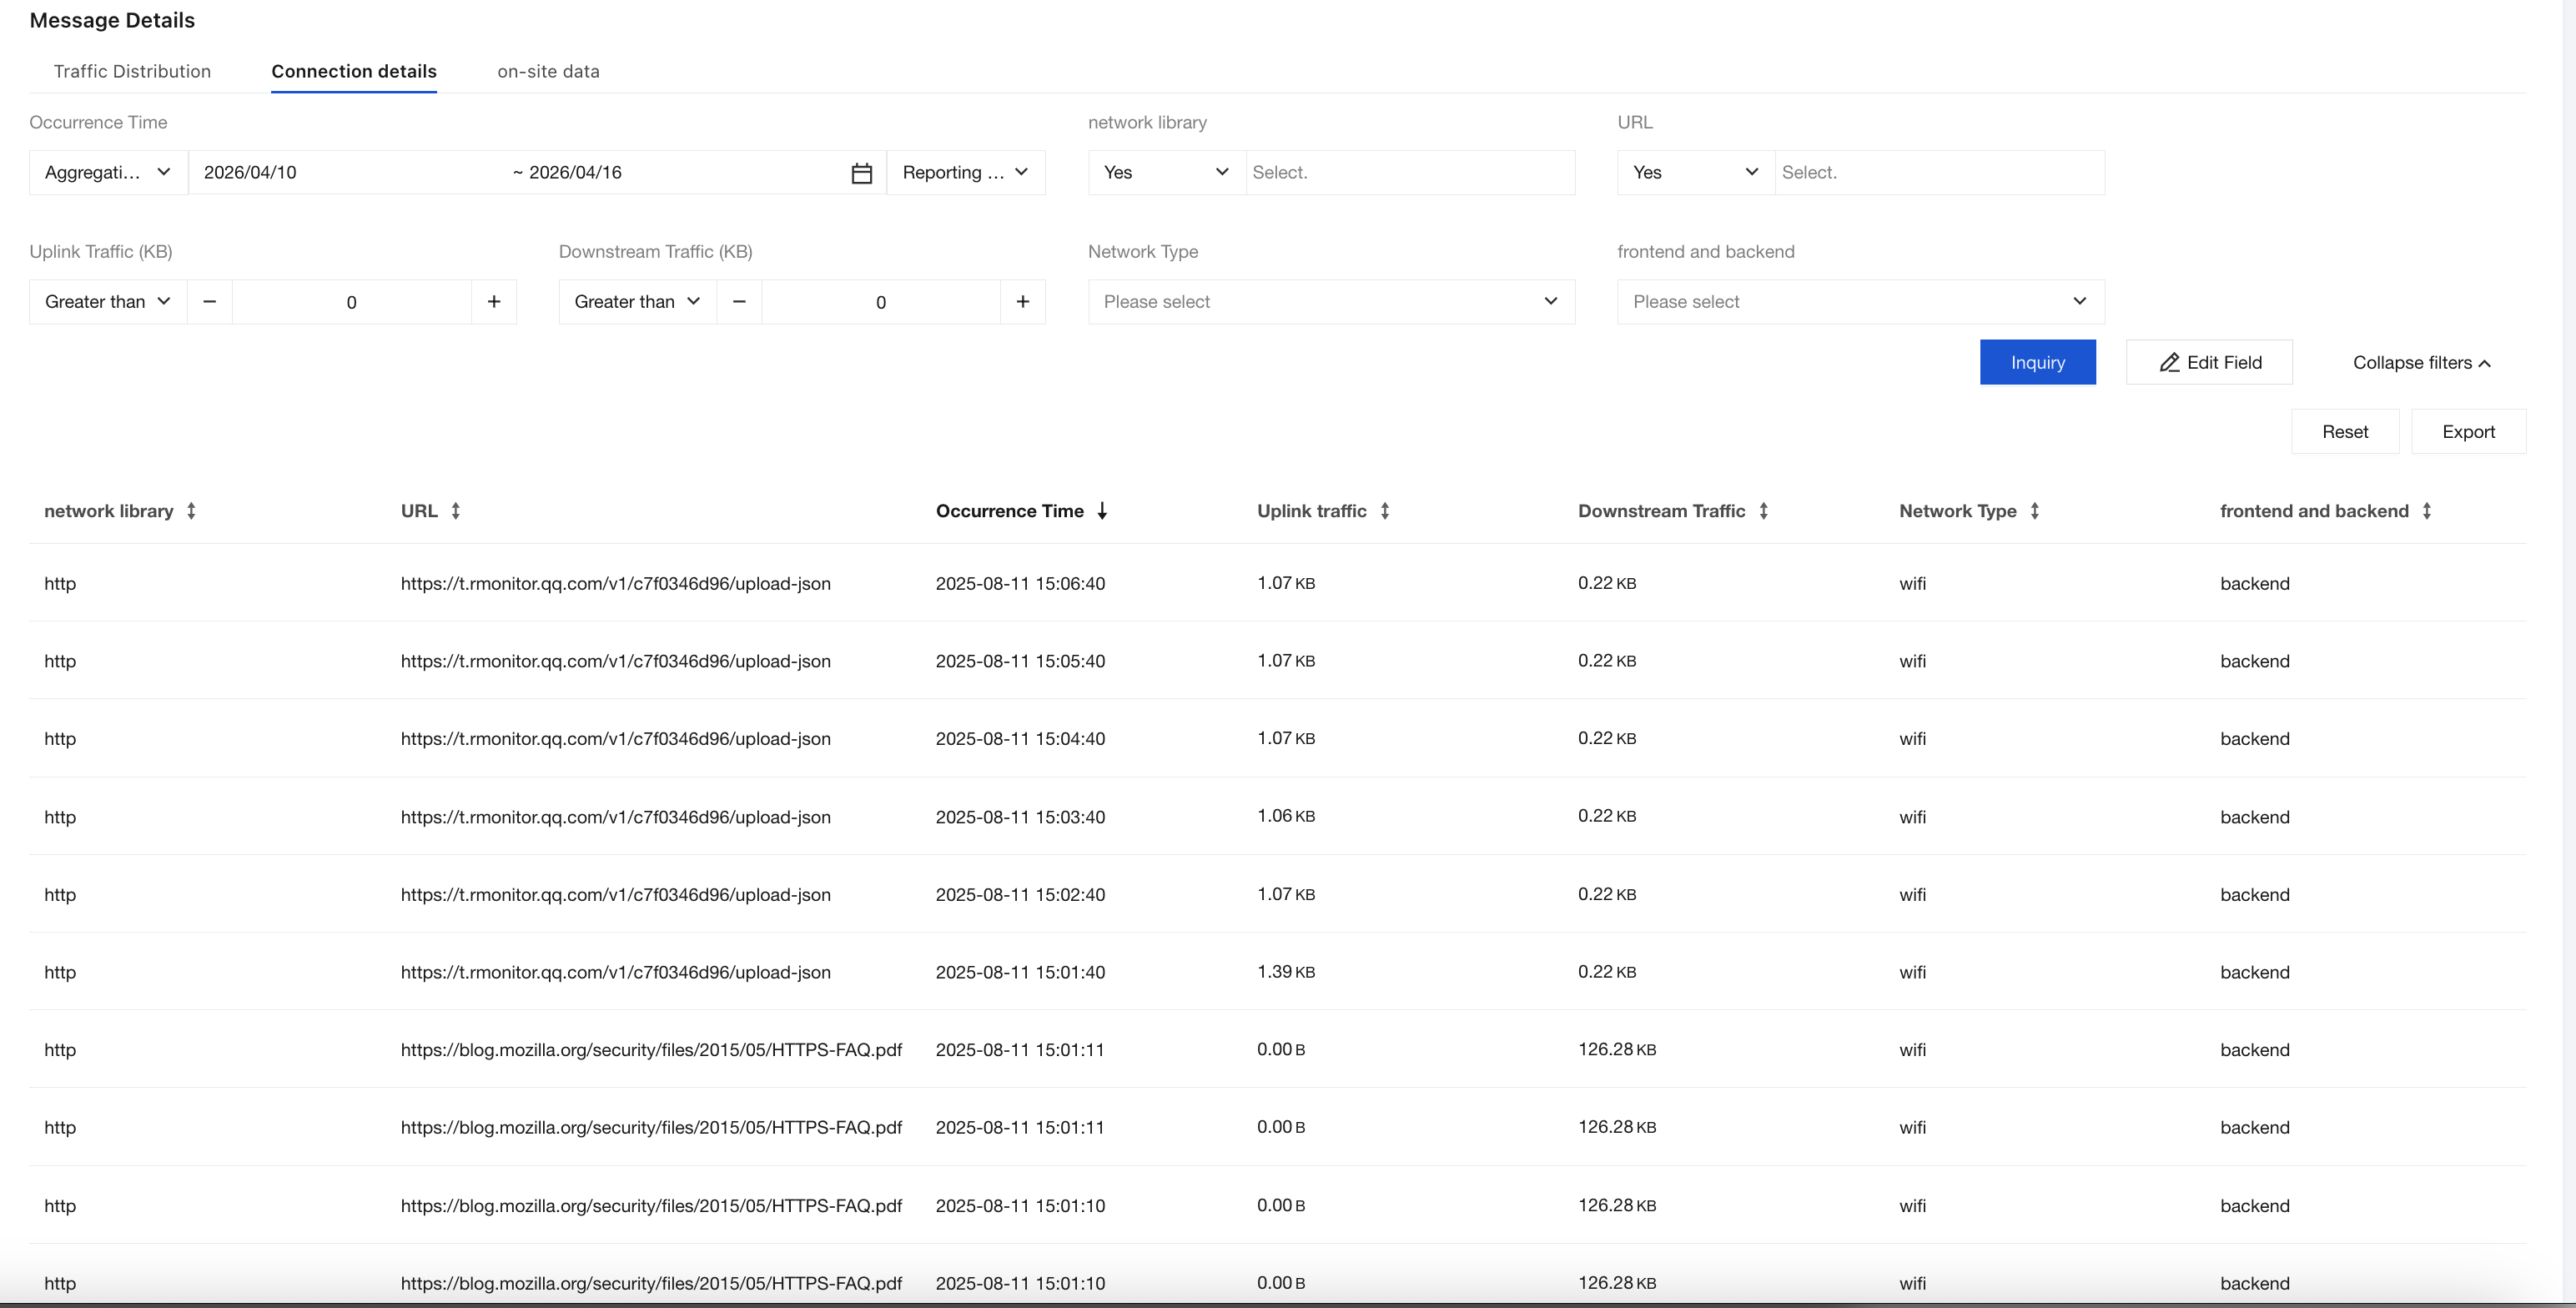
The connection details in the case details display the traffic consumption details of each monitored connection within this statistical period.
Traffic attribution
Whether it's metric analysis or abnormal analysis, both include traffic attribution.
Metric Analysis:
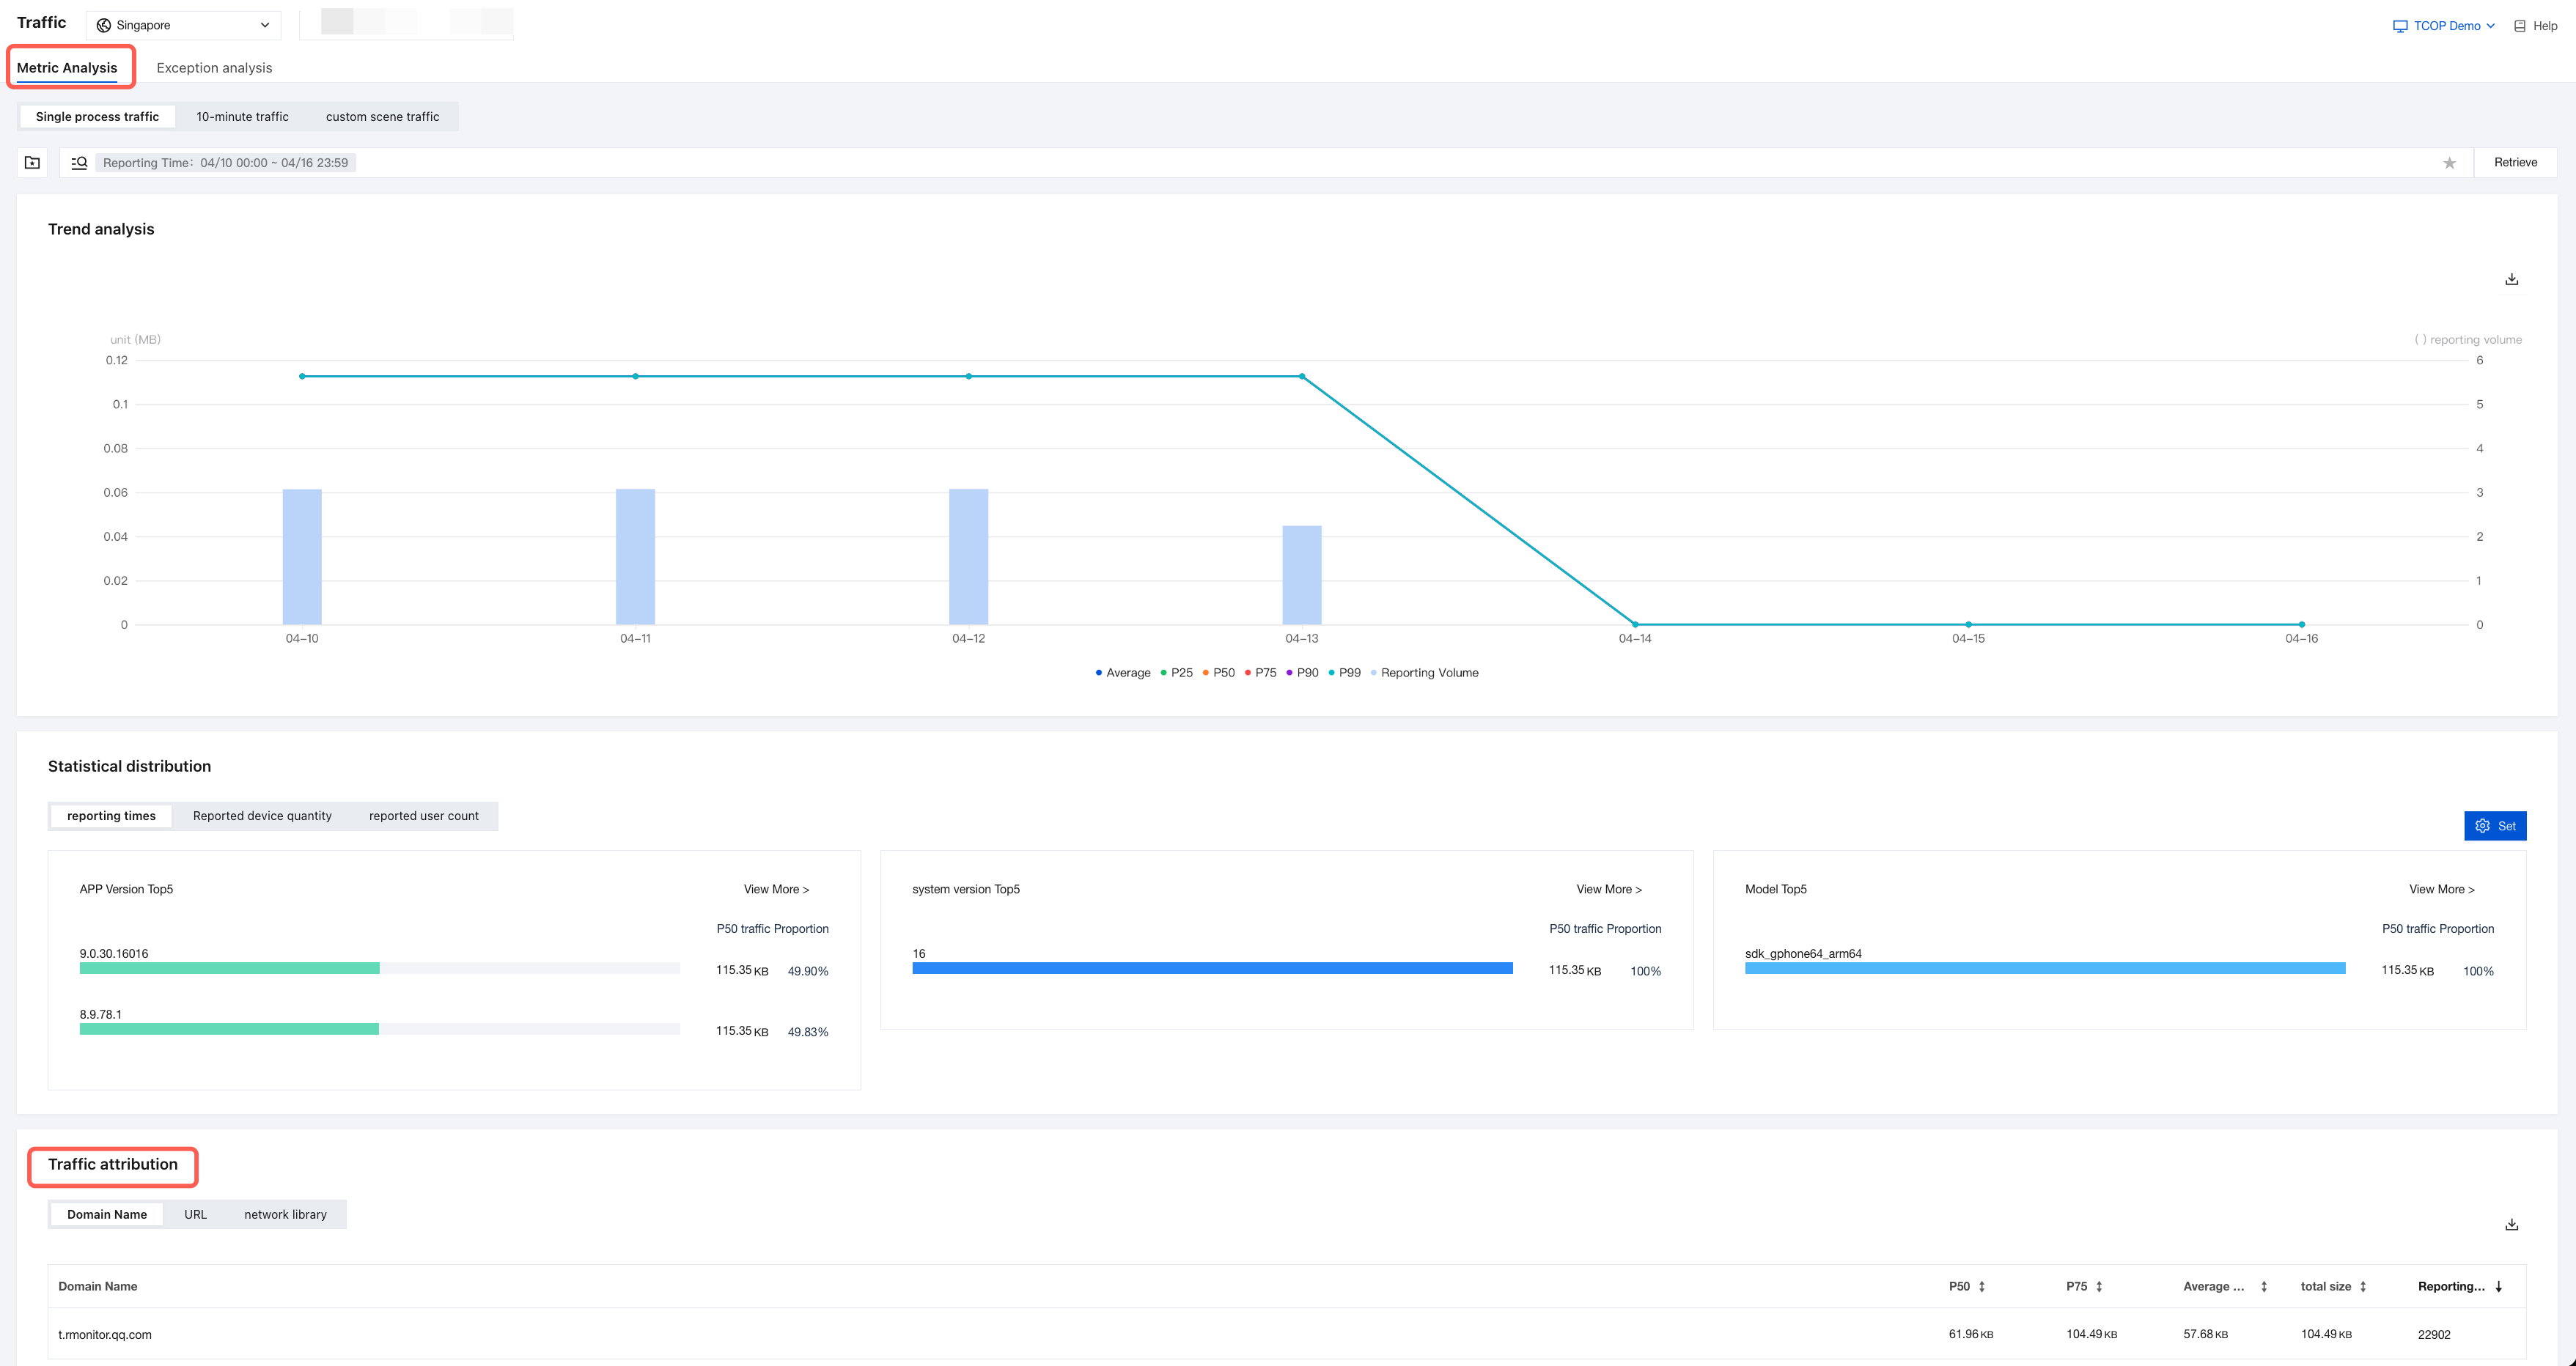
Exception Analysis:
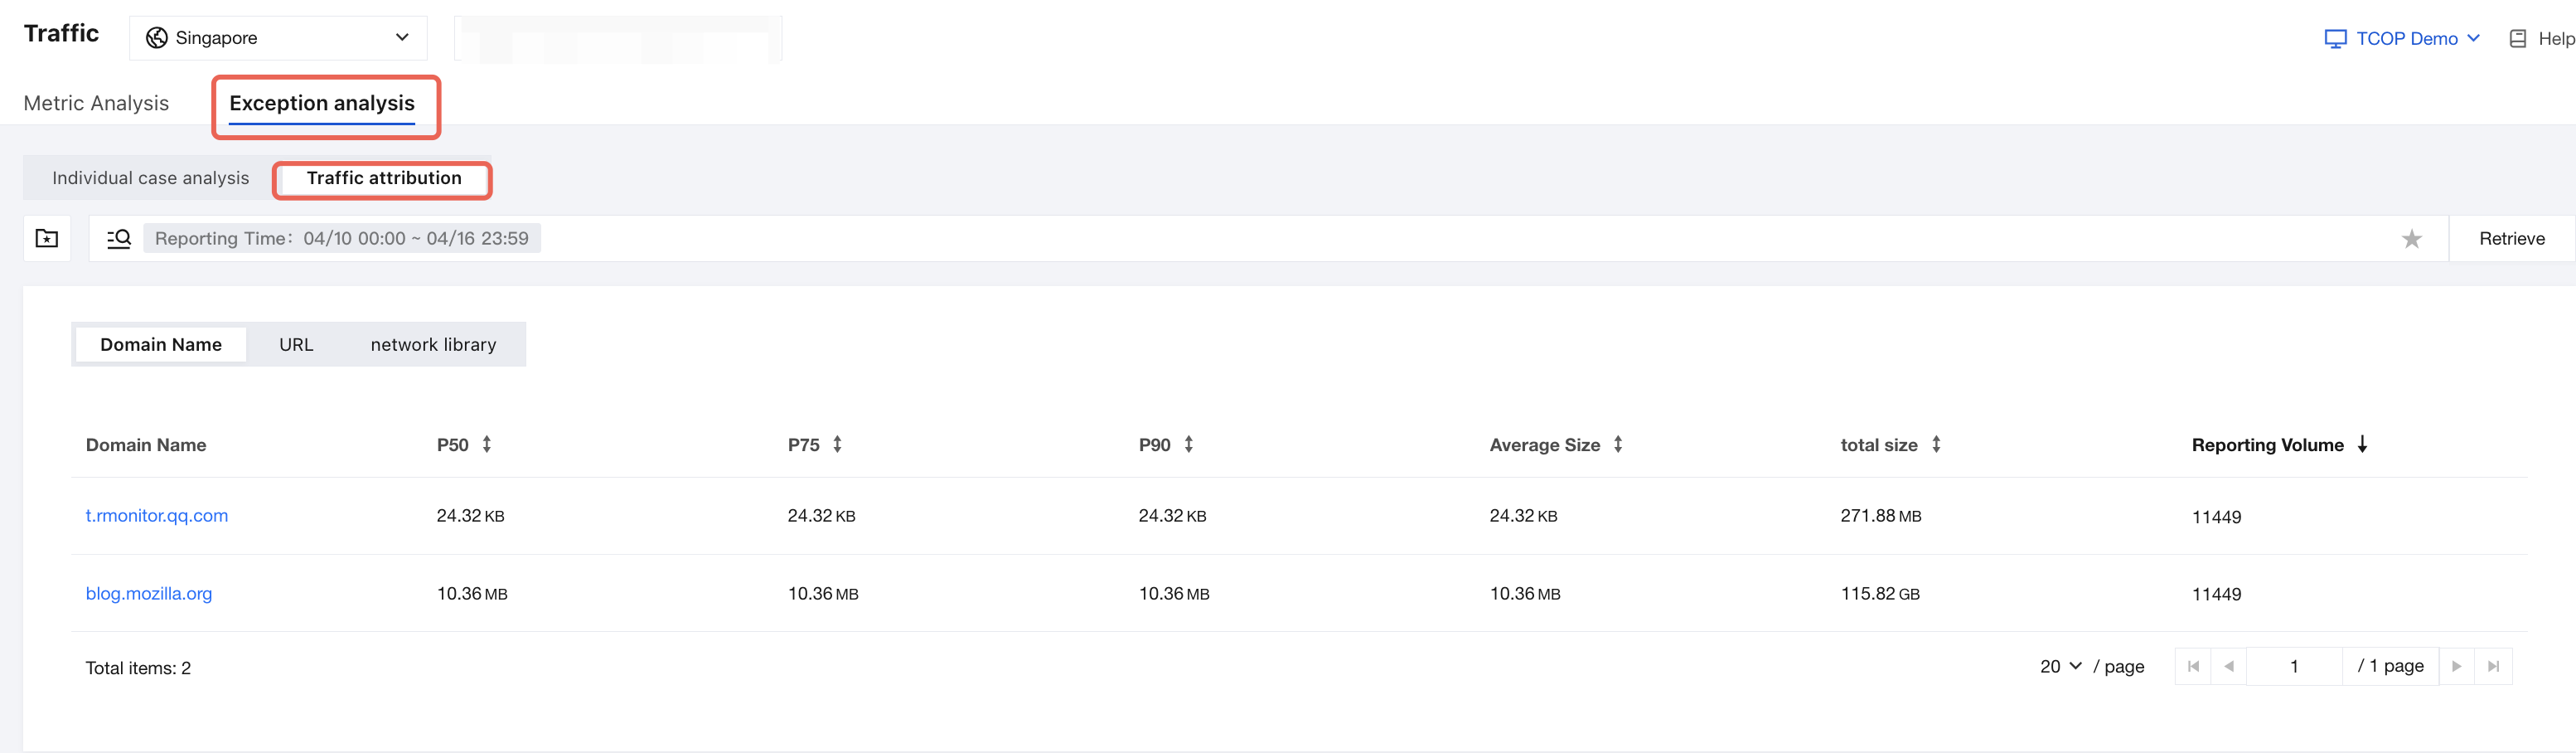
Traffic attribution aims to perform attribution analysis on consumed traffic. Currently, it only supports attribution based on domains, URL, and network libraries.
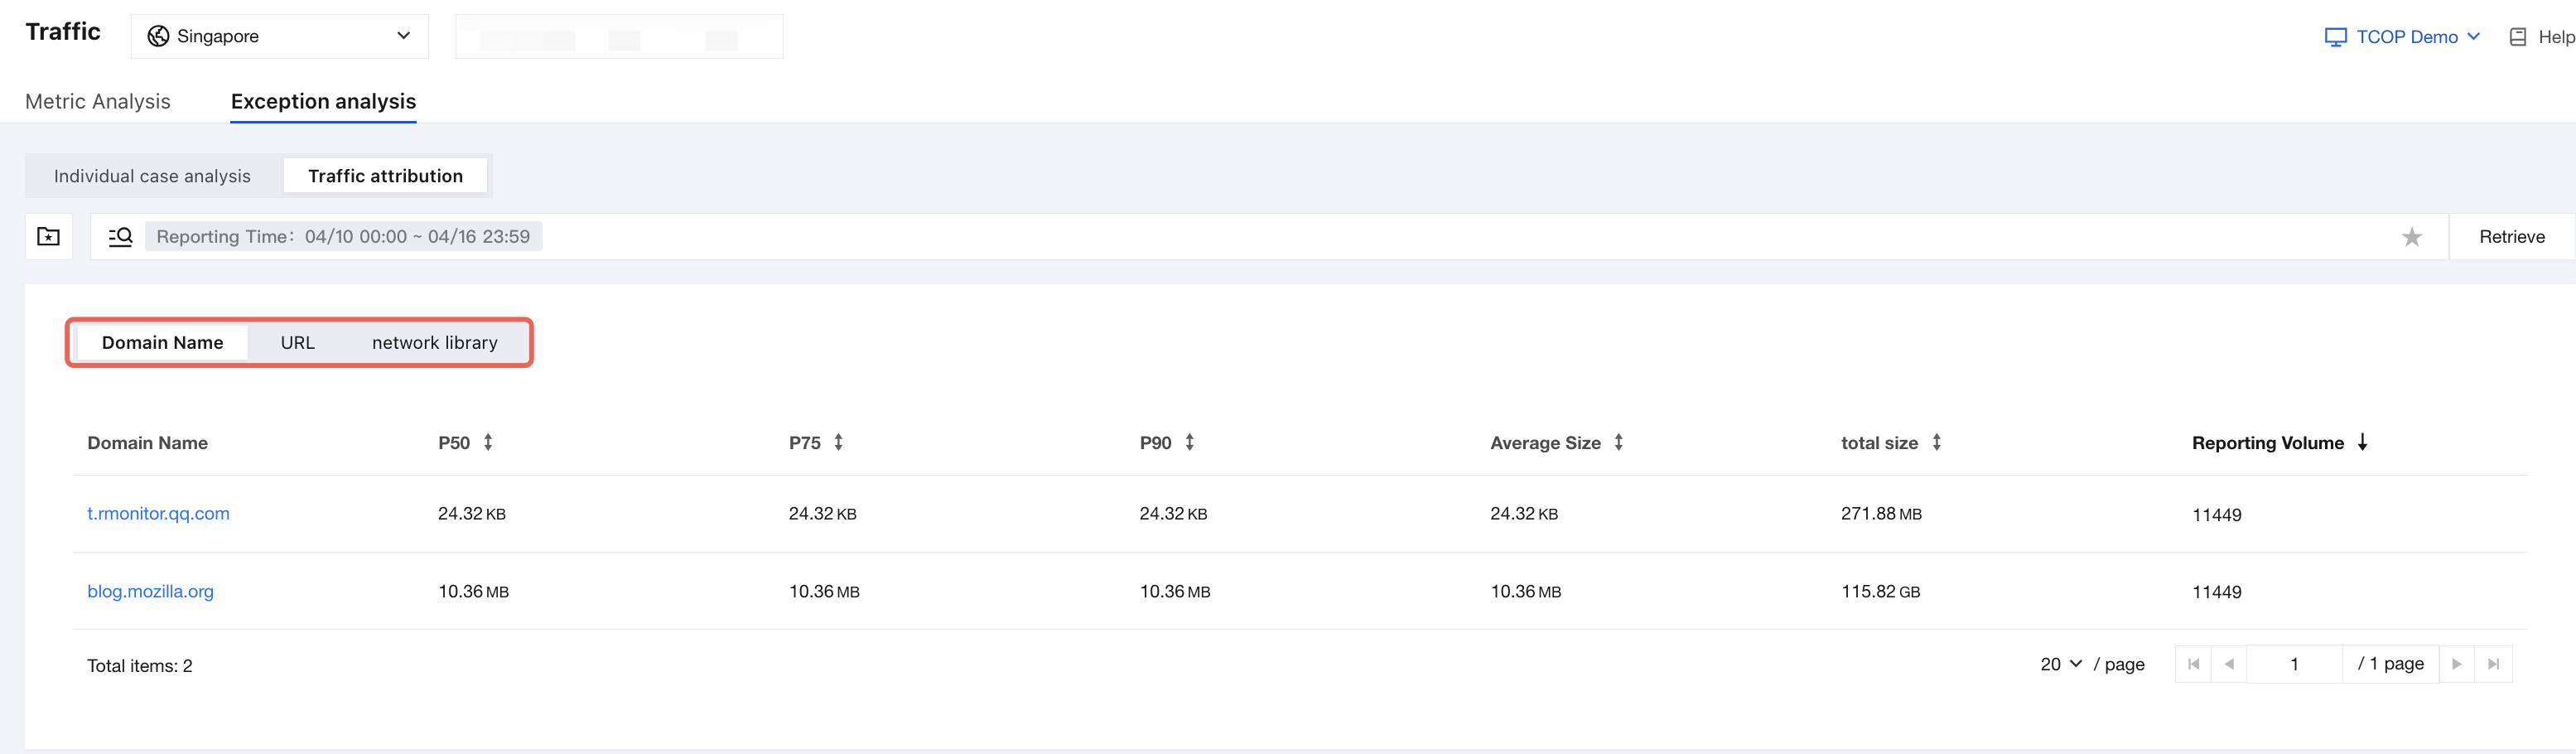
Currently, for URL attribution, except for custom scenarios, it only supports up to the domain level.
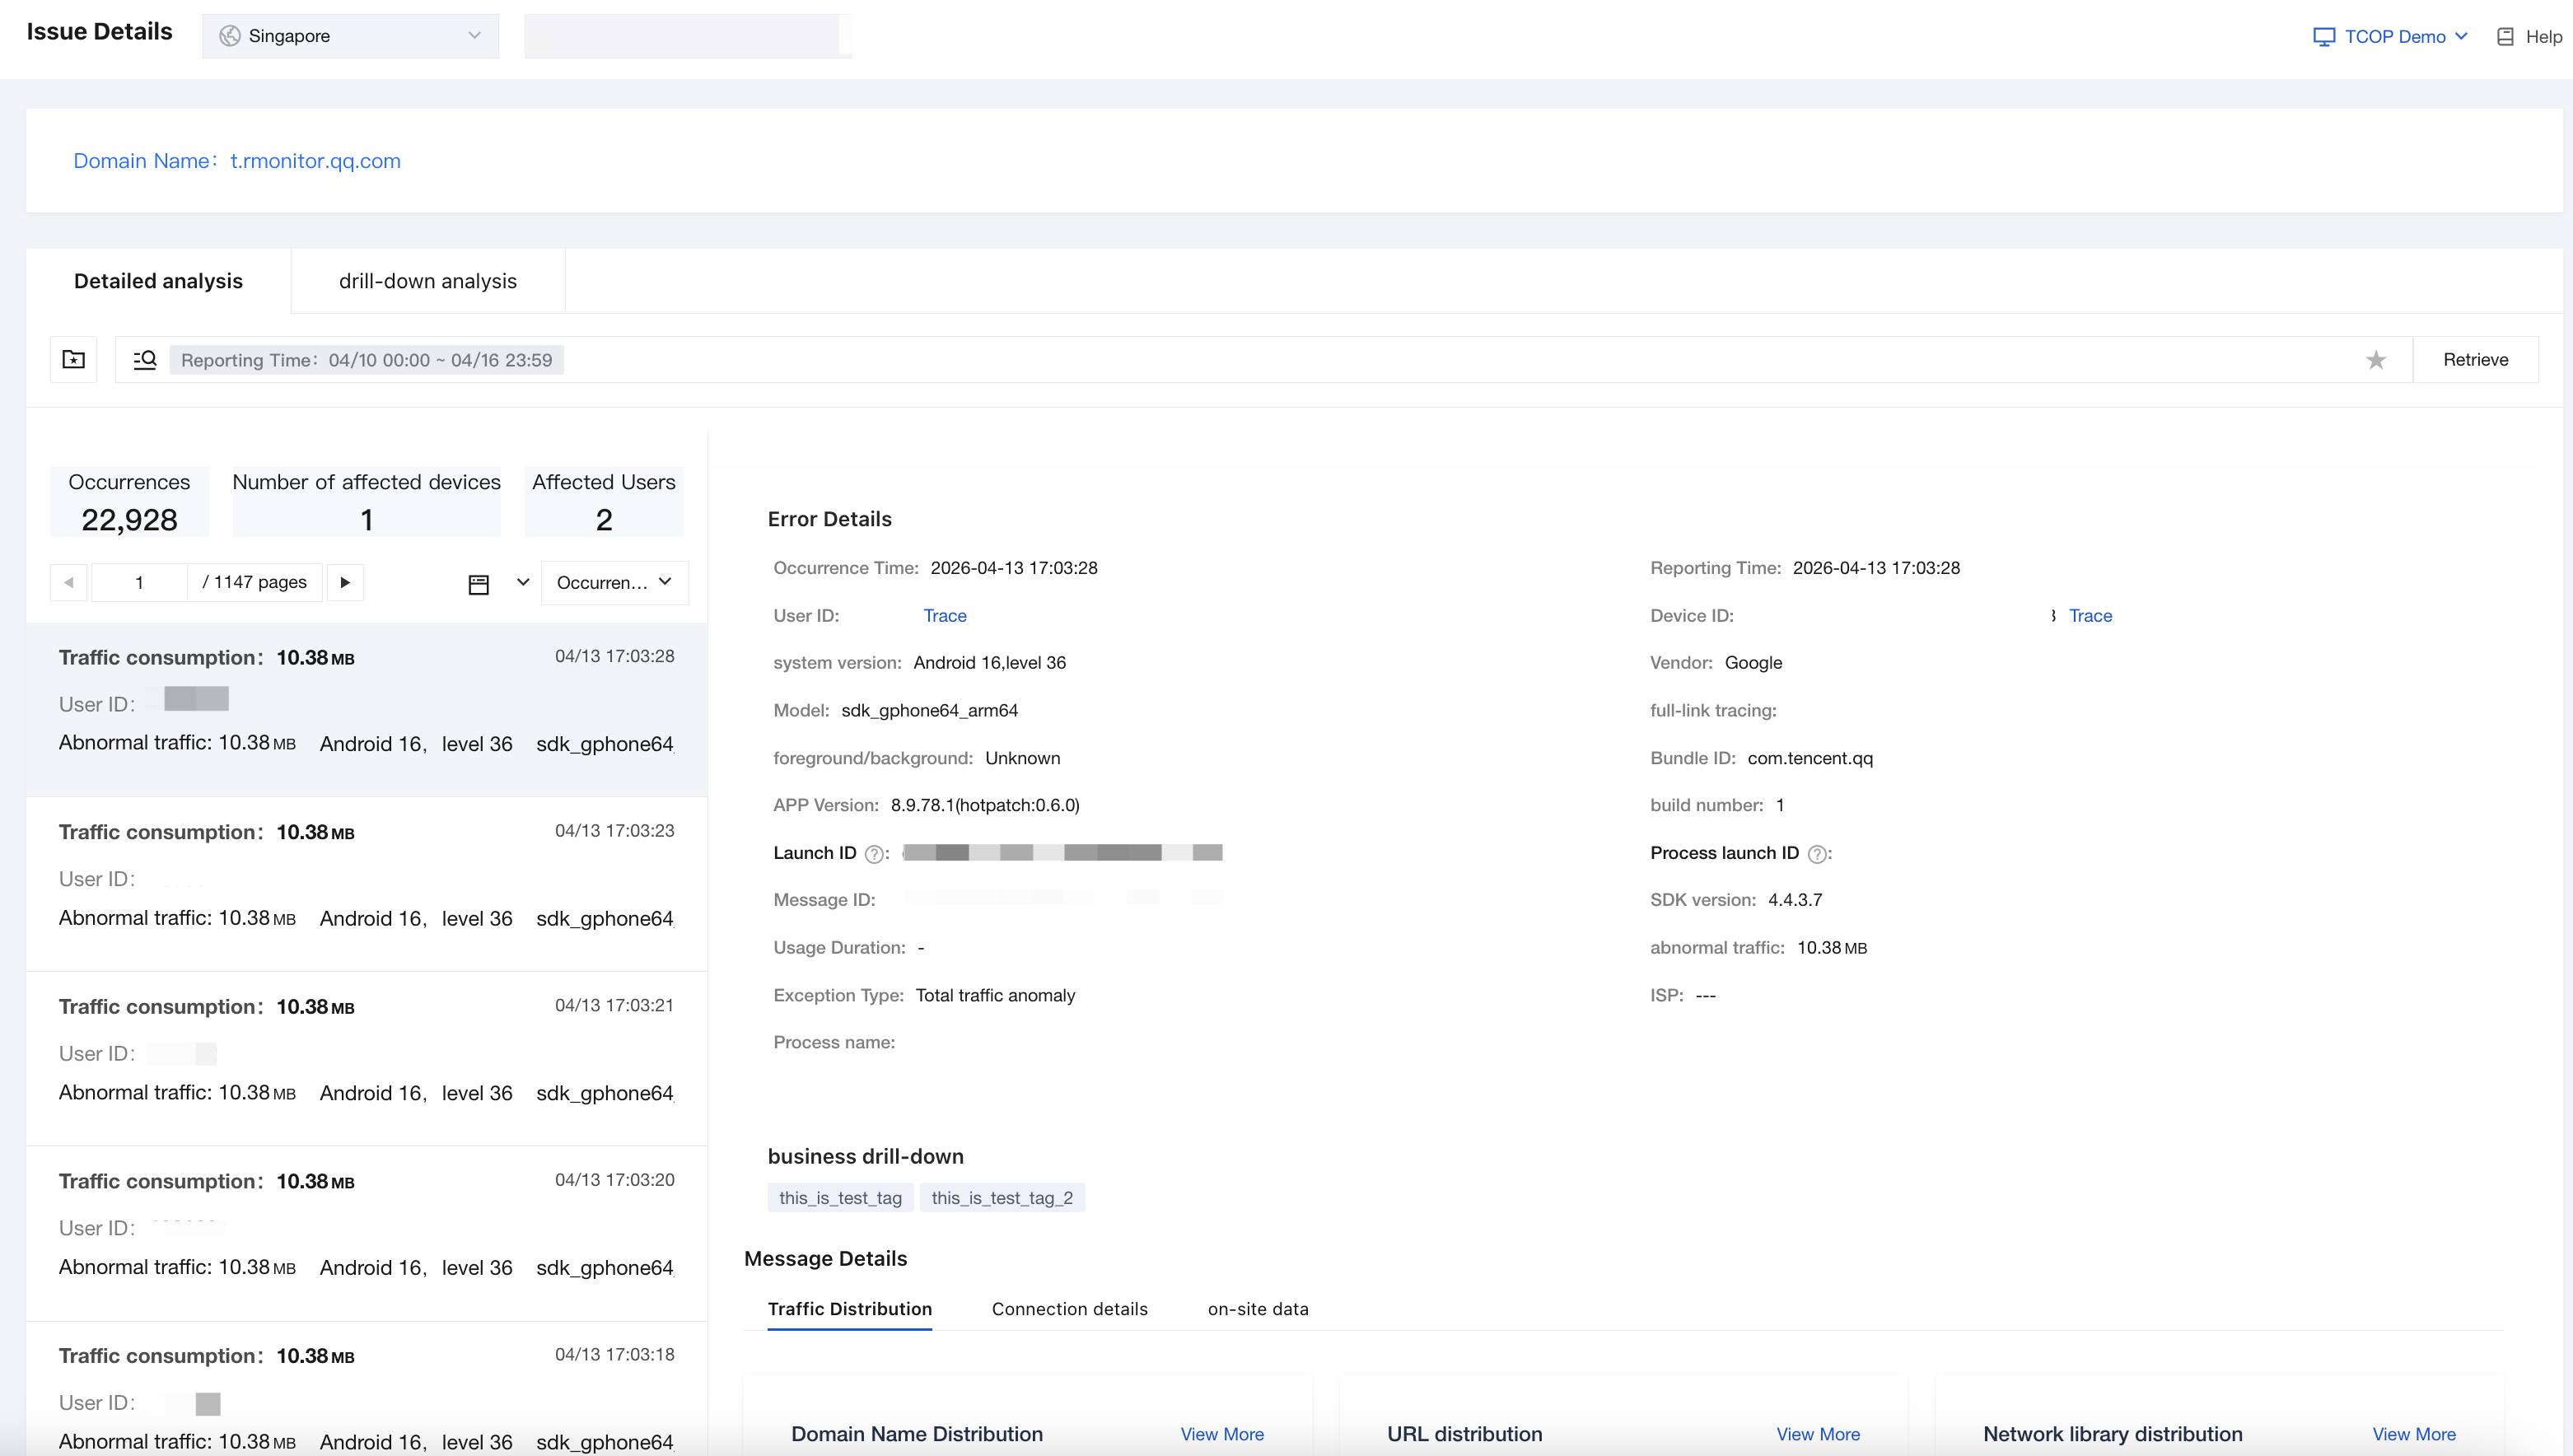
In the traffic attribution of exception cases, you can also click on an attribution to view all exception cases that meet the attribution criteria.
Help and Support
Was this page helpful?
You can also Contact sales or Submit a Ticket for help.
Help us improve! Rate your documentation experience in 5 mins.
Feedback