Page Performance
Download
Focus Mode
Font Size
This article introduces the overview, configuration, and usage of features in the page performance monitoring module for Android and iOS platforms.
Android
Background
User experience (User Experience, UX) is a critical factor in mobile application development. With the advancement in smartphone hardware performance and the continuous increase in user demands, users have higher expectations for application responsiveness and smoothness. Page startup time is a key metric for user experience, especially in mobile applications. An extended page startup time can frustrate users and may even result in user churn. By default, the platform's page startup monitoring tracks cold start time for Activities, including two types of metrics: Page Rendering Duration and Page loading duration.
Page Rendering Duration: The time from the call of Activity's onCreate to the completion of the first frame rendering.
Page loading duration: Its value is the same as the page rendering time by default, but users can customize the loading end time of the Activity via the reportActivityFullLaunch API.
Enabling Steps
1. On the Setting > SDK configuration Edit Configuration page, add the following configuration items.
sample_ratio: Controls the user sampling rate, indicating how many devices will enable this feature. 1 indicates that all devices are enabled, while 0 indicates that all devices are disabled.

2. Before calling the Bugly.init API, add the following code in the client. For details about how to call the Bugly.init API, see SDK Initialization.
...BuglyBuilder.addMonitor(BuglyMonitorName.PAGE_LAUNCH); // Add this statement...Bugly.init(context, builder);
API Description
In addition to monitoring the overall time consumption on the page, users can also call the following APIs to monitor the time consumption of each Span during the page launch process. A Span can be understood as a sub-stage in the page launch process. The following are the APIs of the com.tencent.rmonitor.pagelaunch.PageLaunchMonitor class, which is implemented as a singleton. You can retrieve this singleton instance via PageLaunchMonitor.getInstance().
/*** Mark the beginning of a Span during the activity launch process* @param activity* @param name, Span name* @param parentName, parent Span name*/public void startSpan(Activity activity, String name, String parentName);/*** Mark the end of a Span during the activity launch process* @param activity* @param name Span name, which must match the parameter of startSpan.*/public void endSpan(Activity activity, String name);/*** The user-defined end time of the Activity launch process uses the time when this API is called as the end time of the Activity launch.* @param activity*/public void reportActivityFullLaunch(Activity activity);
Note that startSpan and endSpan must be called in paired matching; only one record will be saved for the same Span name, meaning the latter Span with the same name will overwrite the former.
Sample Code
@Overrideprotected void onCreate(Bundle savedInstanceState) {super.onCreate(savedInstanceState);PageLaunchMonitor.getInstance().startSpan(this, "MemoryTracerTest", "");PageLaunchMonitor.getInstance().startSpan(this, "onCreate", "MemoryTracerTest");startMemoryTrace();PageLaunchMonitor.getInstance().endSpan(this, "onCreate");}@Overridepublic void onResume() {super.onResume();PageLaunchMonitor.getInstance().startSpan(this, "onResume", "MemoryTracerTest");reStartMemoryTrace();PageLaunchMonitor.getInstance().endSpan(this, "onResume");PageLaunchMonitor.getInstance().endSpan(this, "MemoryTracerTest");// Call reportLaunchFinished to mark the end of the Activity launch only after the page loading is completed.new Thread (new Runnable() {reportLaunchFinished();}).start();}private void reportLaunchFinished() {PageLaunchMonitor.getInstance().reportActivityFullLaunch(this);}
The above example contains three Spans: "MemoryTracerTest", "onCreate", "onResume", among which MemoryTracerTest is the root Span, and its duration is the sum of the two child Spans, onCreate and onResume.
Log Description
Log for successful feature enabling:
10-04 10:xx:xx.xxx 14546 1819 D PageLaunchPlugin: start page launch monitor
Log for successful feature disabling:
10-04 10:xx:xx.xxx 14546 1819 D PageLaunchPlugin: stop page launch monitor
Logs are reported after backgrounding, uploading all recorded Activity cold start time data:
10-22 10:11:44.465 15996 16178 V RMonitor_report_Json: url: https://xxx.qq.com/v1/xxxx/upload-json?timestamp=1720059647340&nonce=xxxxxxxx eventName: page_launch, client_identify: f55e3c66c53520933d0b8c8687da6398
iOS
Background
In iOS applications, page loading time is a crucial performance metric. If a page takes too long to launch, it may degrade user experience and even impact the overall performance of the application. Page performance monitoring primarily focuses on tracking page loading time. By default, the platform's page loading monitoring feature tracks the loading time of UIViewController, which is divided into two categories: page rendering time and page loading time.
Page rendering time: The duration from the call of UIViewController's loadView: to the call of viewDidAppear:.
Page loading time: Its value is the same as the page rendering time by default, but users can customize the loading end time of VC through the endVCRender API.
Enabling Steps
Page load time analysis is a new feature. Similar to other features on the platform, it requires executing the following code on the client-side to enable it, while also configuring an appropriate sampling rate in the platform backend.
1. Include Bugly_MODULE_PAGE_LAUNCH or use RM_MODULE_ALL in the startup module.
[Bugly start:@[Bugly_MODUEL_PAGE_LAUNCH, /*...*/] config:config completeHandler:^{/*...*/}];// Or[Bugly start:RM_MODULE_ALL config:config completeHandler:^{/*...*/}];
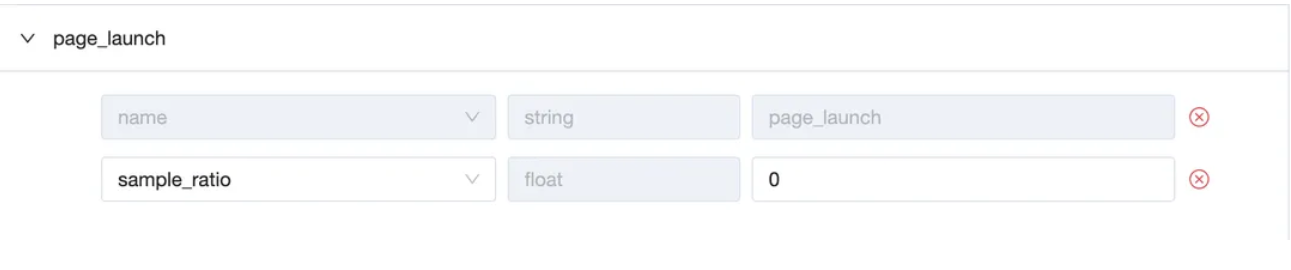
2. On the edit configuration page of App Configuration > SDK Configuration, add the following configuration items:
sample_ratio: Controls the user sampling rate, indicating how many devices will enable this feature. 1 indicates that all devices are enabled, while 0 indicates that all devices are disabled.
API Description
In addition to monitoring the page rendering and loading time, users can also call the following APIs to monitor the time consumption of each Span during the page launch process, which can be understood as sub-stages in the page launch process.
The following is the definition of BuglyPageLoadMonitor.
@interface BuglyPageLoadMonitor : NSObject/*** Marks the current ViewController as rendered.* If this method is never called, viewDidAppear is used as the end time.* @param vc The corresponding ViewController object*/+ (void)endVCRender:(UIViewController *)vc;/*** Add a group of Spans for the current ViewController* @param Spans The added Spans* @param vc The corresponding ViewController object*/+ (void)addSpans:(NSArray<RMSpan *> *)Spans forVC:(UIViewController *)vc;@end
The definition of RMSpan is consistent with the Span in launch monitoring. For details, refer to Launch. For the same ViewController, only the last record of a same-named Span will be saved, meaning the latter overwrites the former's time consumption data.
Log Description
After successful enabling, the module enabling log output during SDK startup will contain the corresponding module name:
[Bugly][Event][BuglyDAUReporter.m:100][SDK setup] Activate Module:("launch.page_launch"...)
Similarly, the reporting logs contain the following information:
[Bugly][Event][RMReportQueue.m:601][Report] [launch.page_launch] report id:xxx error:(null)
Data analysis
The following content uses the page performance module on the Android platform as an example for explanation. iOS can refer to the following content for analysis.
Metric Analysis
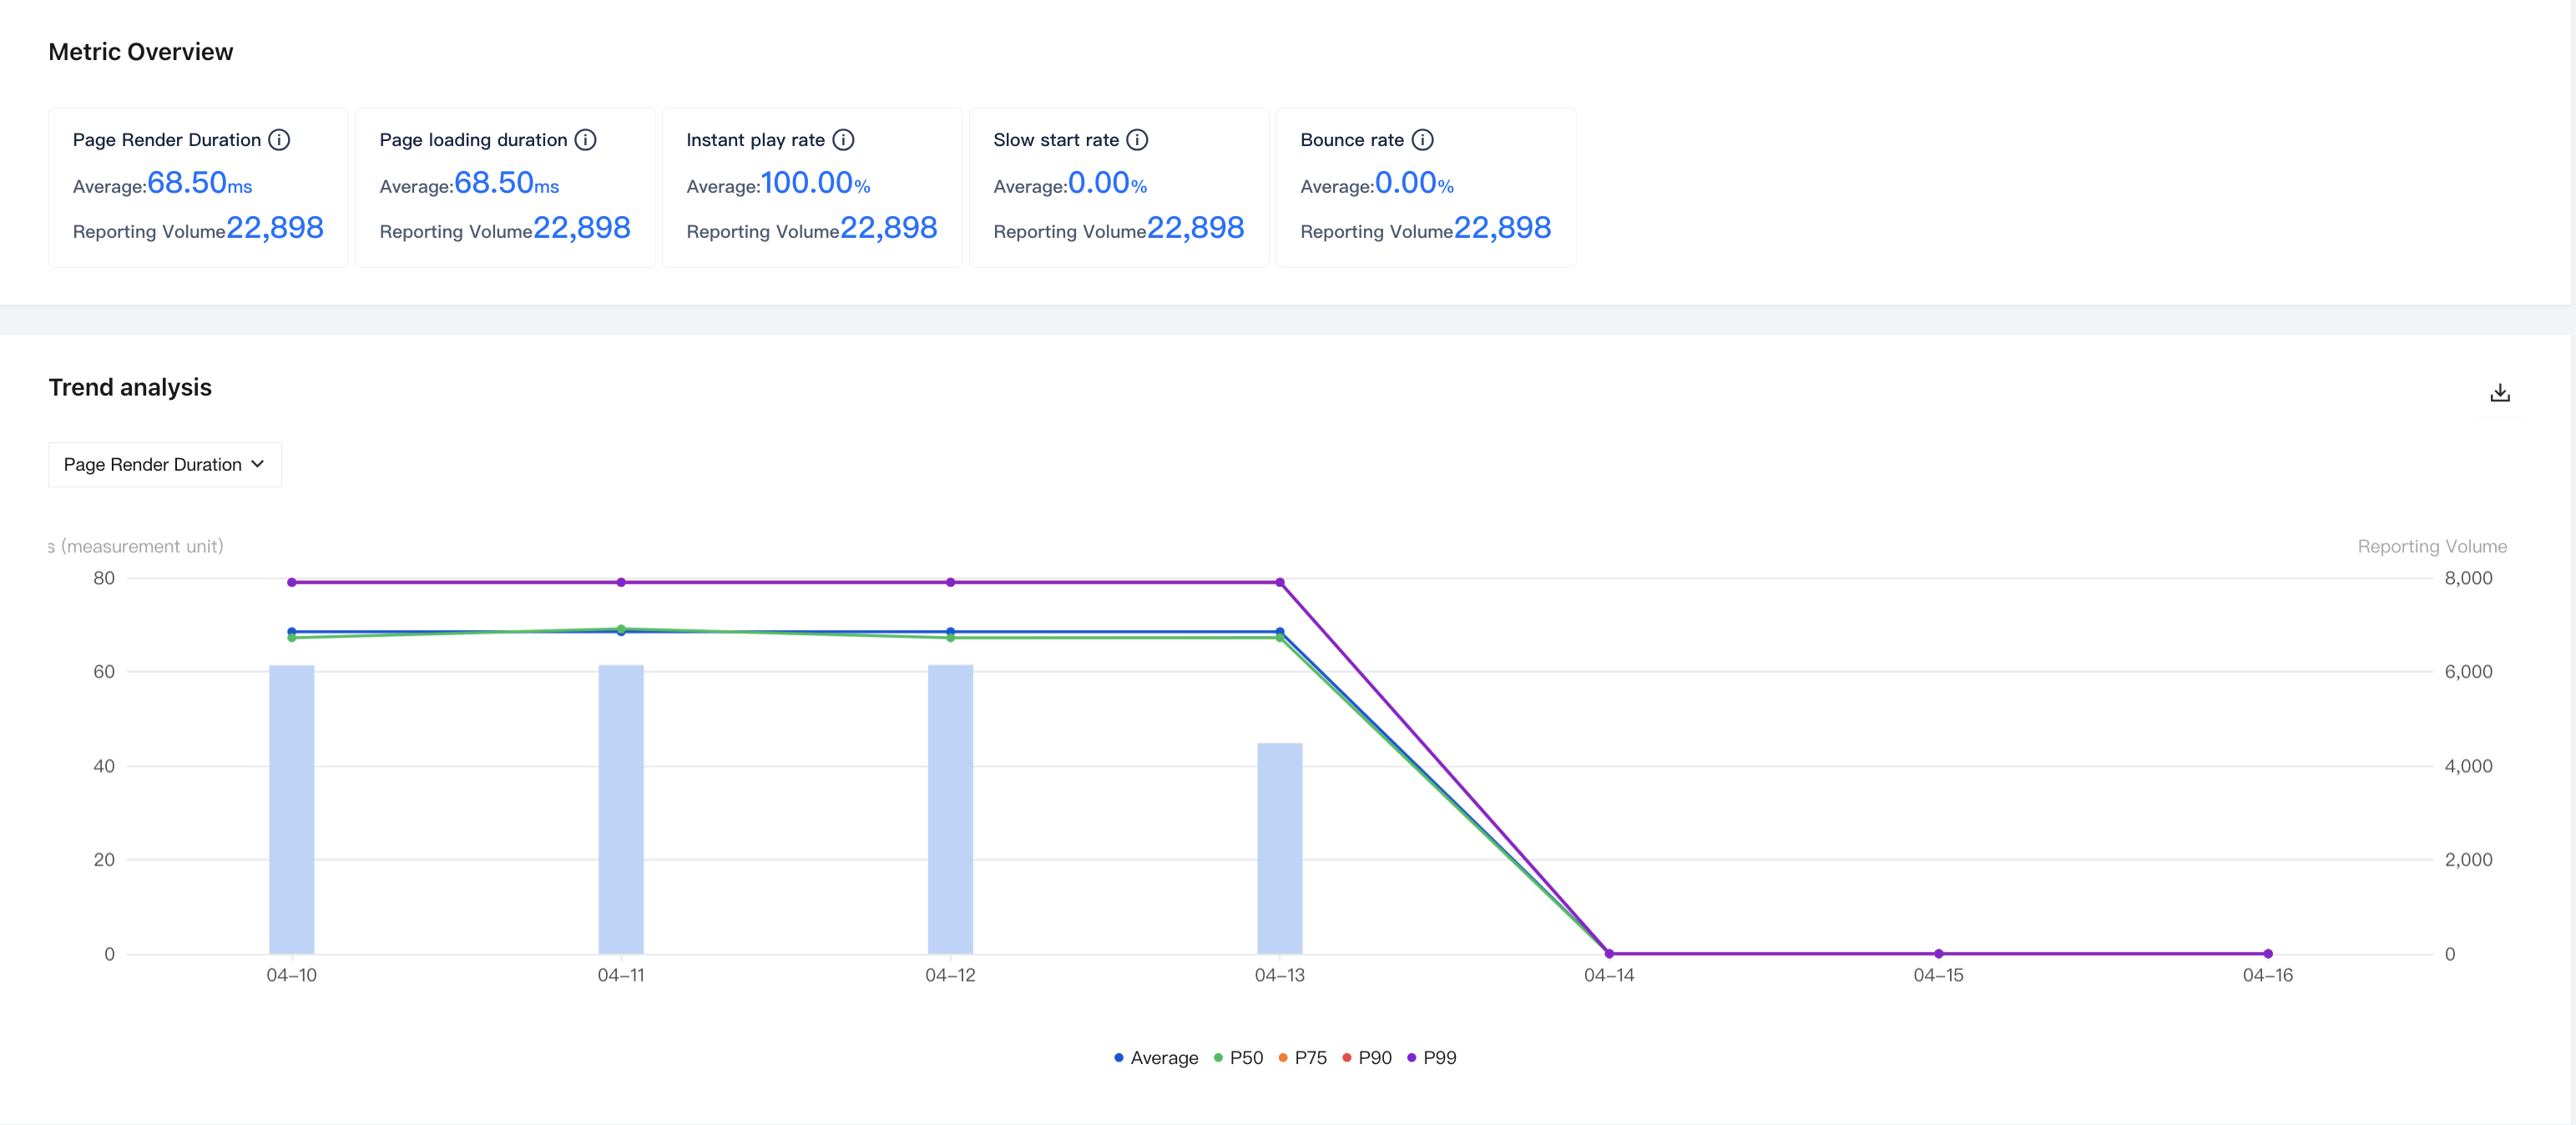
On the metric analysis page, the following information can be viewed:
Page Render Duration average and percentile values.
Page loading duration average and percentile values.
Instant play rate: The percentage of cases where page rendering time is less than 1 second.
Slow start rate: The percentage of cases where page rendering time exceeds 3 seconds.
Bounce rate: The percentage of page visits where users exit before rendering completes (which can be used to measure the probability of users encountering a persistent white screen followed by exiting the page).
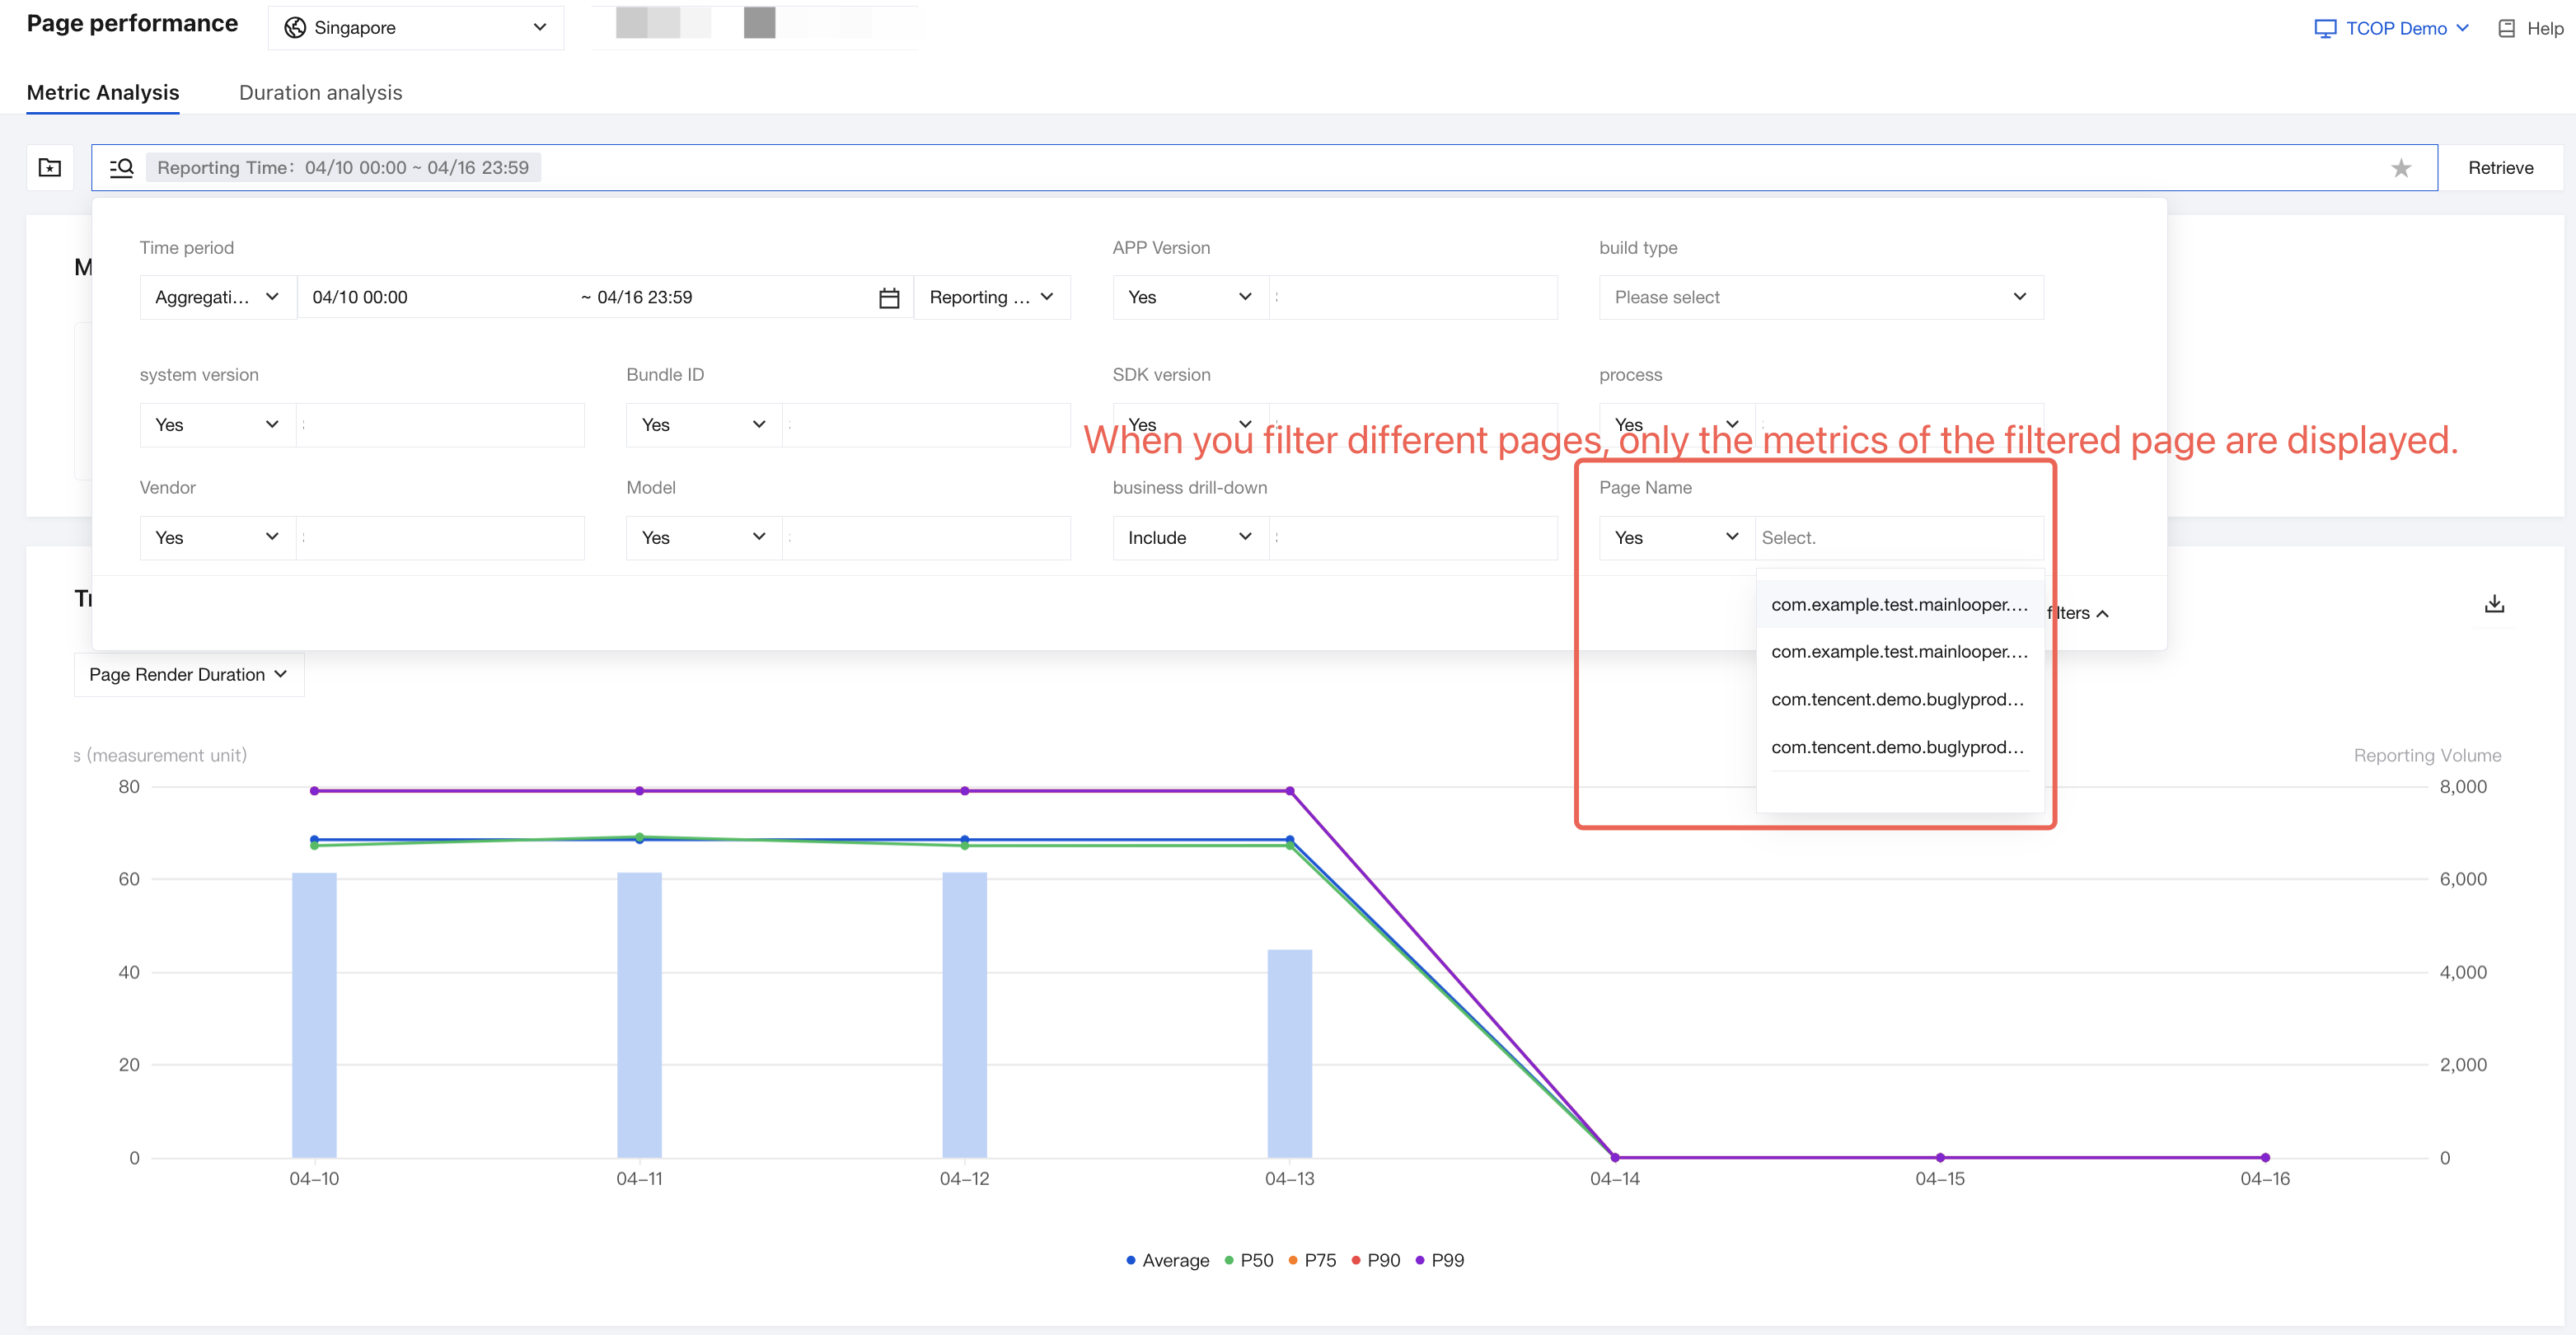
The query area provides numerous filter options. For details, refer to Query. For example, to view metric data only for the com.example.test.mainlooper.TestListView page, simply filter in the page name filter box:
Analyze time consumption
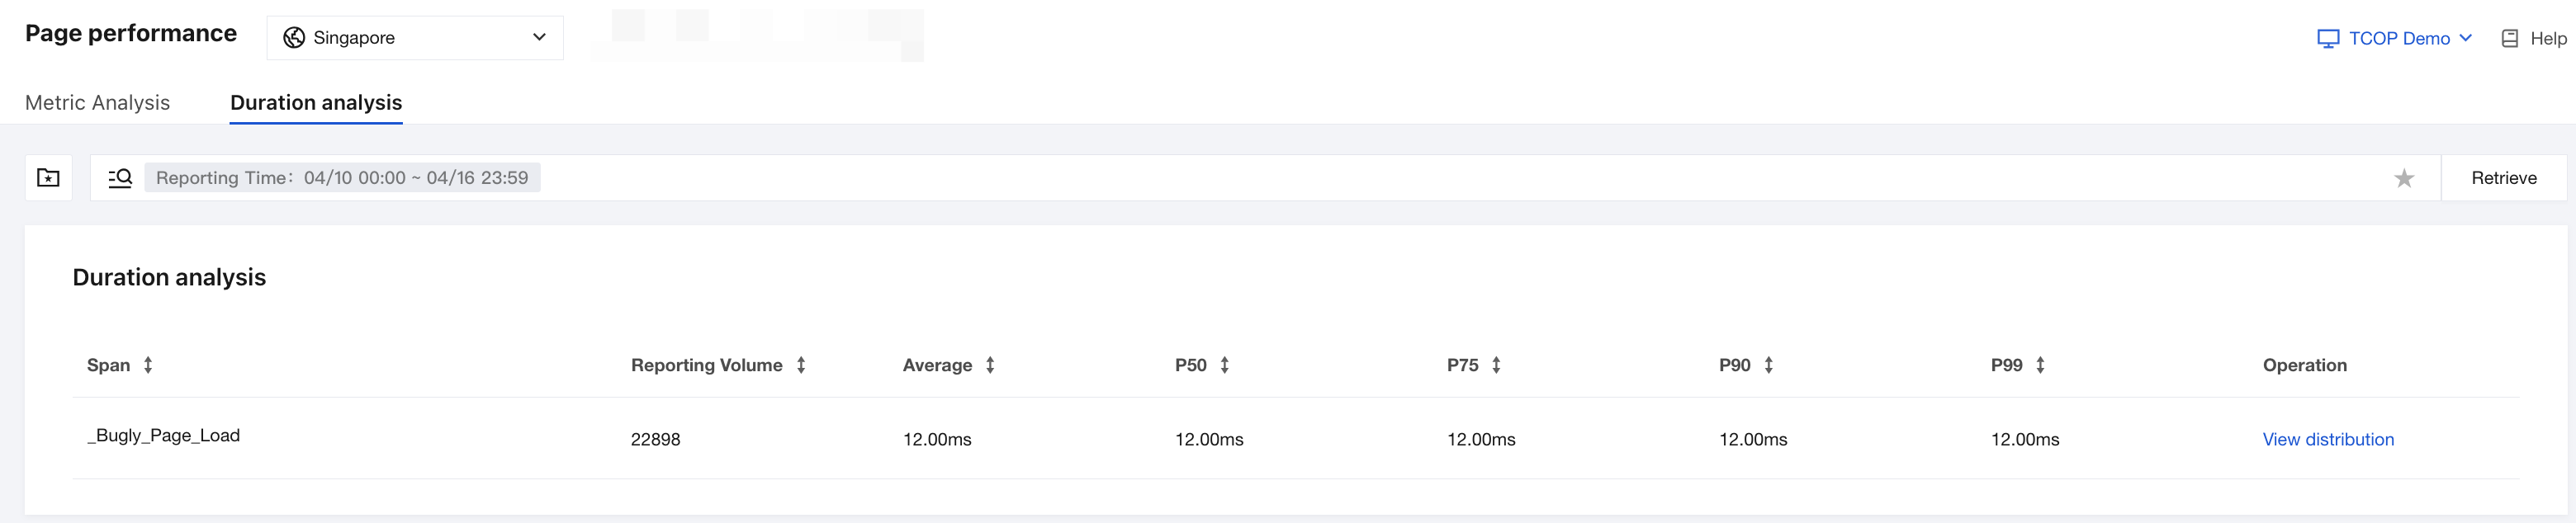
The Performance Analysis page, similar to the overall time consumption metrics of the page, clearly displays the average and percentile values for each Span, and also supports multiple filter options.
Help and Support
Was this page helpful?
You can also Contact sales or Submit a Ticket for help.
Help us improve! Rate your documentation experience in 5 mins.
Feedback