Custom Event
Download
Focus Mode
Font Size
This article introduces the overview of the Custom Event monitoring module for the React Native platform and the usage of features. For detailed information, please refer to React Native Integration Guide.
Filter region
Metrics Overview
Display core metrics of events to rapidly assess the overall impact scope.
Metric Description:
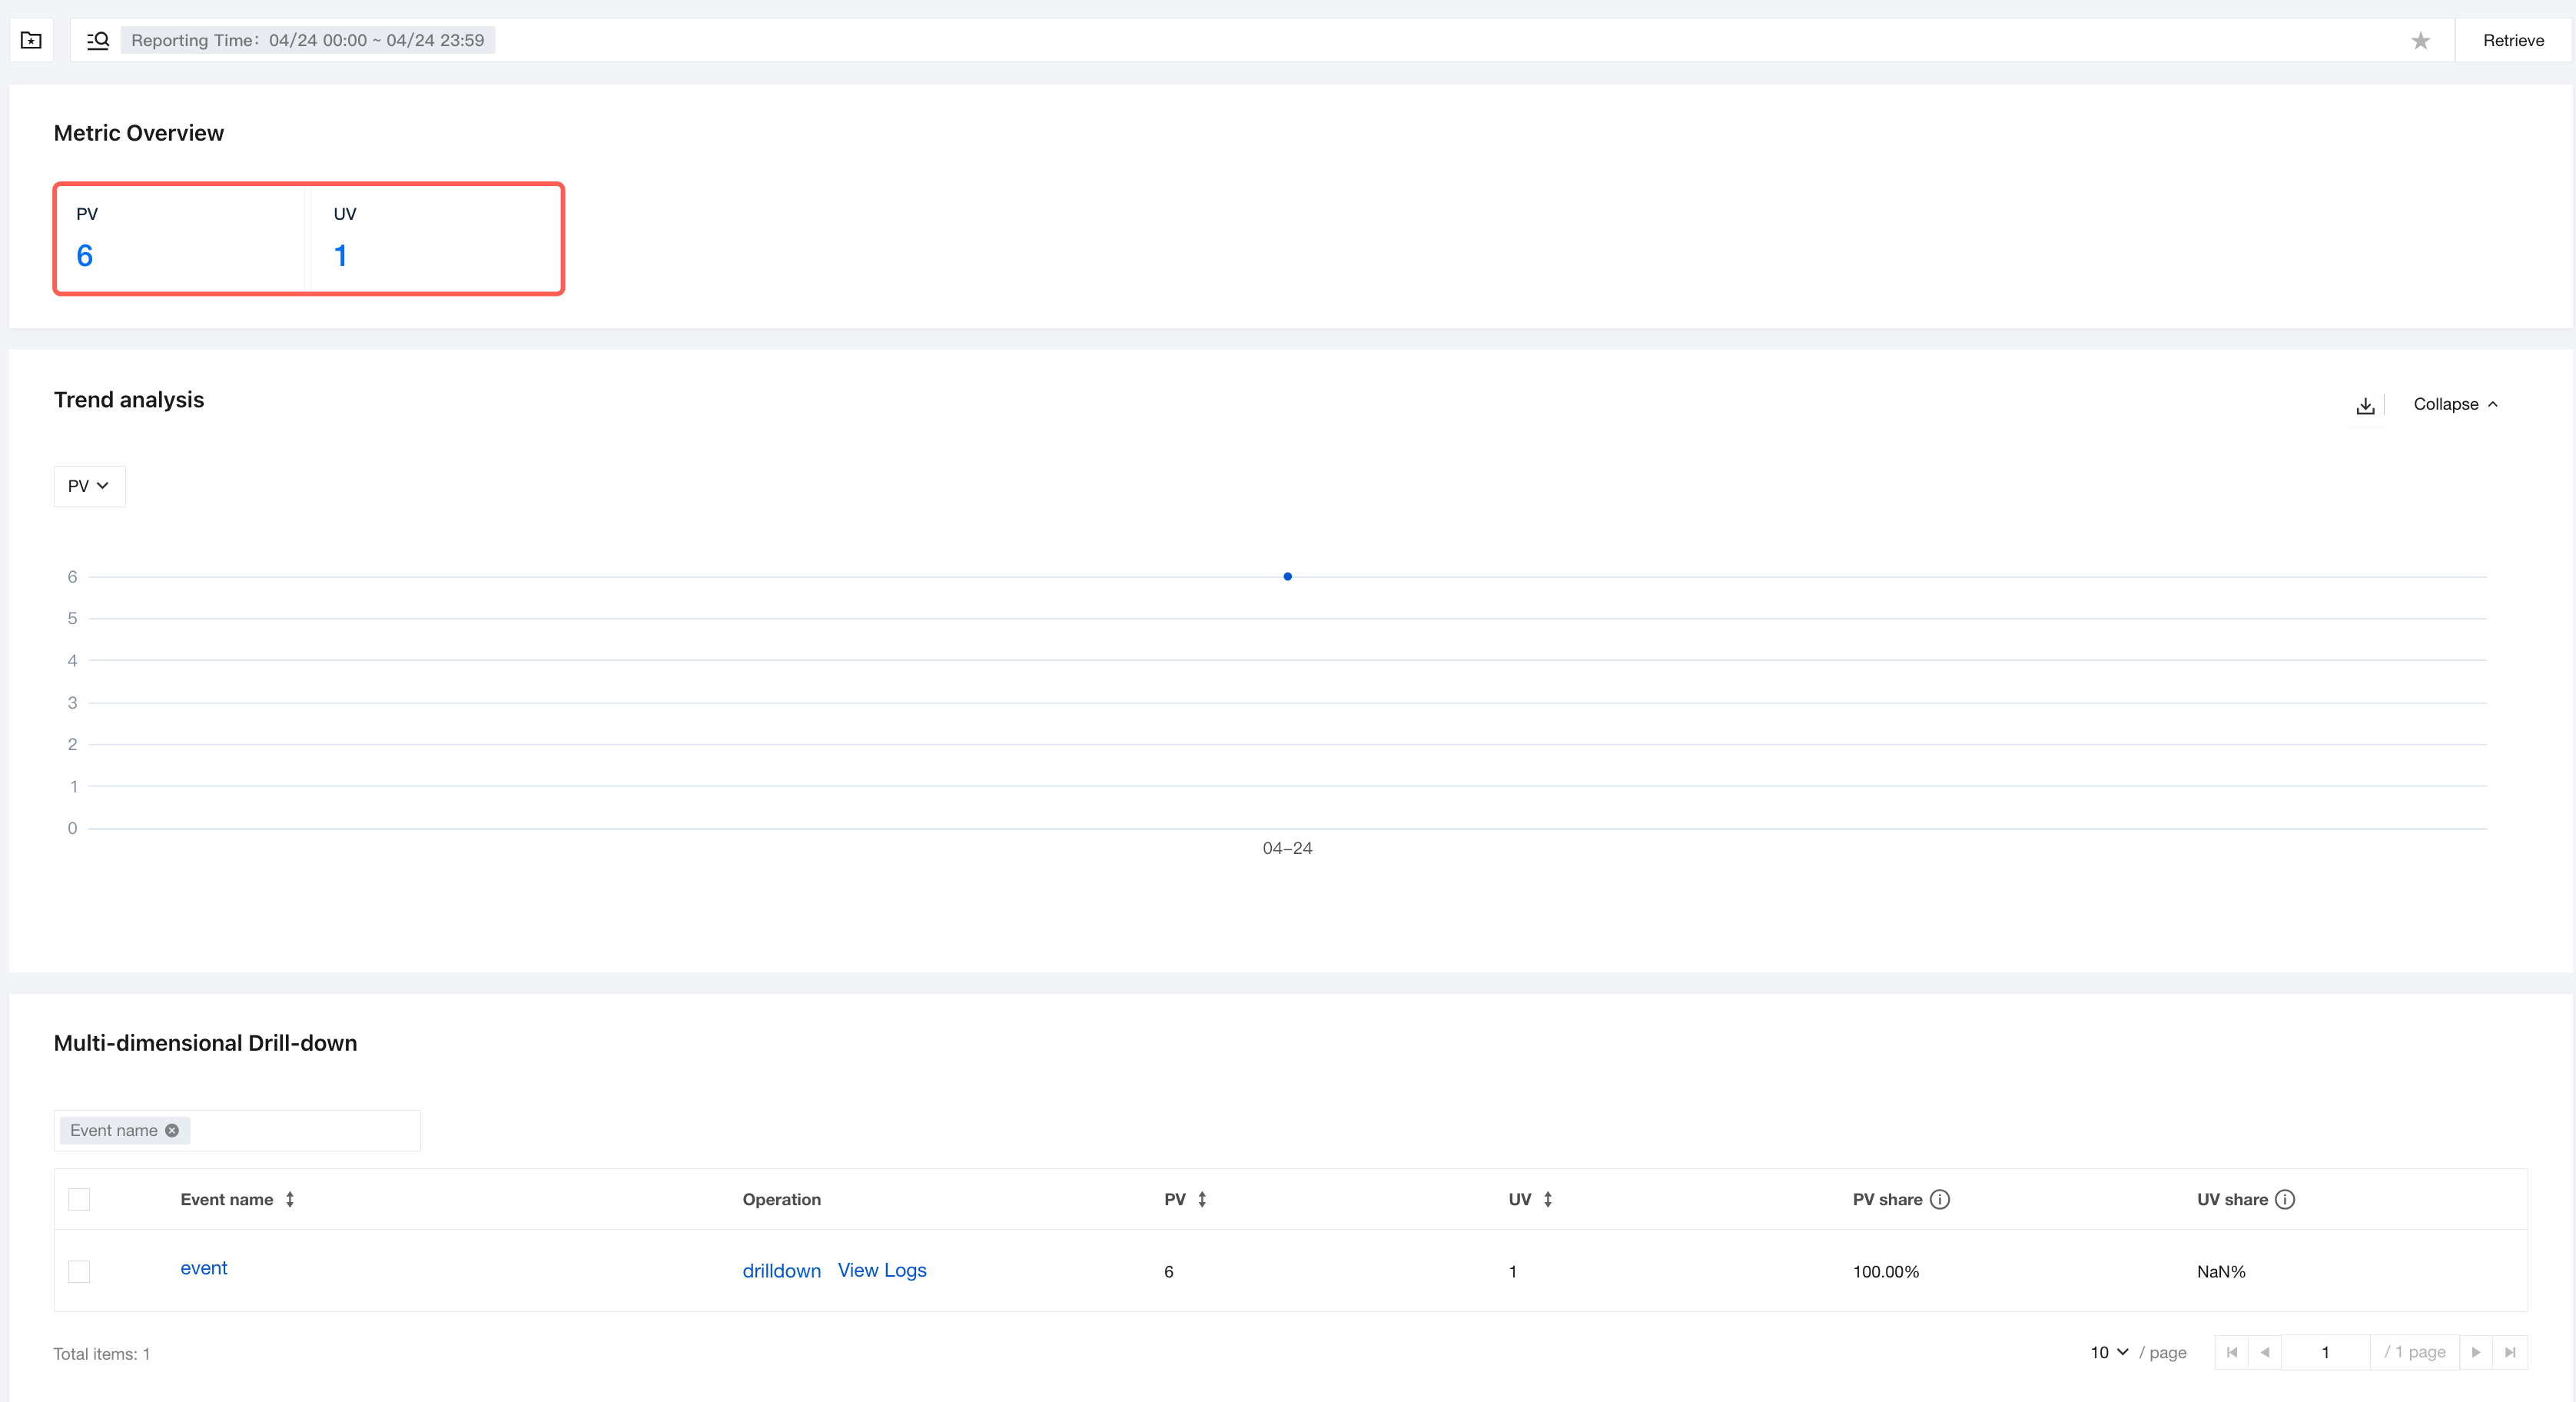
PV (Event Report Volume): In the example below, it is 6, indicating that a total of 6 event reports were received within this time range.
UV (Unique Users): In the example, it is 1, indicating that 1 unique users triggered these events.
Abnormality Identification: If PV or UV suddenly surges or an abnormal event accounts for an excessively high proportion, you can directly go to the Trend analysis or Multi-dimensional Drill-down module for further investigation.
Trend analysis
Analyze the trend of event volume over time to determine whether the issue is sporadic or persistent.
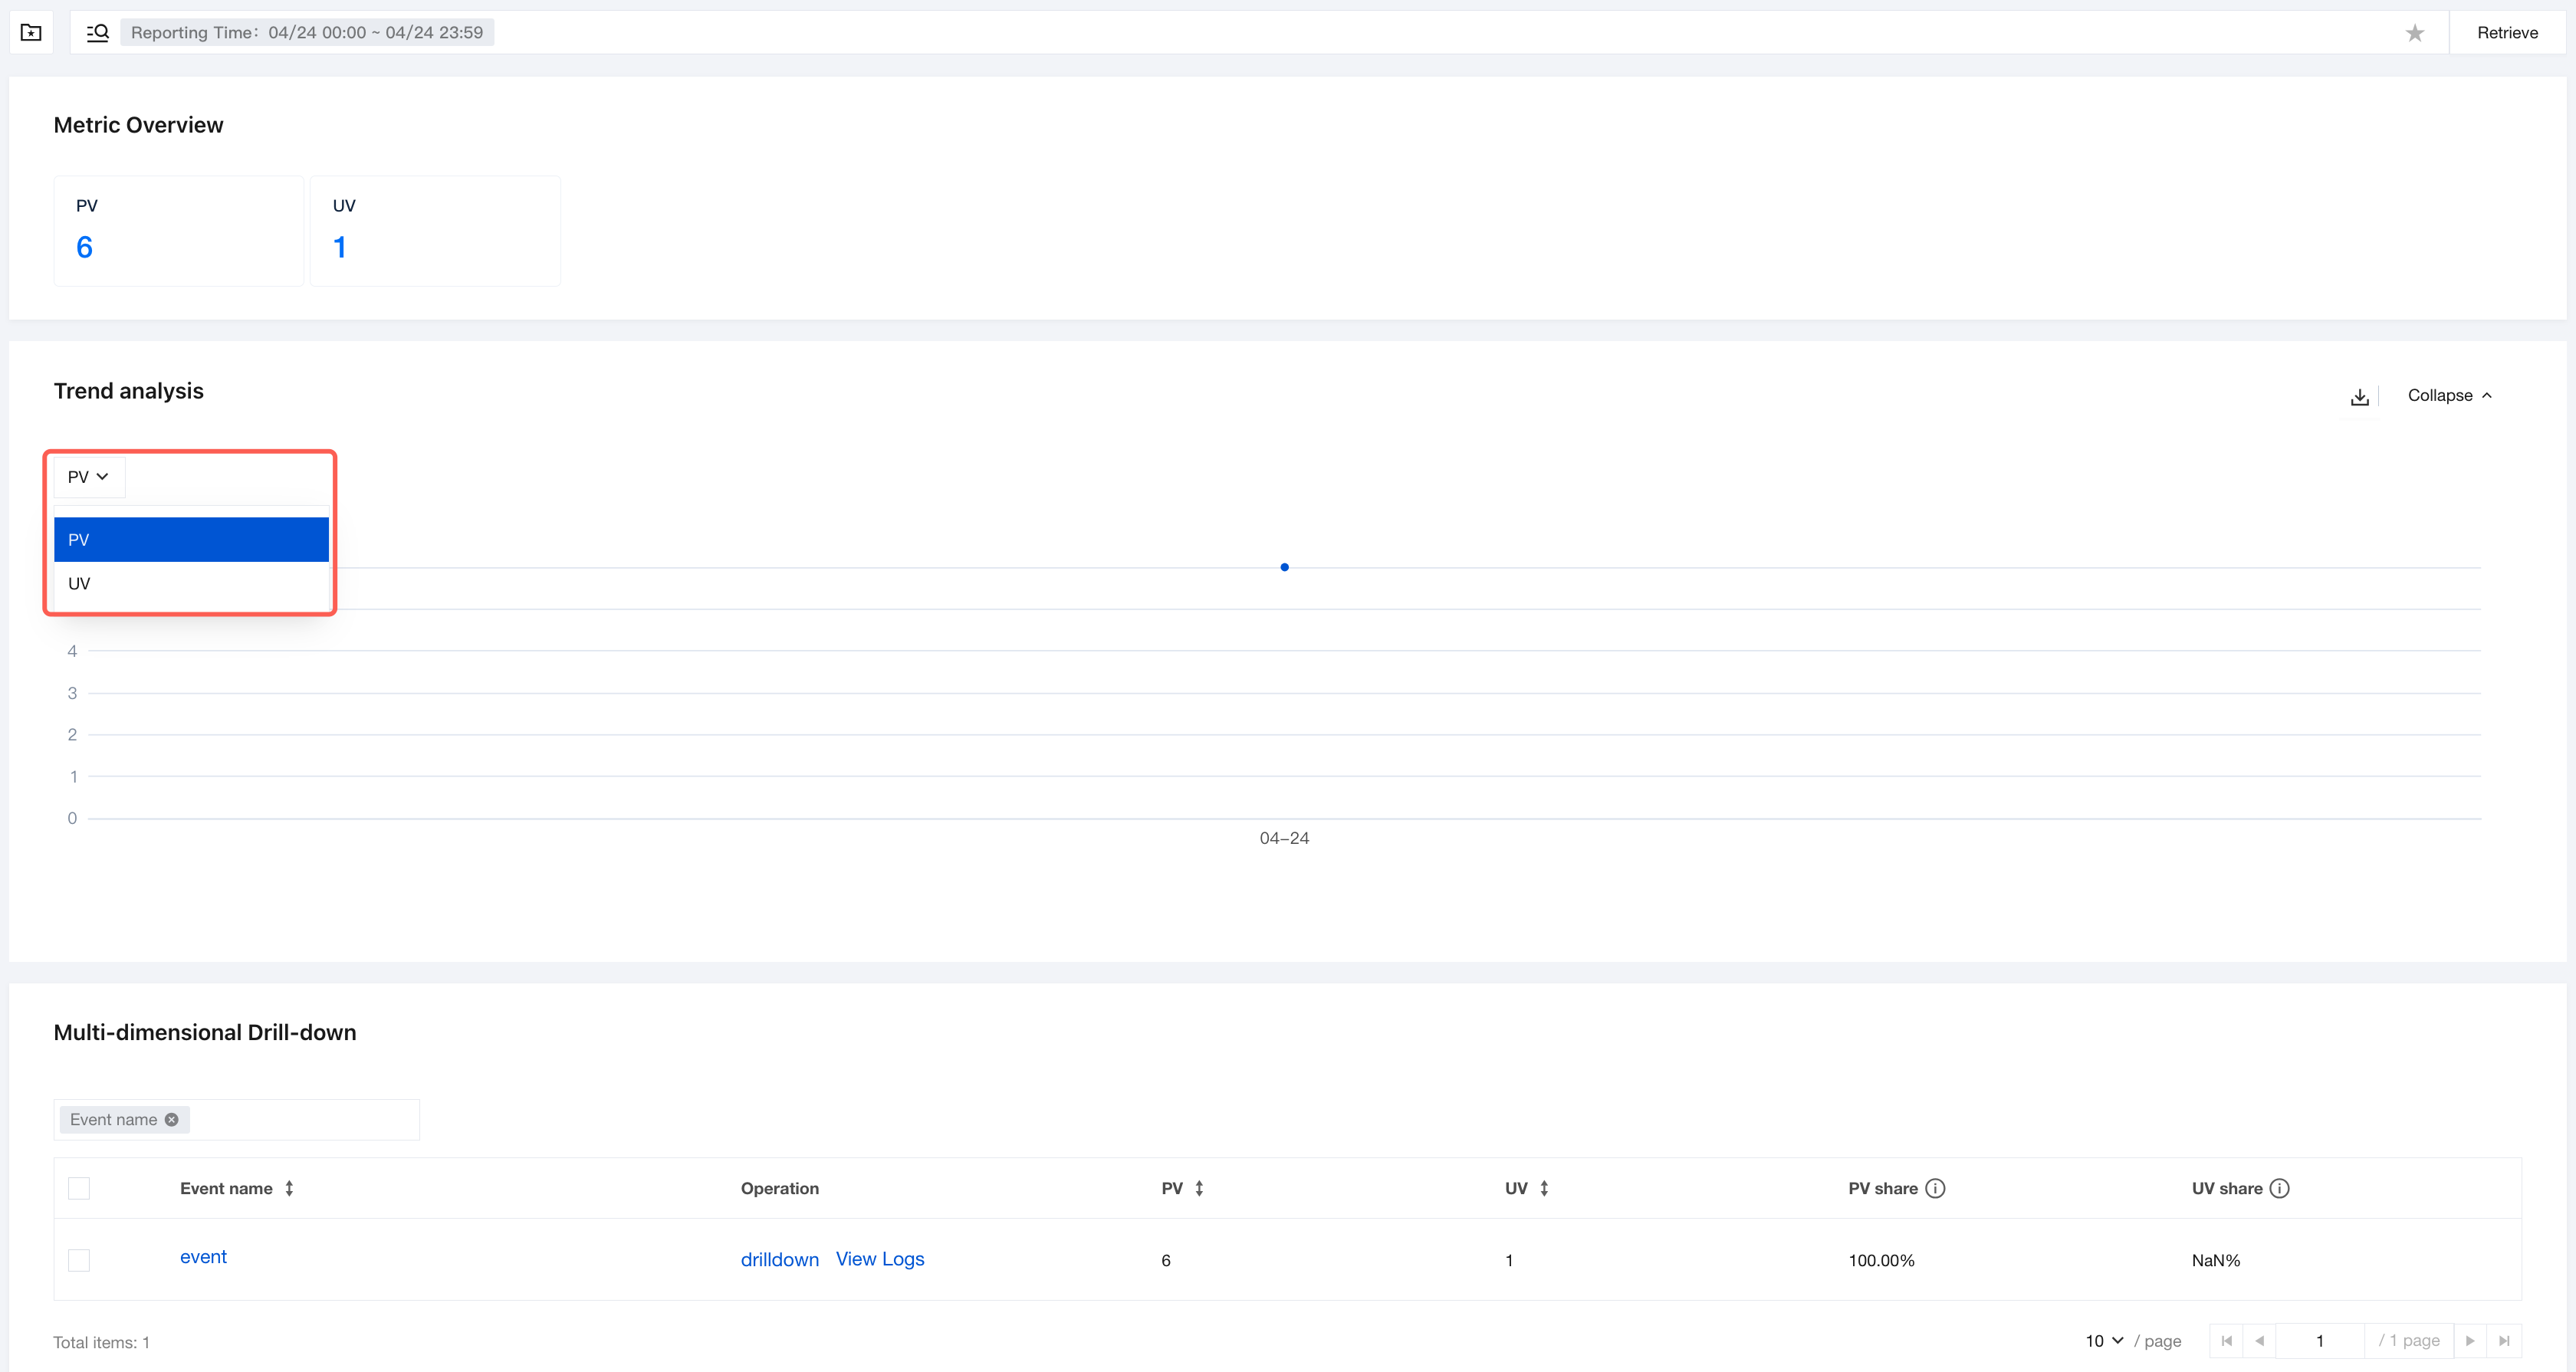
Metric Switching: The left dropdown allows switching between PV and UV metrics to view temporal trends from different dimensions.
Timeline Interaction: Hover over data points on the timeline to view specific values at that time point. Supports zooming the timeline to adjust the time granularity (e.g., switching from daily to hourly), and focusing on abnormal peak periods, such as the peaks on 11-26 and 12-04 in the example below.
Abnormal Point Positioning: Focus on the peaks in the trend chart. Clicking on a peak data point will link to the multi-dimensional drill-down module, allowing you to view the specific event distribution during that time period.
Data Download: Click the Download icon on the right to export trend analysis data within the current time range.
Supports clicking Collapse and Expand to adjust the display state of the module.
Multi-dimensional drill-down
Displays the distribution of events by event name dimension to locate high-frequency abnormal events.
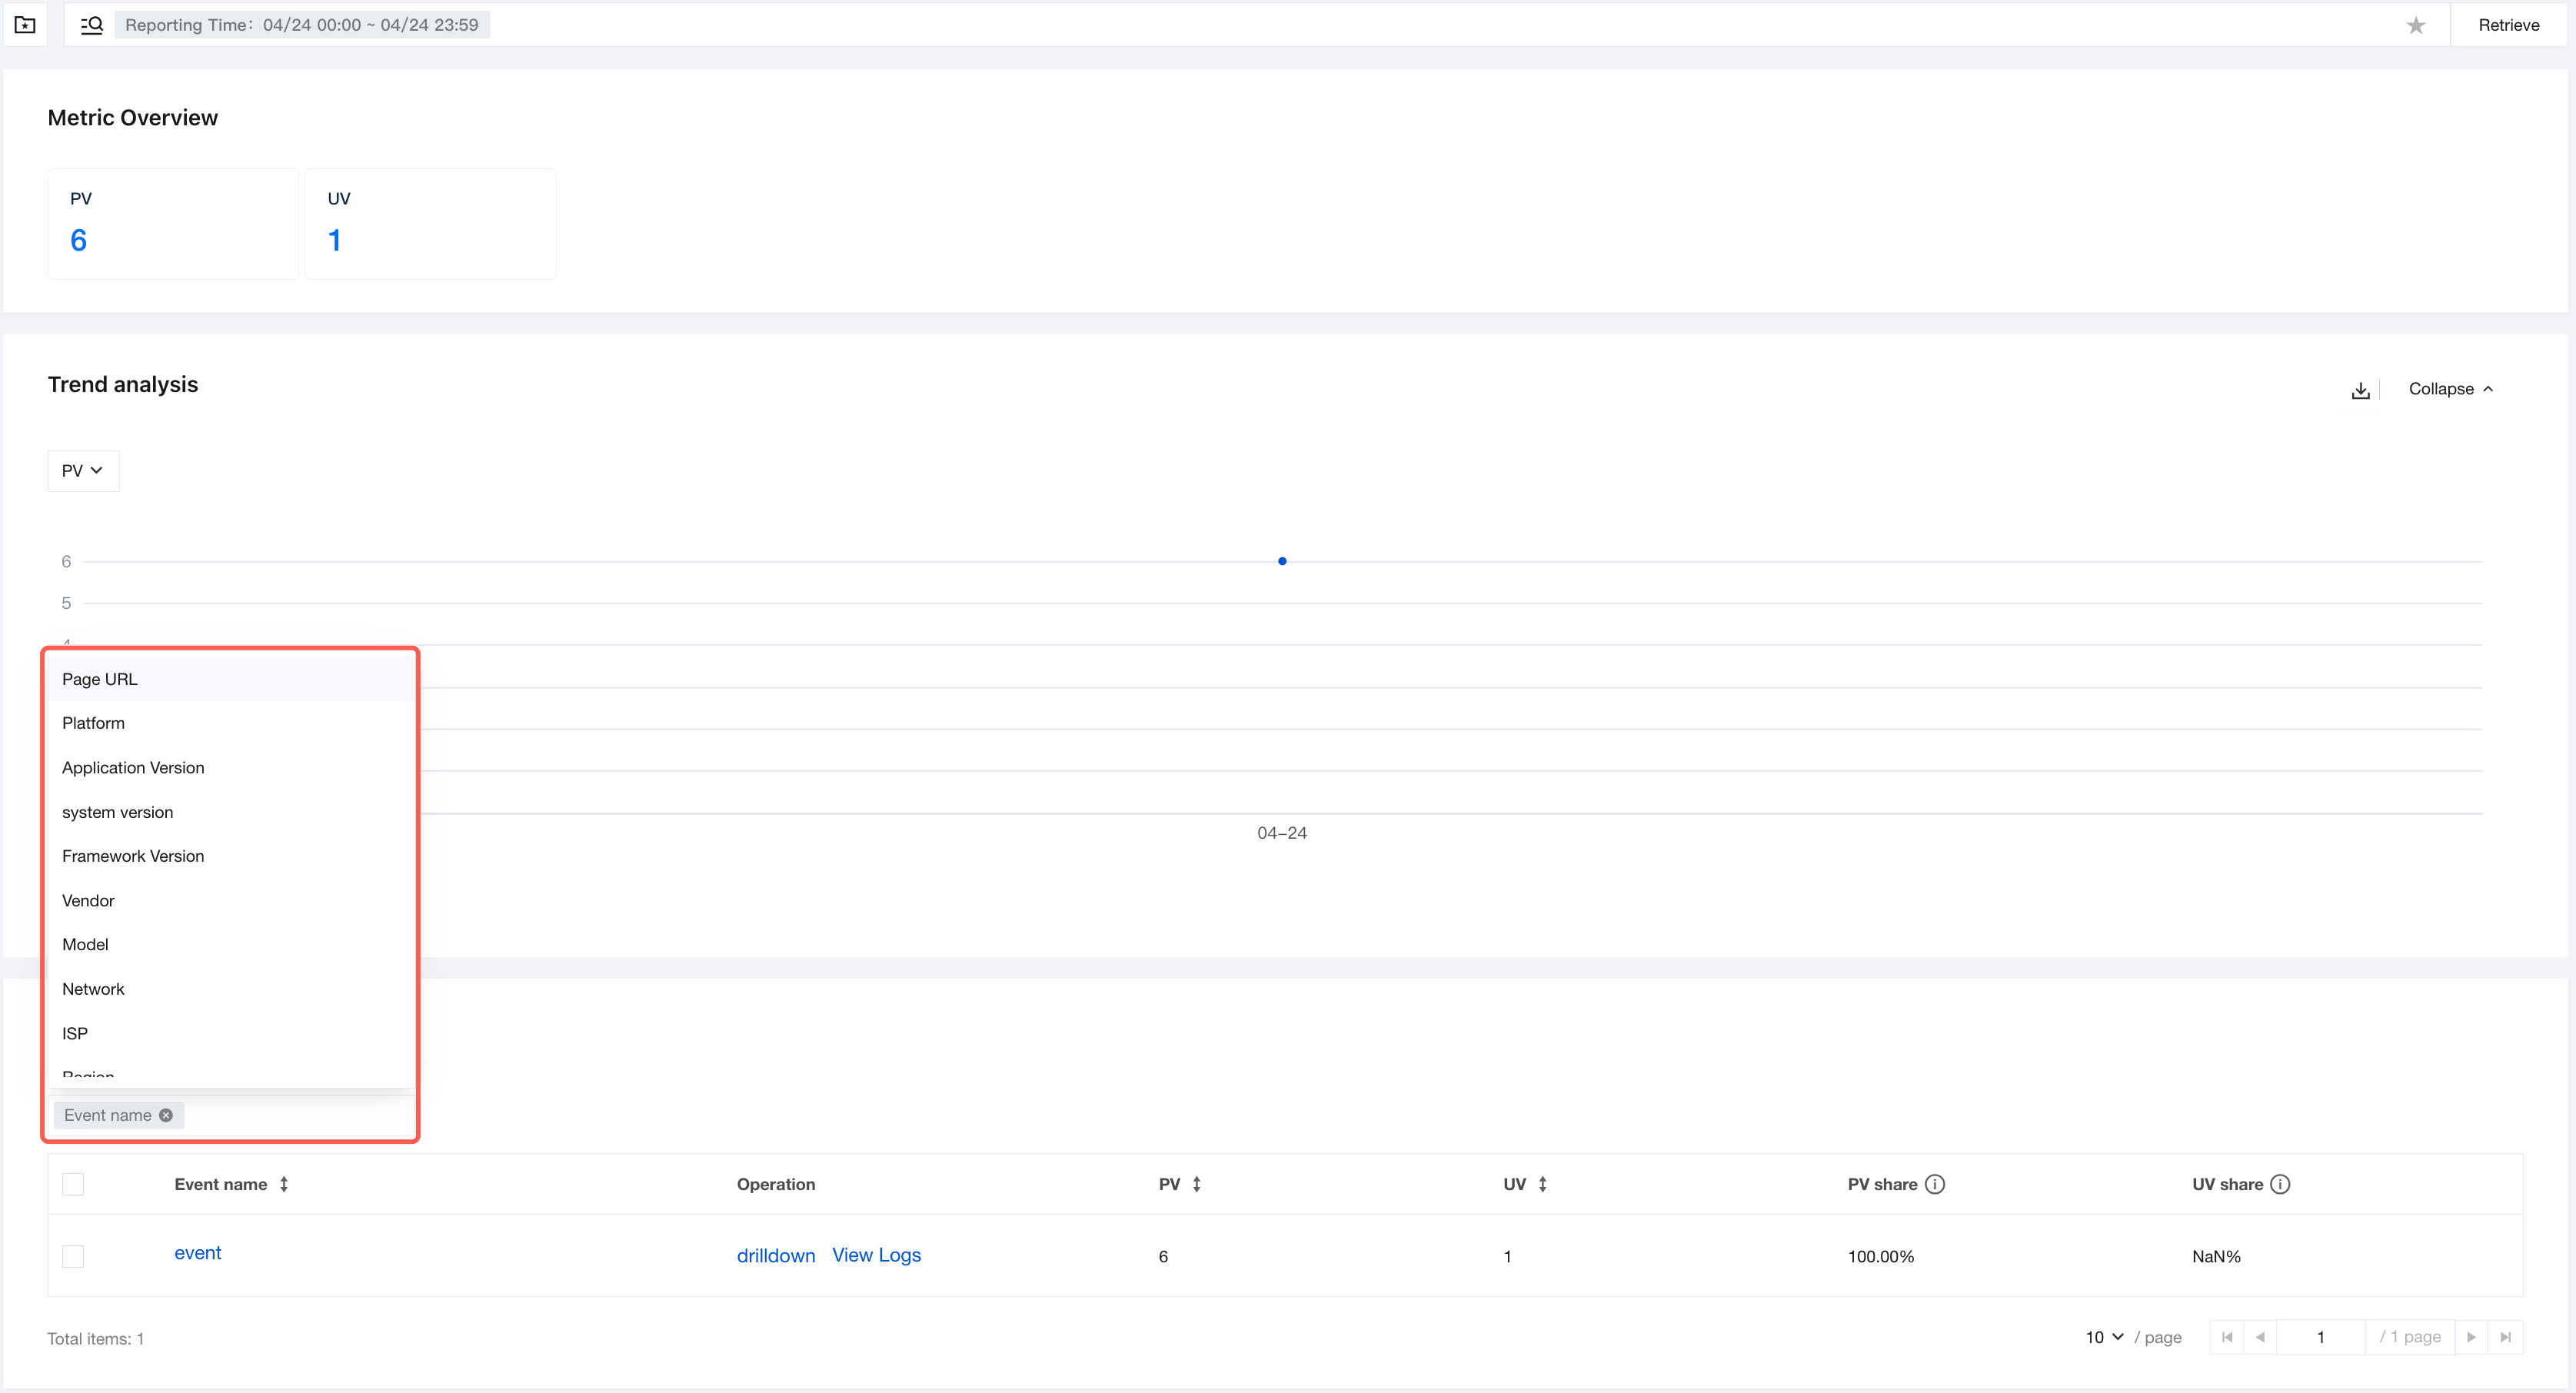
List View: The table displays data by Event Name by default, including PV, UV, PV Proportion, and UV Proportion. In the example below, XXX Request Successful (PV Proportion 54.32%) is the most frequent event, while renderer-main-error (PV Proportion 33.33%) is the primary abnormal event. Click the dropdown on the left to select other metrics.
Drill Down and Log Viewing:
Click the drilldown in the operation column to go to the multi-dimensional analysis of the event, for example, drill down by system version or application version.
Click View Logs in the operation column to obtain detailed reported logs for the event, such as error messages and device information, directly identifying the technical cause.
Help and Support
Was this page helpful?
You can also Contact sales or Submit a Ticket for help.
Help us improve! Rate your documentation experience in 5 mins.
Feedback