Overview
In the past, it was not easy for users to troubleshoot Tencent Kubernetes Engine (TKE) problems. A Kubernetes cluster in a production environment is usually a very complex system. The bottom layer accommodates a variety of heterogeneous hosts, networks, storage devices, and other cloud infrastructure. The upper layer carries a large amount of application load. In the middle, various native components (e.g., Scheduler and Kubelet) and third-party components (e.g., various operators) run to manage and schedule infrastructure and applications. In addition, personnel with different roles frequently deploy applications, add nodes, and perform other operations on the cluster. Therefore, in the cluster OPS scenario, users often encounter the following problems:
An application in the cluster was deleted. Who did it?
The load of apiserver suddenly becomes high and a large number of access failures occur. What happened in the cluster?
Cluster nodes are cordoned off. Who did it and when did it happen?
Cloud Log Service (CLS) is now interconnected with Tencent Kubernetes Engine (TKE). Kubernetes audit logs will be an important tool to help users quickly solve the above mentioned problems. Audit Log Definition
In Kubernetes, all cluster status queries and changes are implemented by sending requests to the apiserver. Audit logs are structured logs with configurable policies generated by Kube-apiserver and record apiserver access events. You can view and analyze audit logs to trace cluster status changes, understand the health of the cluster, troubleshoot exceptions, and discover potential security and performance risks of the cluster, and so on.
Audit Log Fields
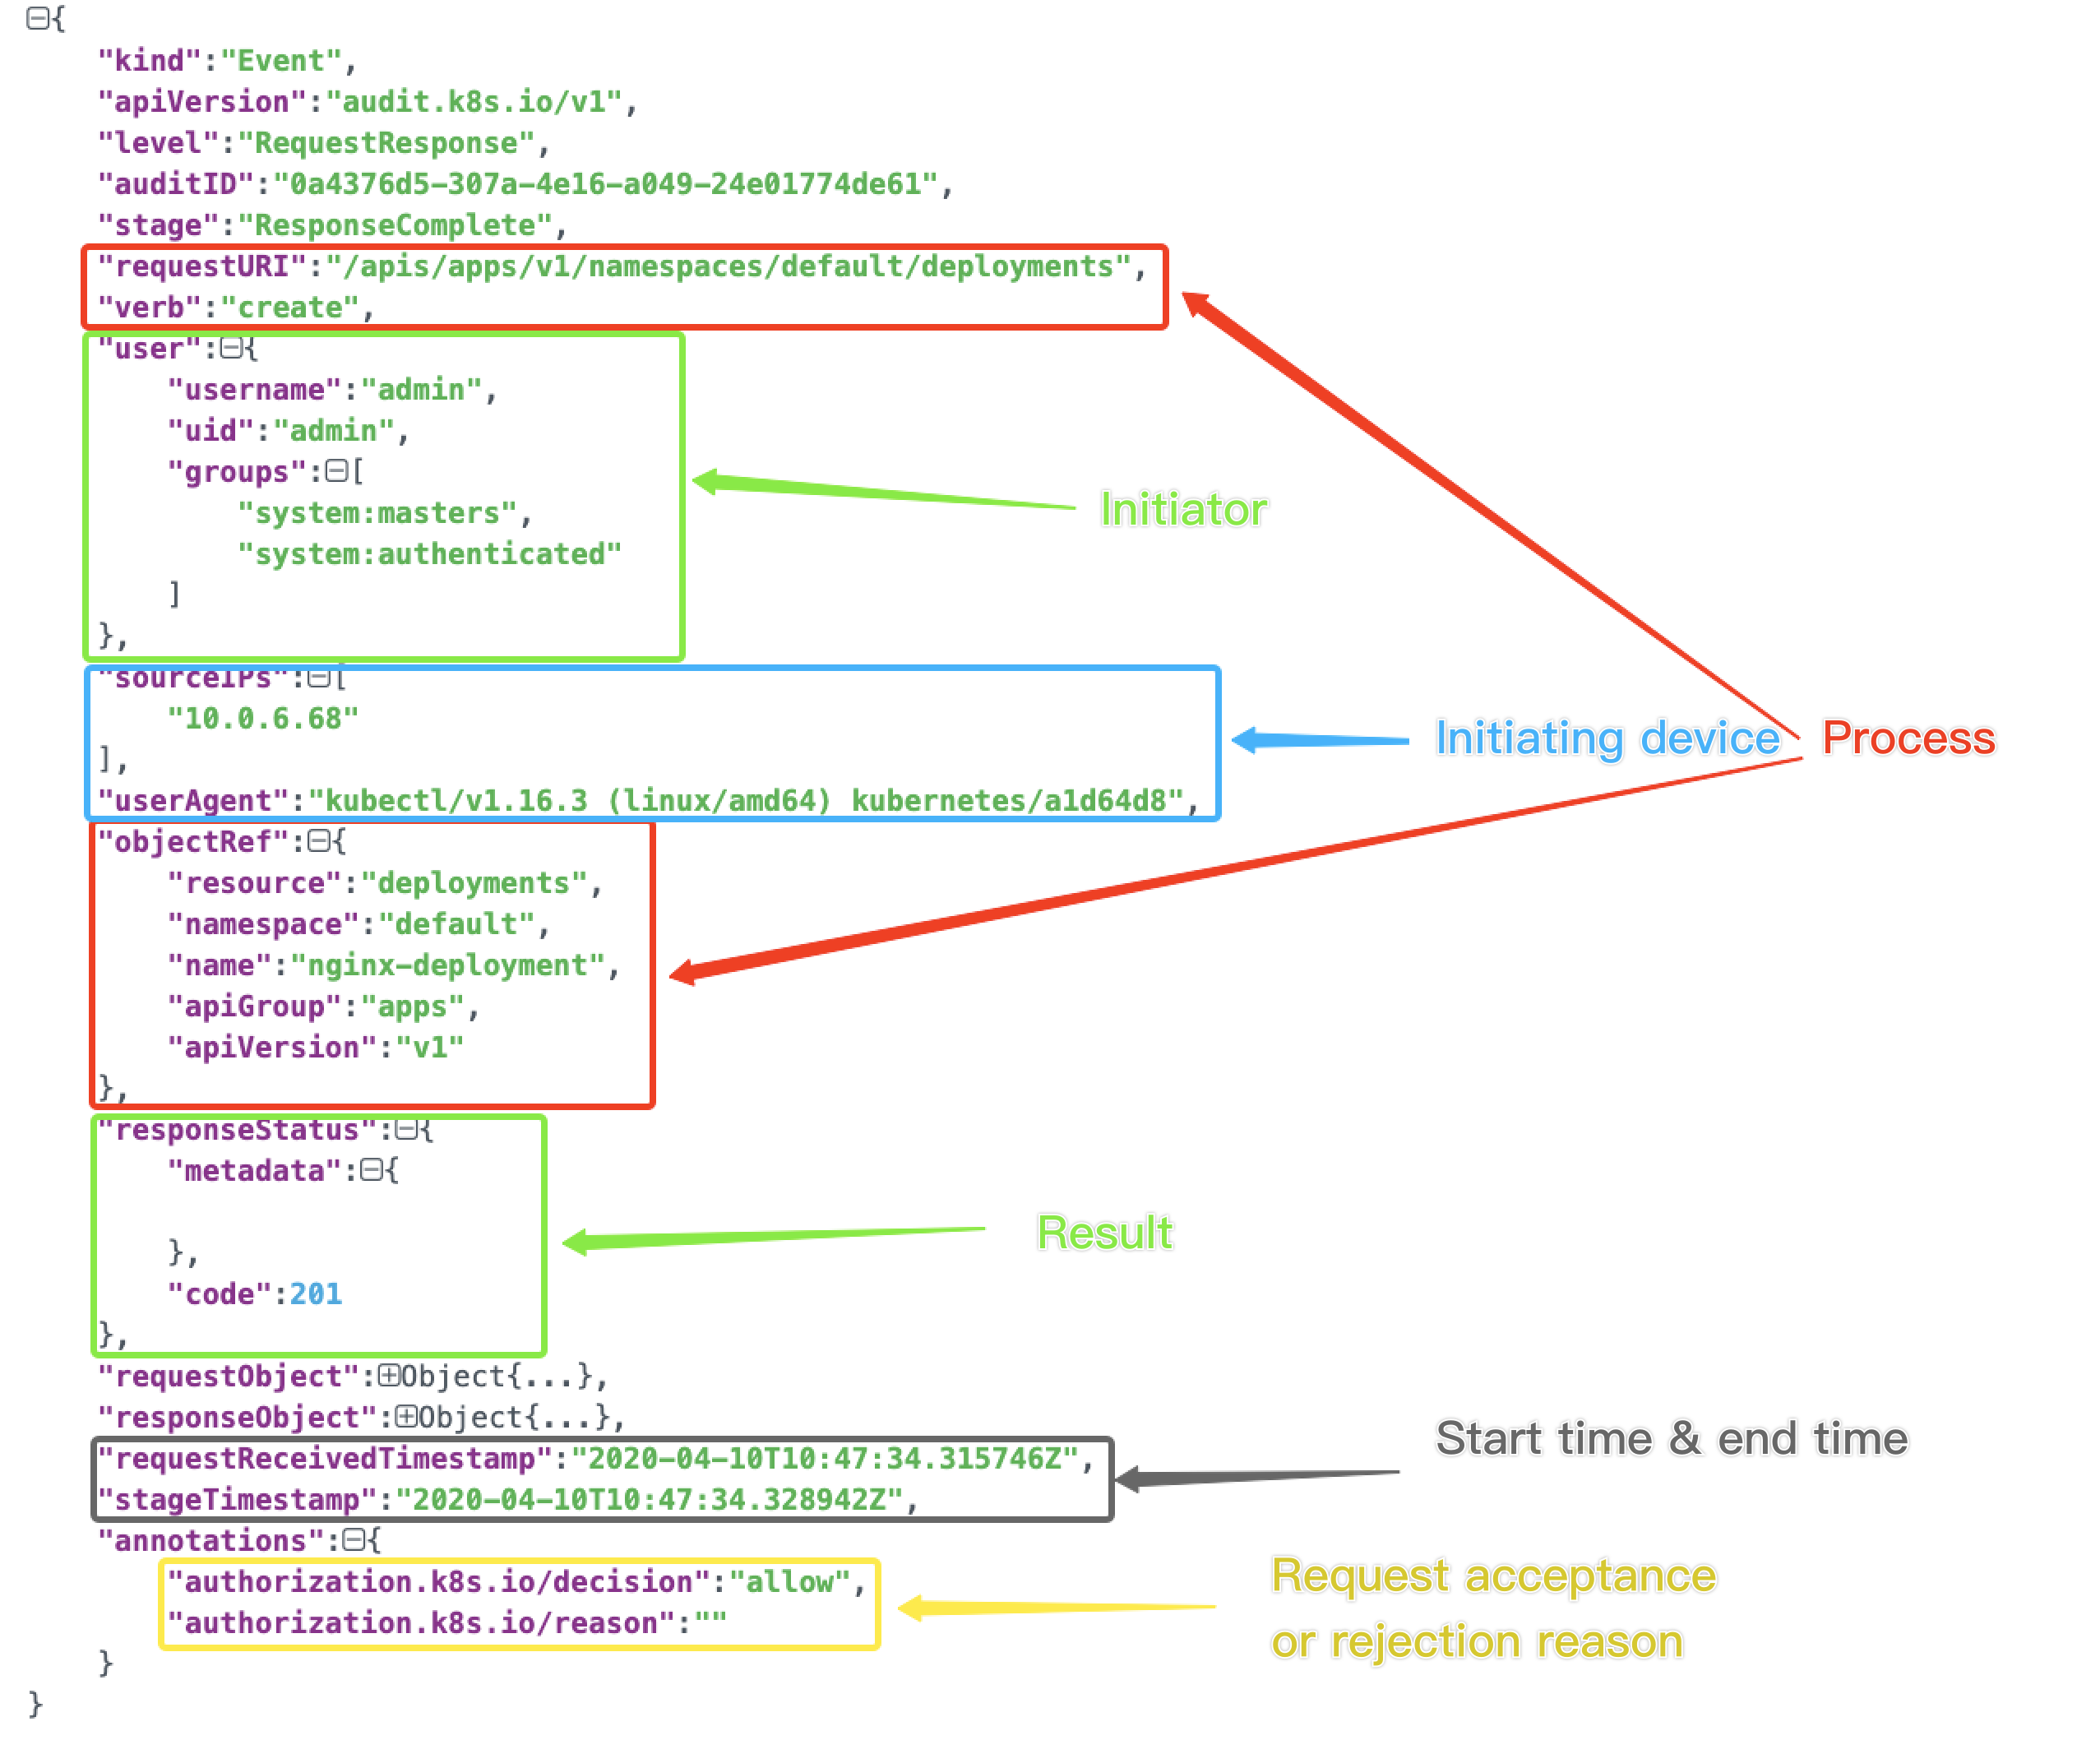
Each audit log is a structured record in JSON format, and includes three parts: metadata, requestObject, and responseObject. The metadata is a required part (it contains the request context information, such as who initiated the request, where it was initiated, and the accessed URI). requestObject and responseObject are optional, depending on the audit level.
Using Audit Logs for Troubleshooting
CLS provides a one-stop service for Kubernetes audit logs, including collection, storage, search, and analysis capabilities. You only need to enable the cluster audit log feature with a few clicks to obtain a visual audit log analysis dashboard out of the box. With visual charts, you can easily solve most common OPS problems via the console.
Prerequisites
You have purchased TKE and enabled the cluster audit log feature. For more information, please see Directions. Scenario 1: An application in the cluster was deleted. Who did it?
2. On the left sidebar, choose Cluster OPS > Auditing Search.
3. On the Auditing Search page, click the K8s Object Operation Overview tab and specify the operation type as delete and specify the resource object nginx.
The following figure shows an example of the query result.
As shown in the above figure, account 10001****7138 deleted the NGINX application. You can use the account ID to query the detailed information about this account in CAM > User List.
Scenario 2: The load of apiserver suddenly becomes high and a large number of access failures occur. What happened in the cluster?
2. On the left sidebar, choose Cluster OPS > Auditing Search.
3. On the Auditing Search page, click the Aggregation Search tab. The tab page displays the trend of apiserver access in multiple dimensions such as user, operation type, and status code.
As shown in the above figures, you can find that user tke-kube-state-metrics has the maximum number of accesses; in the Trend of Operation Type Distribution chart, most operations are list operations; and in the Trend of Status Code Distribution chart, most return codes are 403. Then use the tke-kube-state-metrics keyword to search for logs.
Combining with business logs, you can find that tke-kube-state-metrics frequently sends requests to the apiserver due to RBAC permission issues, resulting in a sharp increase in apiserver access.
Scenario 3: Cluster nodes are cordoned off. Who did it and when did it happen?
2. On the left sidebar, choose Cluster OPS > Auditing Search.
3. On the Auditing Search page, click the Node Operation Overview tab, and enter the name of the cordoned node on the tab page.
The following figure shows an example of the query result.
As shown in the above figure, account 10001****7138 cordoned off the node 172.16.18.13 at 2020-11-30T06:22:18.
