Tencent Cloud Flow Logs (FL) provides a full-time, full-flow, and non-intrusive traffic collection service. It enables you to store and analyze the collected network traffic in real time for troubleshooting, compliance auditing, architecture optimization, and security detection.
You can create a flow log within the specified collection range (such as ENI, NAT Gateway, and cross-region CCN traffic) to collect inbound/outbound traffic within the range.
If you have not yet collected FL to Cloud Log Service (CLS), you can use the Demo log topic provided for free by CLS to experience this feature. For directions, see Use Demo Log to Quickly Experience CLS.
Example
Using CLS to analyze a CCN flow log
FL is interconnected with CLS, so you can ship CCN flow log data to CLS in real time to further use the search and SQL analysis capabilities of CLS to meet your personalized real-time log analysis needs in different scenarios:
Push-button log shipping
Analyzing tens of billions of log data entries within seconds
Visualizing real-time logs on dashboards
Real-time alarm reporting in 1 minute
Log Field Description
FL of Cloud Connect Network Cross-Region Traffic
Other Types of FL
FL will record network flow filtered by the Quintuple + Traffic Source Region + Traffic Target Region rule in a specific capture window. This means that only FL that meets the rule in the capture window will be recorded as FL of Cloud Connect Network Cross-Region Traffic.
Quintuple + Traffic Source Region + Traffic Target Region
The quintuple is a collection containing five parts: the source IP address, source port, target IP address, target port, and transport layer protocol.
Traffic Source Region refers to the region where Cloud Connect Network cross-region traffic is sent.
Traffic Target Region refers to the region where Cloud Connect Network cross-region traffic arrives.
Capture Window
This is a period of continuous time during which CLS aggregates data and then publishes flow log records. The capture window is about 1 minute, and the push time is about 5 minutes.
Field
Data Type
Description
version
text
Flow log version.
region-id
text
The region where logs are recorded.
ccn-id
text
Unique CCN instance ID. To get the information of your CCN instance, contact us.
srcaddr
text
Source IP.
dstaddr
text
Destination IP.
srcport
text
Traffic source port. This field will take effect only for UDP/TCP protocols and will be displayed as "-" for other protocols.
dstport
long
Traffic destination port. This field will take effect only for UDP/TCP protocols and will be displayed as "-" for other protocols.
Number of packets transferred in the capture window. This field will be displayed as "-" when log-status is NODATA.
bytes
long
Number of bytes transferred in the capture window. This field will be displayed as "-" when log-status is NODATA.
start
long
The timestamp when the first packet is received in the current capture window. If there are no packets in the capture window, it will be displayed as the start time of the capture window in Unix seconds.
end
long
The timestamp when the last packet is received in the current capture window. If there are no packets in the capture window, it will be displayed as the end time of the capture window in Unix seconds.
action
text
Operation associated with the traffic:
ACCEPT: Cross-region traffic normally forwarded over CCN.
REJECT: Cross-region traffic prevented from being forwarded due to traffic throttling.
log-status
text
Logging status of the flow log. Valid values:
OK: Data is normally logged to the specified destination.
NODATA: There was no inbound or outbound network flow in the capture window, in which case both the packets and bytes fields will be displayed as -1.
Flow logs record the network flow filtered by quintuple rules in the specified capture window.
Quintuple
That is a collection composed of the sourceIP address, source port, target IP address, target port, and transport layer protocol.
Capture Window
This is a period of continuous time during which CLS aggregates data and then publishes flow log records. The capture window is about 5 minute, and the push time is about 5 minutes.
Field
Description
version
Flow log version.
account-id
Account AppID of the flow logs.
interface-id
ENI ID.
srcaddr
Source IP address.
dstaddr
Target IP address.
srcport
The source port of traffic. When the traffic is the ICMP protocol, this field represents the ICMP ID.
dstport
The target port of traffic. When the traffic is ICMP protocol, this field represents a combination of ICMP type (high 8 bits) and code (low 8 bits).
protocol
The IANA protocol number of traffic. For more information, go to the assigned Internet Protocol number.
packets
This shows the number of data packets transmitted in the capture window.
bytes
This shows the bytes transmitted in the capture window.
start
This shows the start time of the capture window, in the Unix second format.
end
This shows the end time of the capture window, in the Unix second format.
action
Operations associated with the traffic:
ACCEPT: It shows the traffic allowed to be recorded by the security group or network ACL.
REJECT: It shows the traffic not allowed to be recorded by the security group or network ACL.
log-status
Log record status of the flow log:
OK: It indicates that data is successfully recorded to the specified target.
NODATA: It indicates that there is no incoming or outgoing network traffic in the capture window. In this case, packets and bytes fields will be displayed as -1.
SKIPDATA: It indicates that some flow log records were skipped in the capture window. This may be caused by internal capacity limits or internal errors.
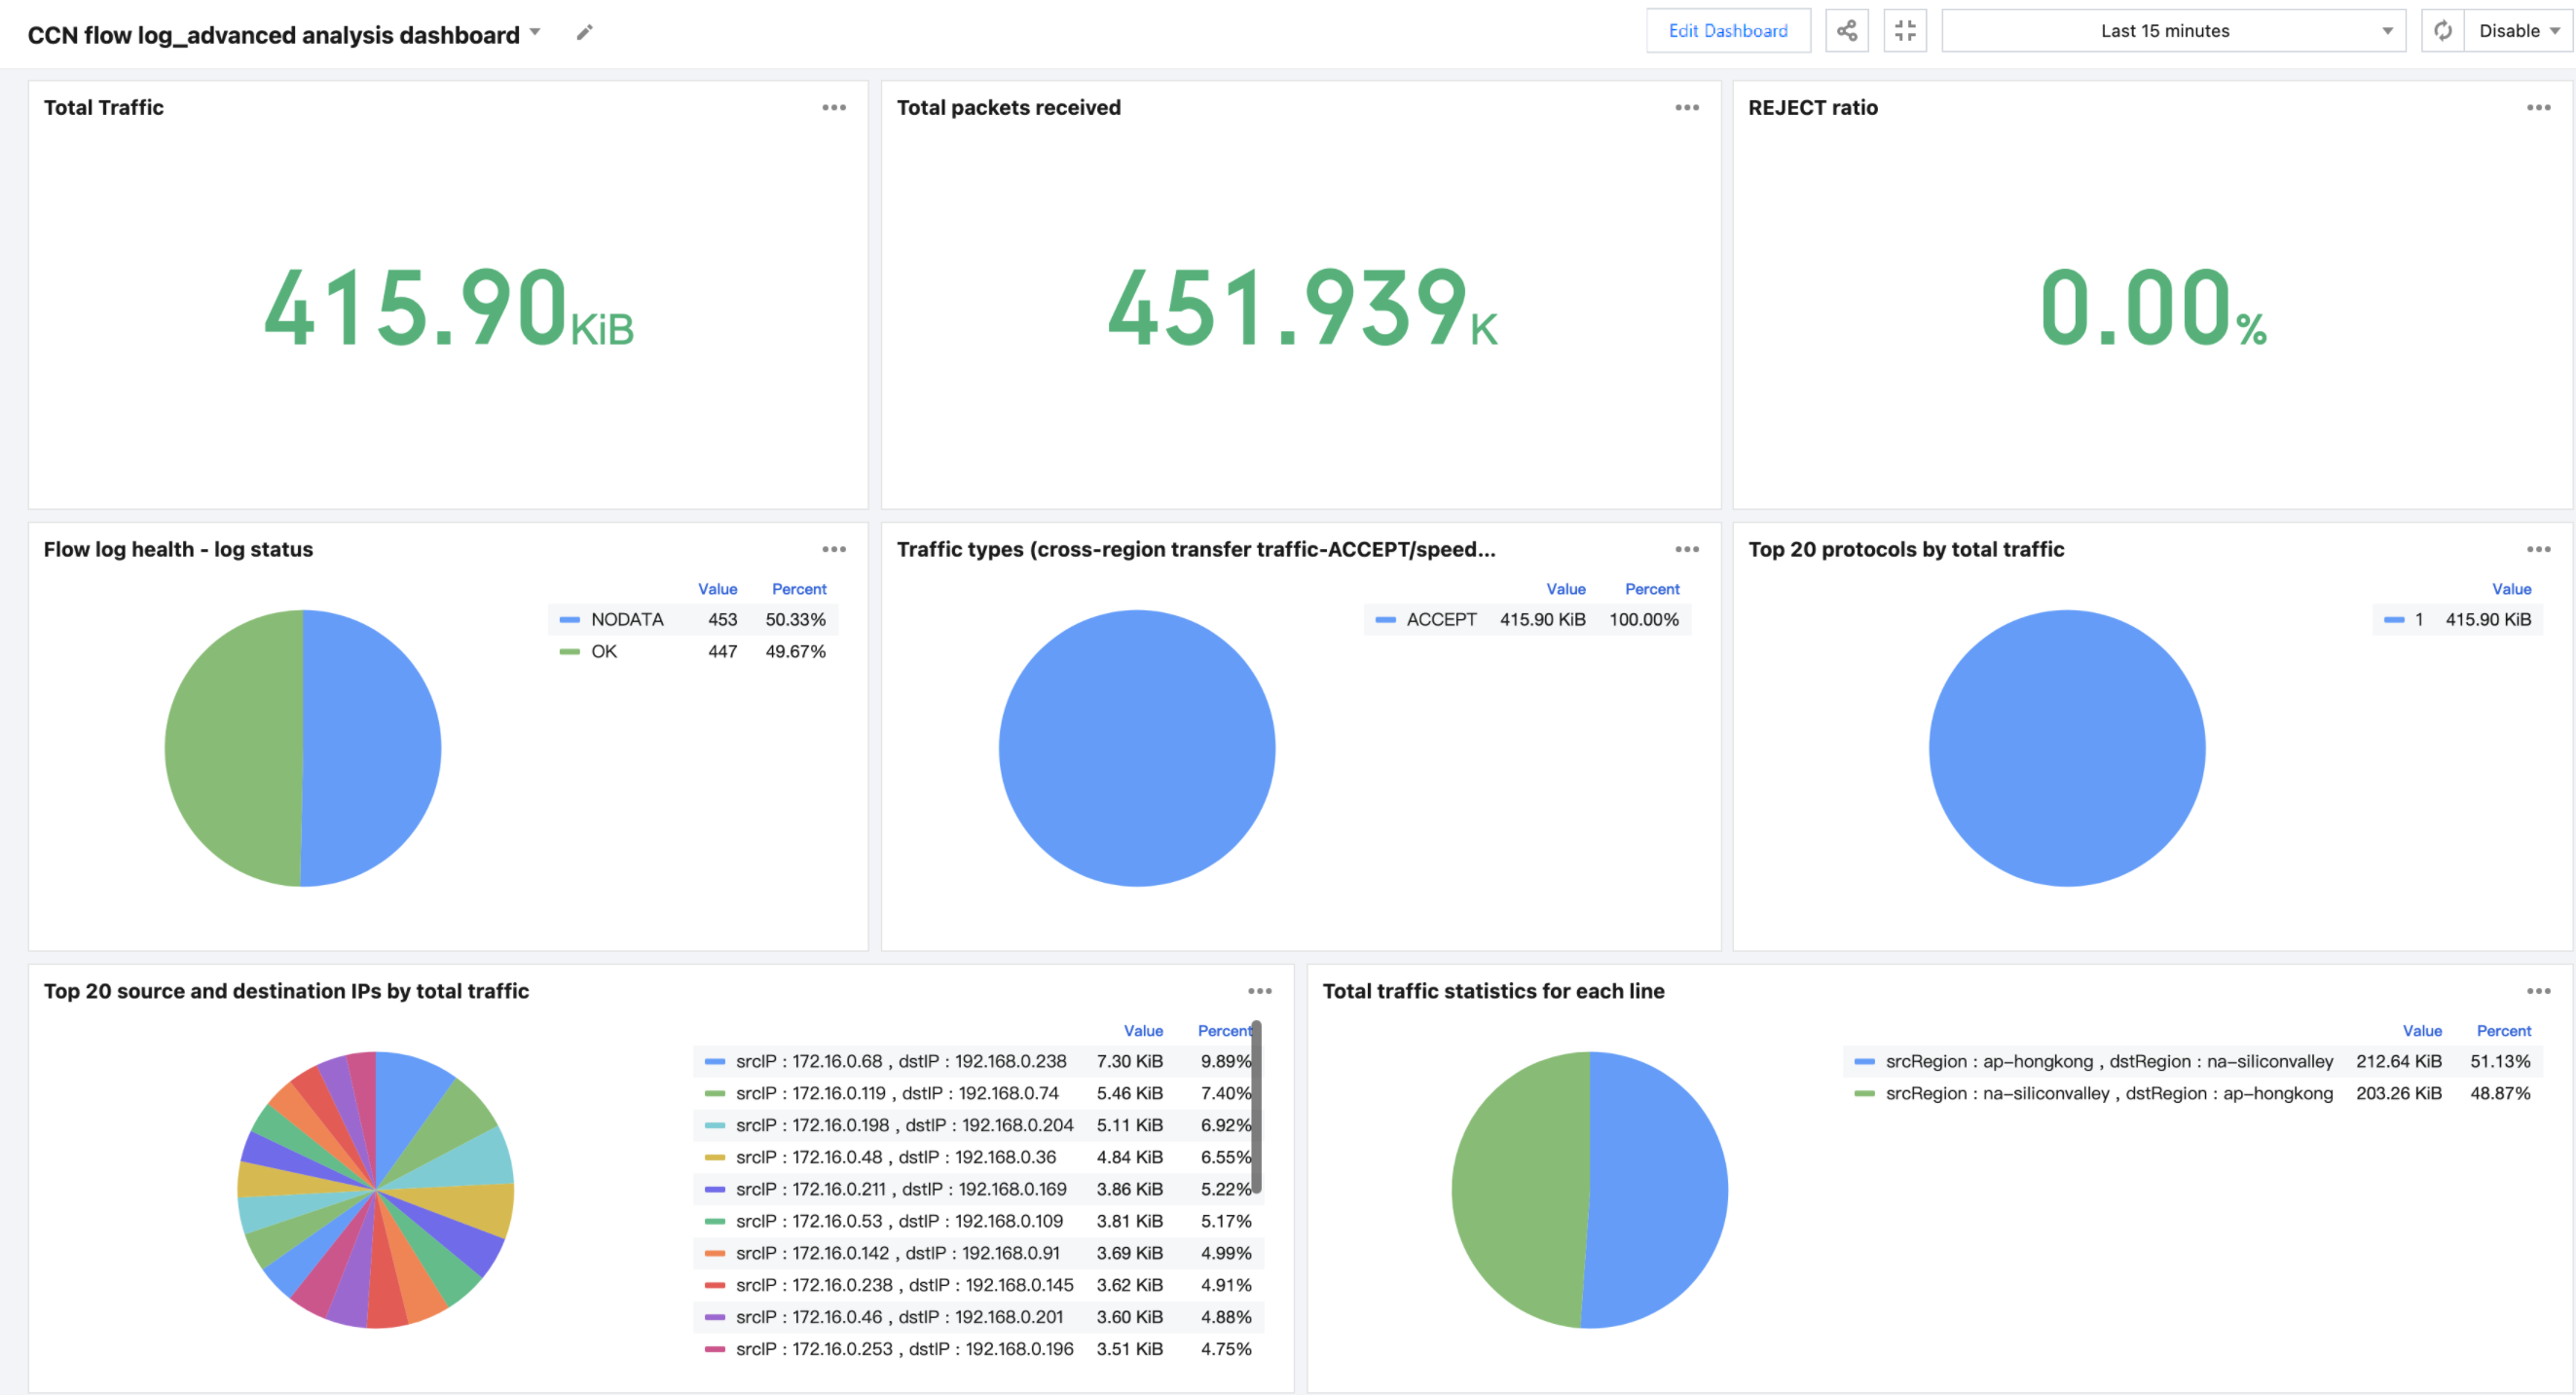
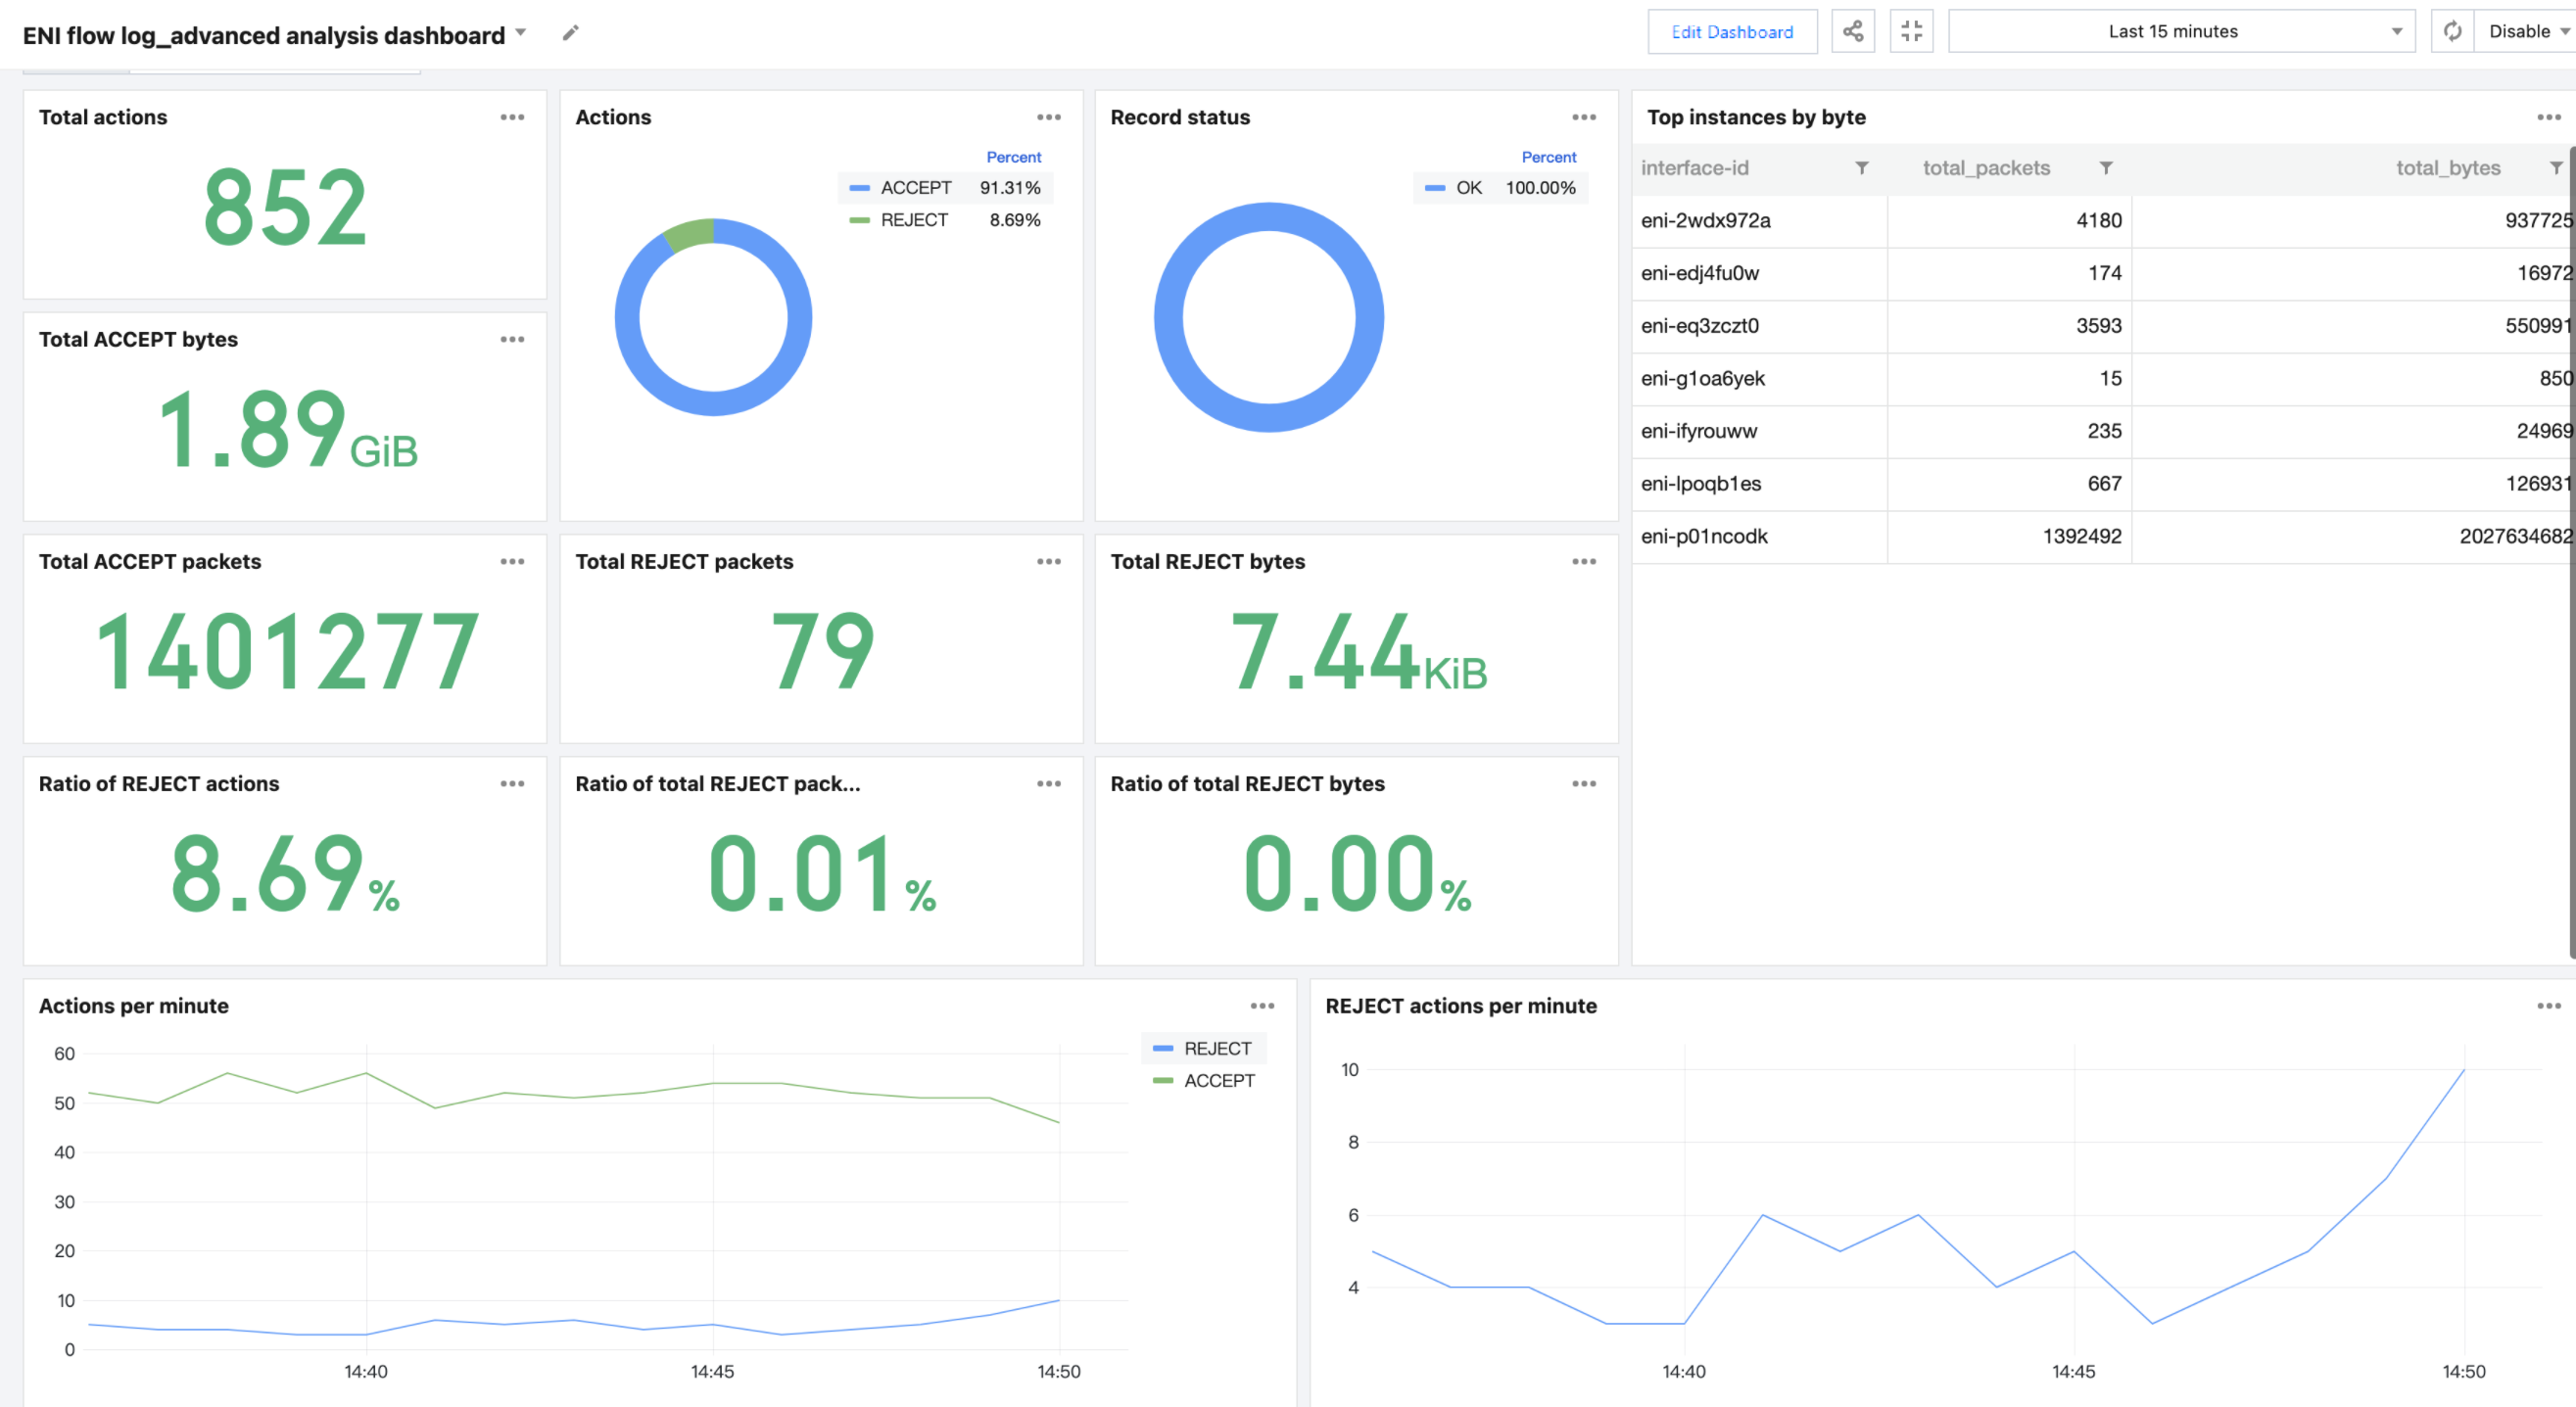
Preset Dashboard
CLS has preset common Cloud Connect Network and Elastic Network Interface flow log statistics as dashboards. You can quickly know the current network status through these dashboards.
Click Edit Dashboard in the upper right corner of the dashboard to edit based on the preset dashboard.
Configure Alarm
For example, if the bandwidth cap of 100 Mbps is set for the Cloud Connect Network Hong Kong (China) - Silicon Valley line, you need to monitor the current bandwidth usage. If the bandwidth is greater than or equal to 95 Mbps for ten consecutive minutes, an alarm will be triggered to adjust the bandwidth cap when necessary.
2. Enter the following statement in the execution statement, select a time range of 1 minute, and count the bandwidth usage of the Hong Kong (China) - Silicon Valley line in the past one minute. The bandwidth in the result of this execution statement is the one-minute bandwidth in Mbps.
log-status:OK AND srcregionid:ap-hongkong AND dstregionid:na-siliconvalley | select sum(bytes)/60.00*8/1000/1000 as bandwidth
3. The trigger condition is as follows: If the bandwidth is greater than or equal to 95 Mbps, the alarm condition is met.
$1.bandwidth > 95
4. Execution cycle: The system is executed every minute at a fixed frequency.
5. Alarm notification - alarm frequency: An alarm is always triggered if the trigger condition is met for 10 consecutive cycles. That is, if the bandwidth is greater than or equal to 95Mbps for 10 consecutive minutes, an alarm will be triggered.
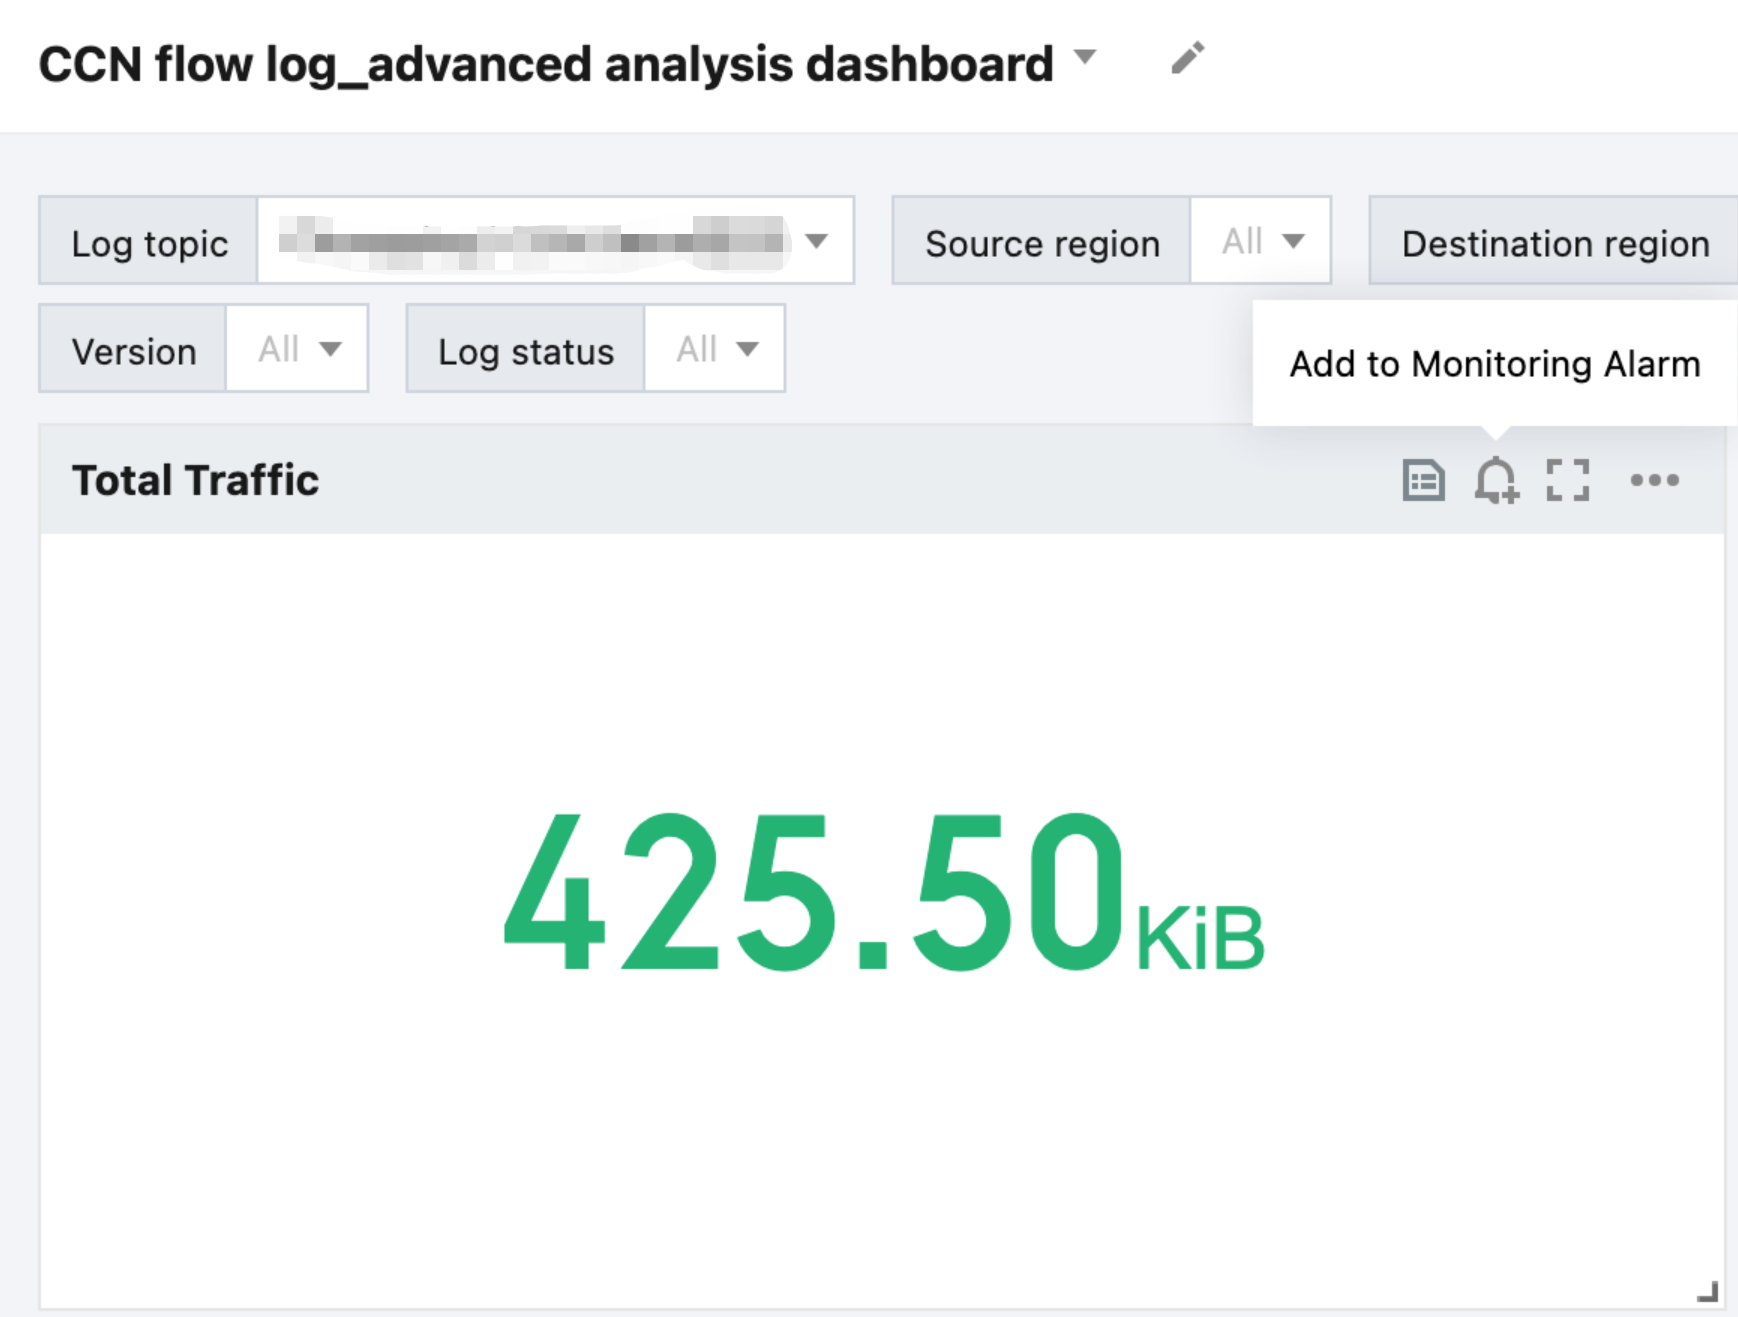
For charts in the preset dashboard, you can click Add to Monitoring and Alarming in the upper right corner to add the metrics in the chart to the alarm policy.