
Configuring Alarm

Last updated:2026-01-27 11:32:38
TDMQ for RocketMQ provides multiple monitoring metrics for running resources to monitor the running statuses of clusters. It also offers the alarm configuration feature for key metrics. You can configure alarm rules for monitoring metrics. Based on the created alarm rules, the system compares the monitoring metrics against the specified thresholds over a certain period. If a monitoring metric reaches the preset alarm threshold, Tencent Cloud Observability Platform (TCOP) will notify you through emails, Short Message Service (SMS) messages, WeChat messages, or phone calls. This allows you to take preventive or remedial actions in time. Proper configuration of alarm rules can help you enhance application robustness and reliability.
Alarm Configuration Recommendations
This section introduces key metrics that require special attention when you use TDMQ for RocketMQ, and provides alarm configuration recommendations for these metrics. You can configure alarm rules based on business requirements.
Resource Dimension | Metric | Recommended Alarm Configuration | Description |
Cluster | rocketmq_namespace_consumer_lag_messages(Count) | Set the statistical period to 1 minute. If the number of backlogged messages in 1 minute is greater than 1000 for 3 consecutive data points, trigger an alarm. | Excessive backlogged messages cause a rapid disk utilization increase. As a result, no more messages can be received, and the service stops. Scale-out is required. |
| rocketmq_namespace_expense_pull_limit_tps(Count/s) | Set the statistical period to 1 minute. If the throttled consumption TPS in 1 minute is greater than 0 for 3 consecutive data points, trigger an alarm. | Determine whether the cluster TPS exceeds the purchased traffic upper limit. Based on this, consider operations such as specification upgrades accordingly. |
| rocketmq_namespace_expense_send_limit_tps(Count/s) | Set the statistical period to 1 minute. If the throttled consumption TPS in 1 minute is greater than 0 for 3 consecutive data points, trigger an alarm. | Determine whether the cluster TPS exceeds the purchased traffic upper limit. Based on this, consider operations such as specification upgrades accordingly. |
| rocketmq5_public_network_in_drop_bits(Bit/s) | Set the statistics cycle to 1 minute. If the public network discarded inbound bandwidth in 1 minute is greater than 0 bit/s for 3 consecutive data points, trigger an alarm. | When the inbound traffic exceeds the public network bandwidth upper limit of the cluster, the excess traffic will be discarded. This indicates that the public network bandwidth may not meet business requirements, and scale-out is required. |
| rocketmq5_public_network_out_drop_bits(Bit/s) | Set the statistics cycle to 1 minute. If the public network discarded inbound bandwidth in 1 minute is greater than 0 bit/s for 3 consecutive data points, trigger an alarm. | When the outbound traffic exceeds the public network bandwidth upper limit of the cluster, the excess traffic will be discarded. This indicates that the public network bandwidth may not meet business requirements, and scale-out is required. |
Topic | rocketmq_msg_backlog | Set the statistical period to 1 minute. If the number of backlogged messages in 1 minute is greater than 1000 for 3 consecutive data points, trigger an alarm. | Excessive backlogged messages cause a rapid disk utilization increase. As a result, no more messages can be received, and the service stops. Scale-out is required. |
Group | rocketmq_group_consumer_lag_messages | Set the statistical period to 1 minute. If the number of backlogged messages in 1 minute is greater than 1000 for 3 consecutive data points, trigger an alarm. | Excessive backlogged messages cause a rapid disk utilization increase. As a result, no more messages can be received, and the service stops. Scale-out is required. |
| rocketmq_topic_group_group_diff | Set the statistics cycle to 1 minute. If the consumption processing lag time in 1 minute is greater than 1s for 3 consecutive data points, trigger an alarm. | The consumption processing lag time reflects the timeliness of message consumption by consumer clients. Excessive lag time indicates that consumers cannot consume messages or experience performance bottlenecks. |
| Dead letter message TPS | Set the statistical period to 1 minute. If the throttled consumption TPS in 1 minute is greater than 0 for 3 consecutive data points, trigger an alarm. | Number of new dead letter messages per second. Dead letter messages are messages that fail to be consumed after the maximum number of retries is reached, indicating that consumers cannot consume messages or experience business issues. |
Going to the Alarm Configuration Page
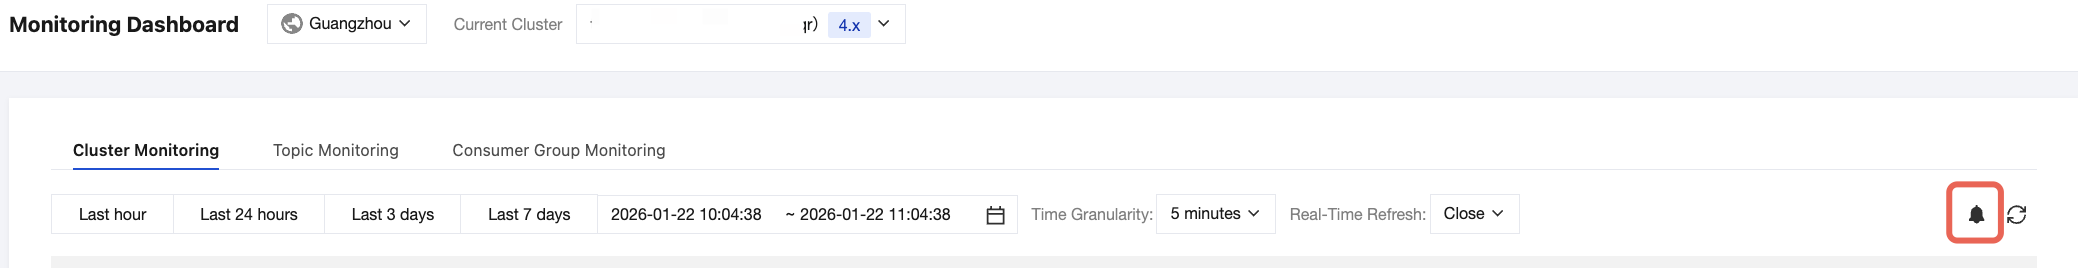
Entry 1: Log in to the TDMQ for RocketMQ console, go to the Monitoring Dashboard page, and click the alarm configuration icon in the upper-right corner of the monitoring chart to open the alarm configuration page. The default alarm object set on the page is the cluster corresponding to the monitoring chart before redirection.
Entry 2: Log in to the Tencent Cloud Observability Platform (TCOP) console. On the Alarm Configuration page, you can view all preset policies and custom policies. Click Create Policy, and select Cloud Product Monitoring for Monitoring Type and TDMQ for Policy Type. For 5.x clusters, select RocketMQ5.x. For 4.x clusters, select RocketMQ4.x.
Configuring Alarm Rules
TDMQ for RocketMQ presets comprehensive default alarm policies. You can view and configure these policies on TCOP and make flexible adjustments to the default policies based on actual needs.
1. Go to the alarm policy configuration page, select rocketmq5.x or rocketmq4.x for Policy Type based on your cluster type.
2. Select the object for which you want to configure alarms.
Tag: You can batch filter resources by tag to configure alarm policies for them.
Alarm Target: Select the TDMQ for RocketMQ resources for which you need to configure alarm policies.
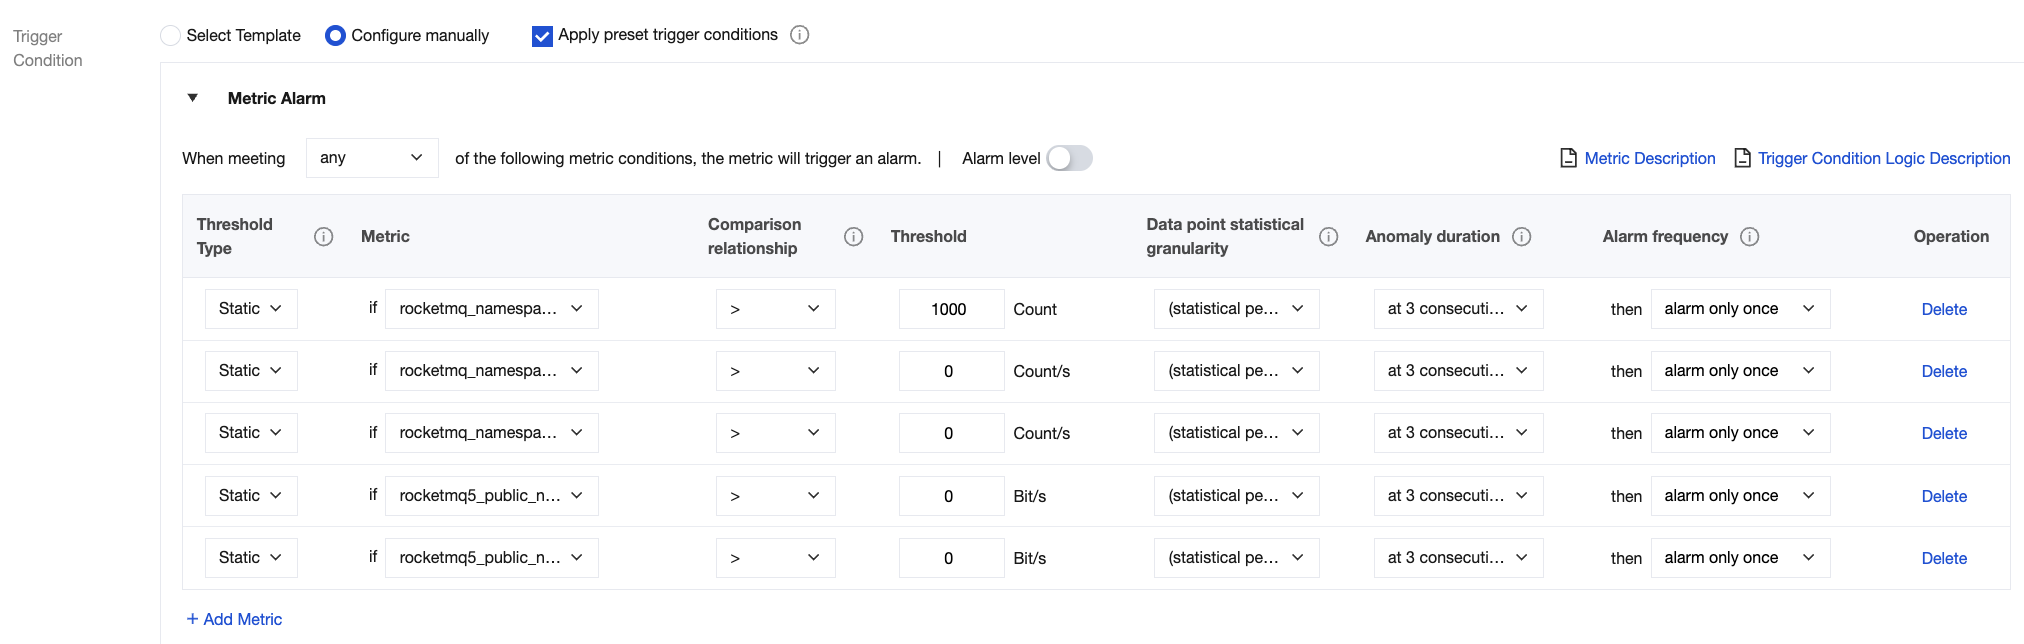
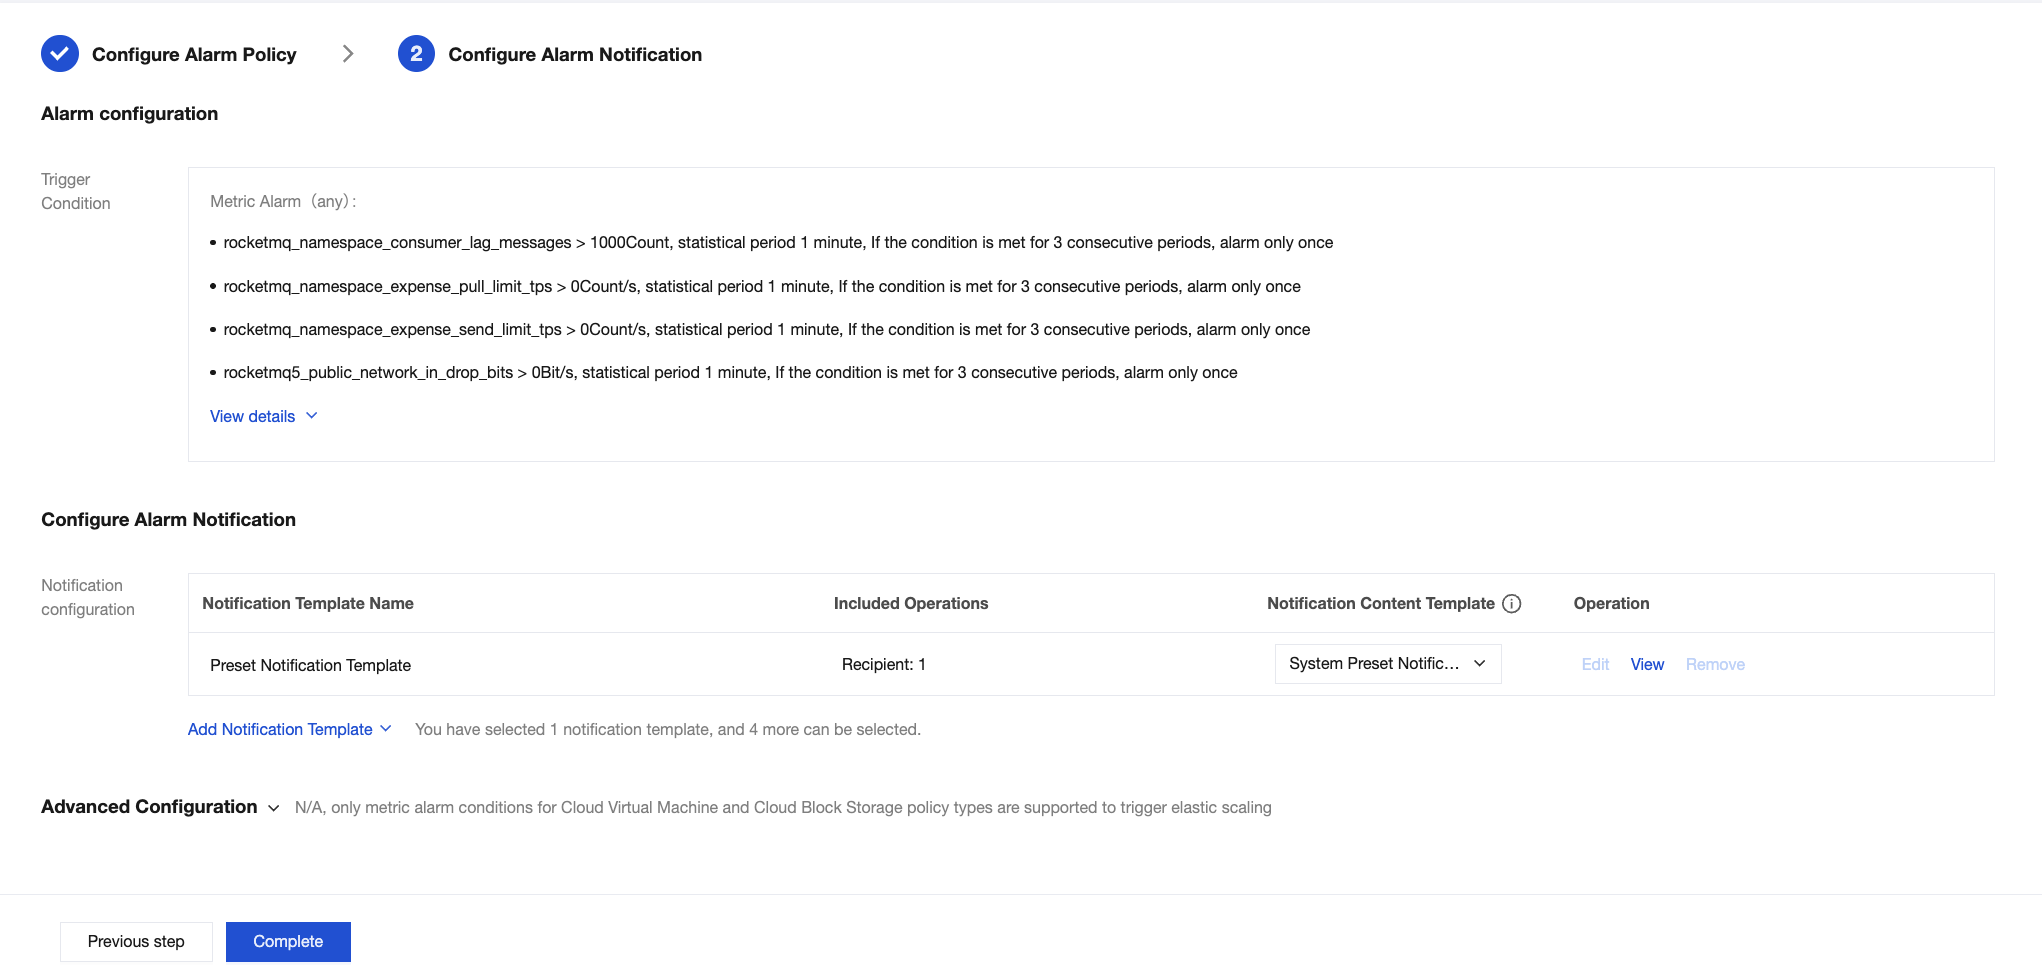
3. For Trigger Condition, keep the default settings of Configure manually. Check Apply preset trigger conditions. The system-preset alarm trigger conditions (as shown in the following figure) will appear. You can quickly configure alarm rules based on these default policies.
4. Click Next step: Configure Alarm Notification to configure alarm recipients.
1. After you select the policy type on the alarm policy configuration page, the policies available for the current resource type are automatically displayed. You can customize alarm policies based on default alarm policies and your actual business requirements.
2. Select the object for which you want to configure alarms.
Tag: You can batch filter resources by tag to configure alarm policies for them.
Alarm Target: Select the TDMQ for RocketMQ resources for which you need to configure alarm policies.
3. Set alarm trigger conditions. Select Template and Configure manually are supported. By default, Manual Configuration is selected.
Metric: Take Message production TPS as an example. If you select the 1-minute statistical granularity, an alarm will be triggered when the message production TPS exceeds the threshold for N consecutive data points within 1 minute.
Alarm Frequency: For example, Alarm triggered once every 30 minutes indicates that an alarm is triggered once every 30 minutes if a metric exceeds the threshold in multiple consecutive statistical periods. Another alarm will be triggered only if the metric exceeds the threshold again in the next 30 minutes.
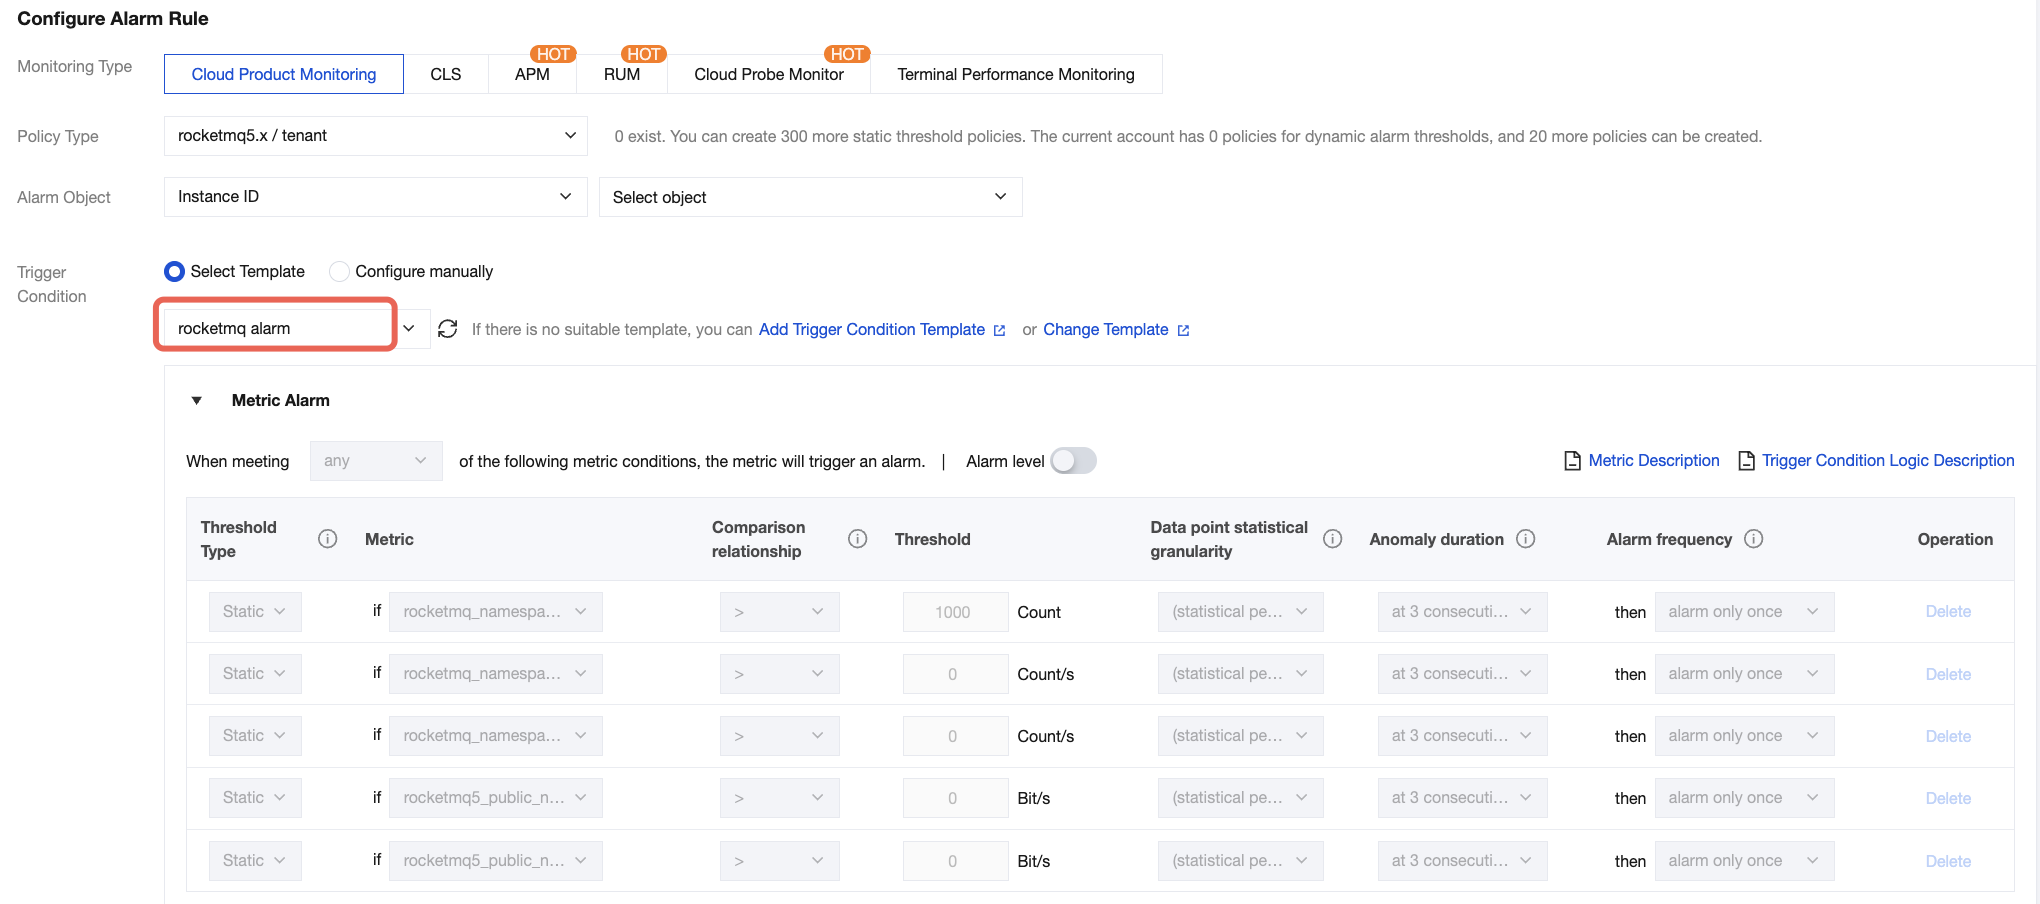
1. Select Select Template. Then, click Add Trigger Condition Template to redirect to the trigger condition template setup page.
2. In the upper-left corner, click Create Trigger Condition Template. On the New Template page, configure the alarm policy.
Policy Type: Select /rocketmq5.x or rocketMQ4.x based on your cluster type.
Trigger Condition: Set the alarm policy based on the alarm policy recommendations or your actual business requirements.
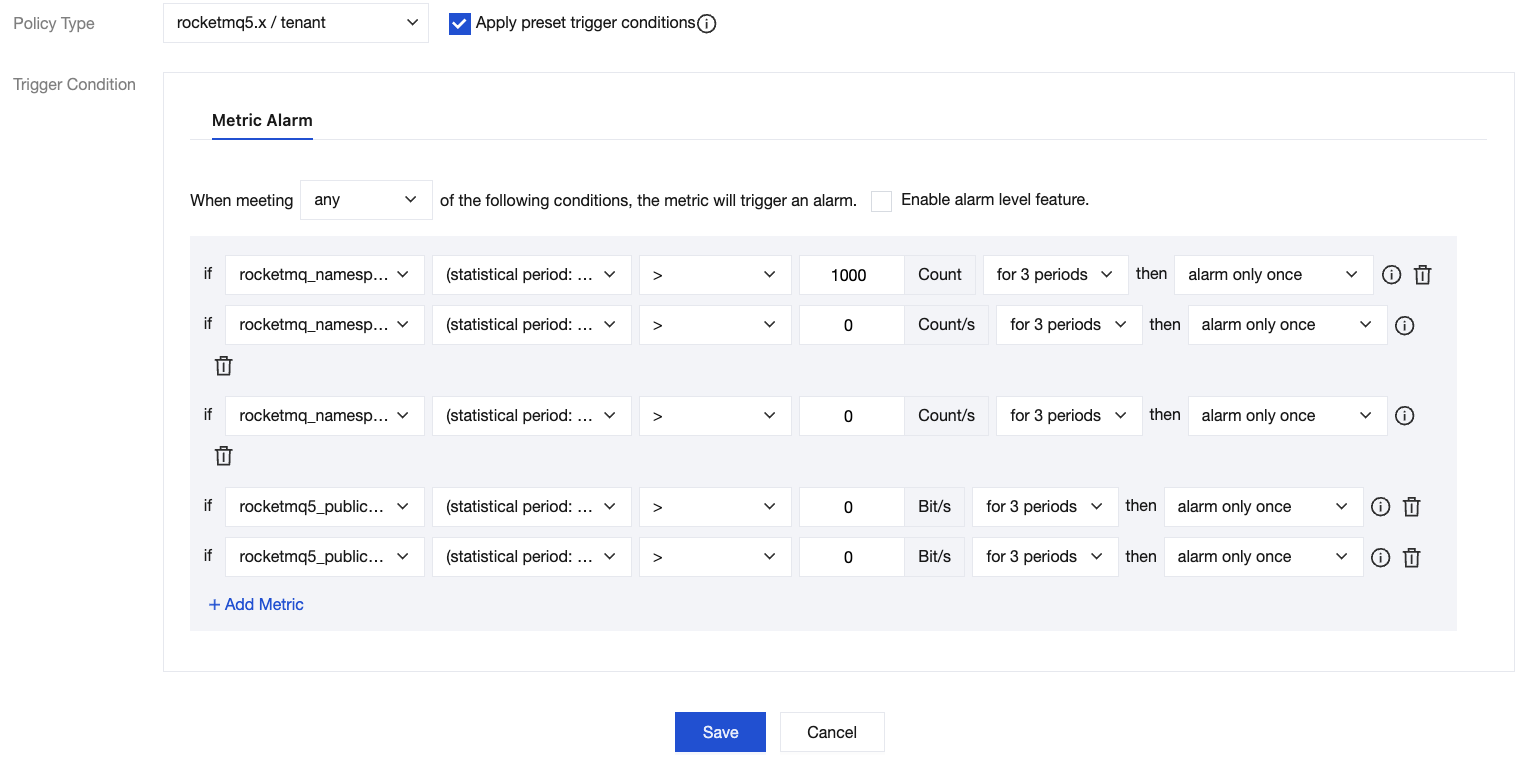
3. After confirmation, click Save. Return to the Create Alarm Policy page and click Refresh. The alarm policy template that you configured will be displayed.
Note:
4. Click Next step: Configure Alarm Notification to configure alarm recipients.
Configuring Alarm Notifications
On the Configure Alarm Notification page, you can select a system preset notification template. In normal cases, the alarm recipient in a preset template is the owner of the root account. If you need to notify the instance owner or other personnel, you can also click Add Notification Template to create a notification template and set alarm recipients and alarm receiving channels.
For detailed operations about how to create a notification template, see Creating a Notification Template.
Was this page helpful?
You can also Contact Sales or Submit a Ticket for help.
Yes
No
Feedback