
Querying General Messages

Last updated:2026-01-23 17:34:04
When a message is sent from a producer to the TDMQ for RocketMQ server and then consumed by a consumer, TDMQ for RocketMQ will record the entire transfer process of this message and display it as a message trace in the console.
The message trace records the entire process of a message from the producer to the TDMQ for RocketMQ server and finally to the consumer, including the consumed time (accurate to microseconds), execution result, producer's IP address, and consumer's IP address in each phase.
If you use a gRPC client of 5.0 or later versions for message production and consumption, you do not need to enable the message trace feature separately on the client.
If you use a client of 4.x or a remoting client of 5.0 or later versions, you need to enable the message trace feature on the client. The specific example for enabling the message trace feature on the client is as follows:
DefaultMQProducer producer = new DefaultMQProducer(namespace, groupName,// Access control list (ACL) permissions.new AclClientRPCHook(new SessionCredentials(AK, SK)), true, null);
// Instantiate a consumer.DefaultMQPushConsumer pushConsumer = new DefaultMQPushConsumer(NAMESPACE,groupName,new AclClientRPCHook(new SessionCredentials(AK, SK)),new AllocateMessageQueueAveragely(), true, null);
DefaultLitePullConsumer pullConsumer = new DefaultLitePullConsumer(NAMESPACE,groupName,new AclClientRPCHook(new SessionCredentials(AK, SK)));// Set the NameServer address.pullConsumer.setNamesrvAddr(NAMESERVER);pullConsumer.setConsumeFromWhere(ConsumeFromWhere.CONSUME_FROM_LAST_OFFSET);pullConsumer.setAutoCommit(false);pullConsumer.setEnableMsgTrace(true);pullConsumer.setCustomizedTraceTopic(null);
package com.lazycece.sbac.rocketmq.messagemodel;import lombok.extern.slf4j.Slf4j;import org.apache.rocketmq.spring.annotation.MessageModel;import org.apache.rocketmq.spring.annotation.RocketMQMessageListener;import org.apache.rocketmq.spring.core.RocketMQListener;import org.springframework.stereotype.Component;/*** @author lazycece* @date 2019/8/21*/@Slf4j@Componentpublic class MessageModelConsumer {@Component@RocketMQMessageListener(topic = "topic-message-model",consumerGroup = "message-model-consumer-group",enableMsgTrace = true,messageModel = MessageModel.CLUSTERING)public class ConsumerOne implements RocketMQListener<String> {@Overridepublic void onMessage(String message) {log.info("ConsumerOne: {}", message);}}}
Scenarios
To perform the following operations, you can use the message query feature in the TDMQ for RocketMQ console. You can view the content, parameters, and traces of a specific message by time dimension or by message ID, message key, or message tag found in the logs.
View the specific content and parameters of a message.
Check the IP address of the producer from which a message was sent, whether the message was sent successfully, and the time when the message arrived at the server.
Check whether a message has been persisted.
Check the consumers who have consumed a message, whether the consumption was successful, and the specific time when the message was consumed.
Check the processing latency of message queues for related messages when performance analysis of the distributed system is required.
Querying Messages
1. Log in to the TDMQ for RocketMQ console, and choose Message Query > General Query in the left sidebar.
2. On the Comprehensive Query page, select a region and enter the query conditions according to the prompts.
Cluster: Select the cluster where the topic to be queried is located.
Topic: Select the topic to be queried.
Time Range: Select the time range of the query. Available options: last 100 messages (displayed in chronological order by default), last 30 minutes, last 1 hour, last 6 hours, last 24 hours, last 3 days, and a custom time range.
Query Methods: The message query feature supports the following query methods:
Query all: This method is suitable for querying all messages.
By message ID: This is a precise query method, with quick speed and accurate matching.
By message key: This is a fuzzy query method suitable for scenarios where you have not recorded the message ID but have set a message key. The query results display up to 64 messages. You can narrow down the query time range to pinpoint the desired messages.
Query by message tag: This is a fuzzy query method suitable for scenarios where you have not recorded the message ID but have set a message tag. The query results display up to 64 messages. You can narrow down the query time range to pinpoint the desired messages.
3. Click Query. The list at the bottom of the page displays all query results with pagination.
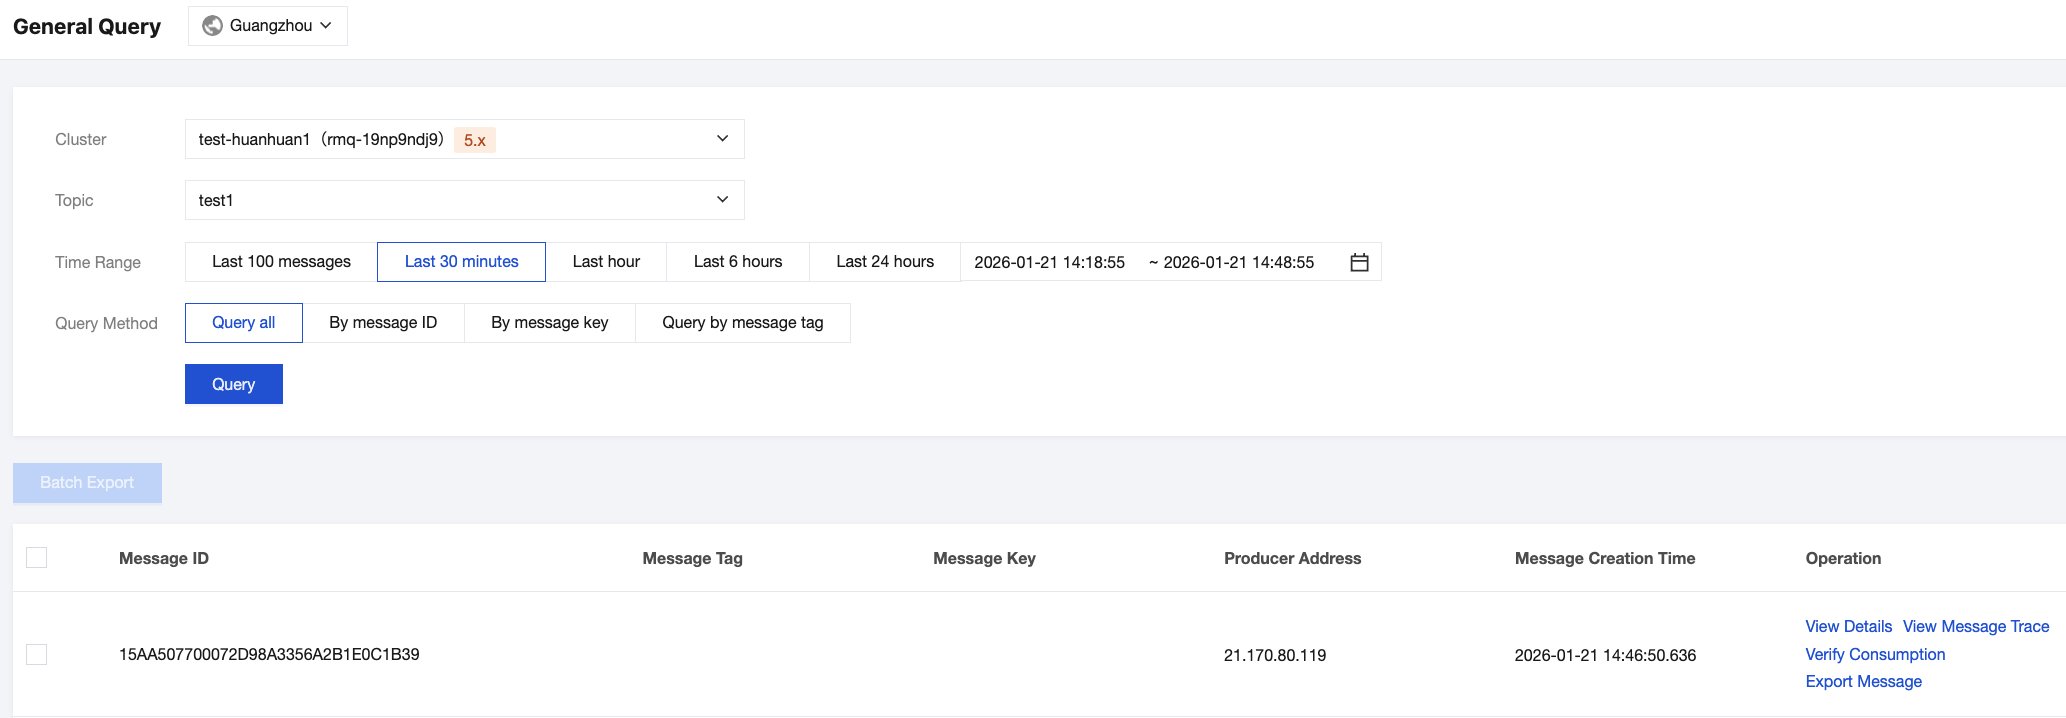
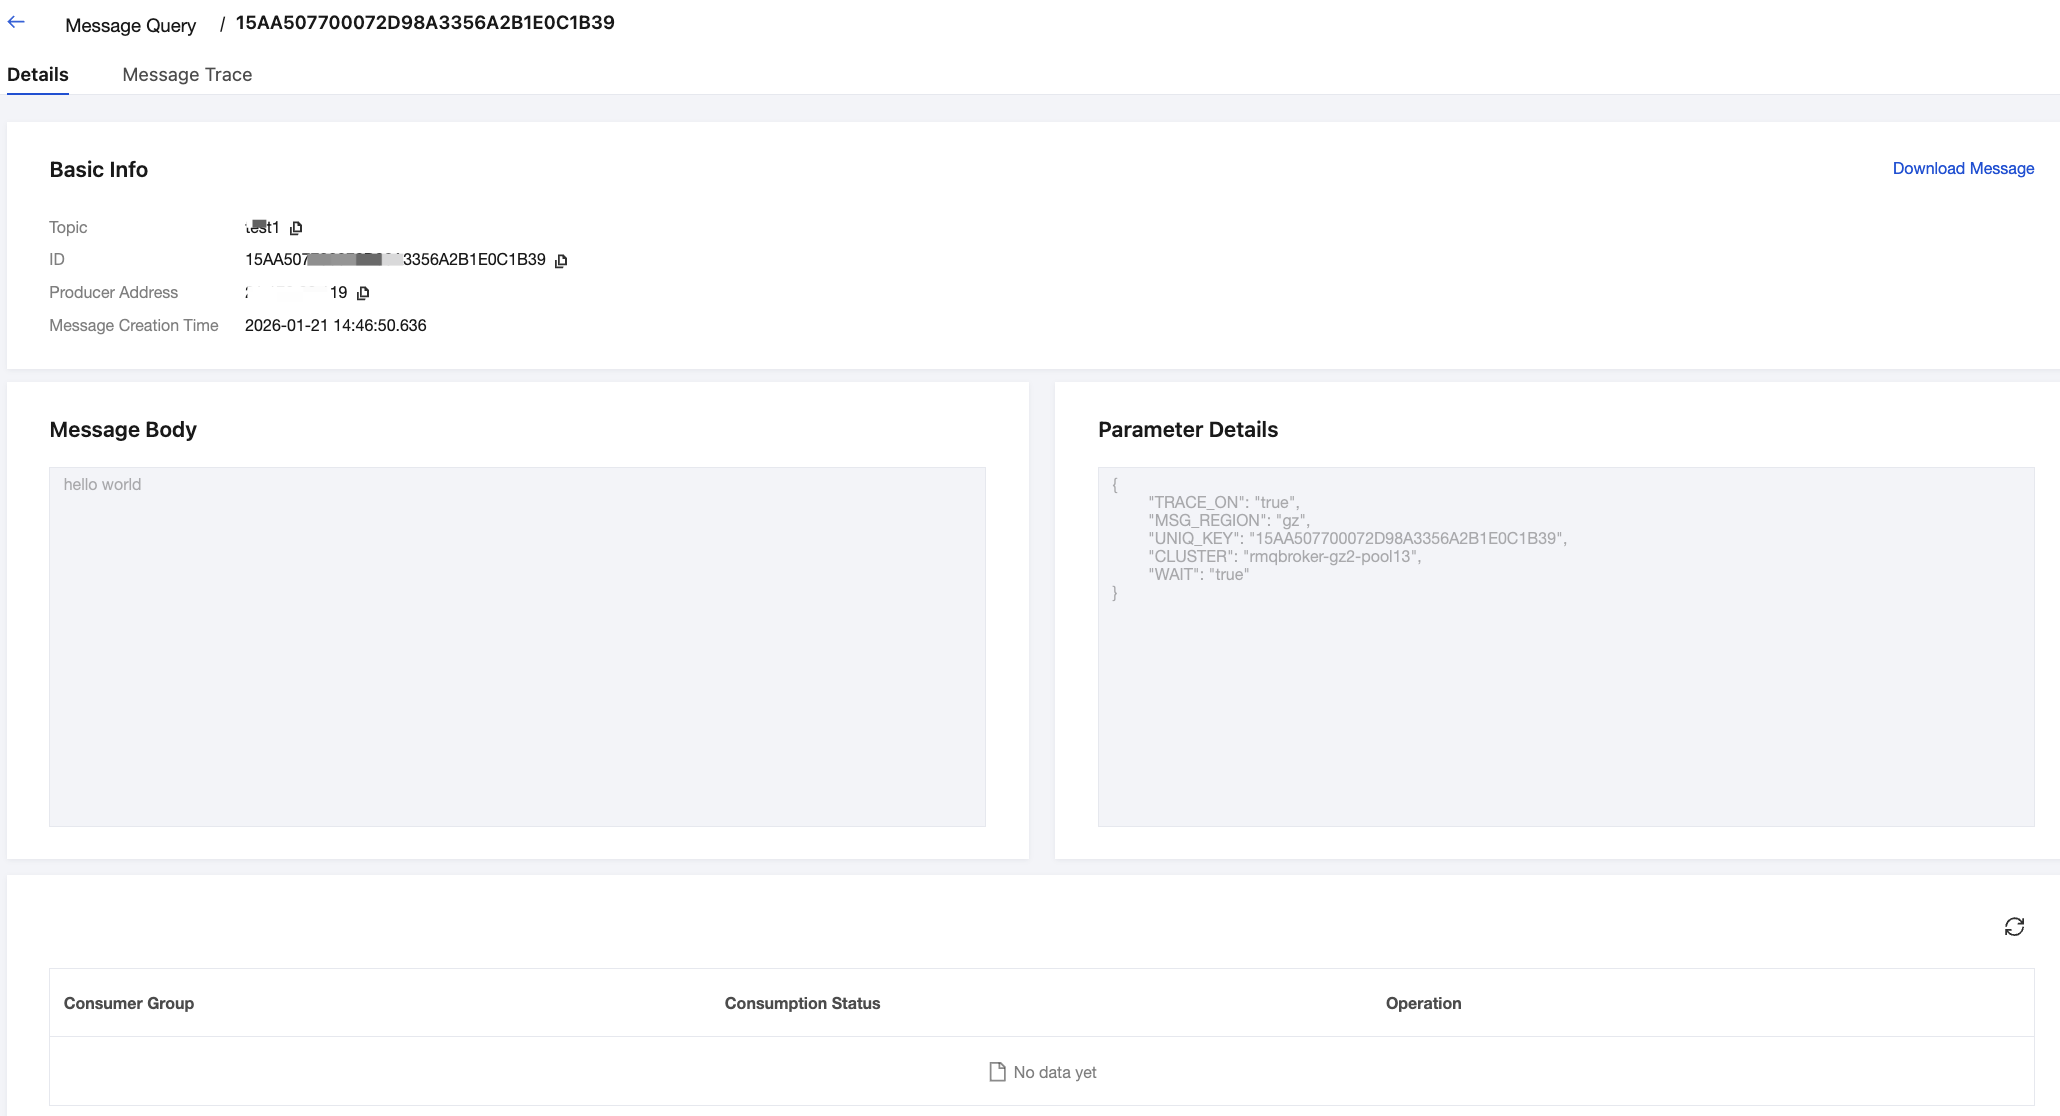
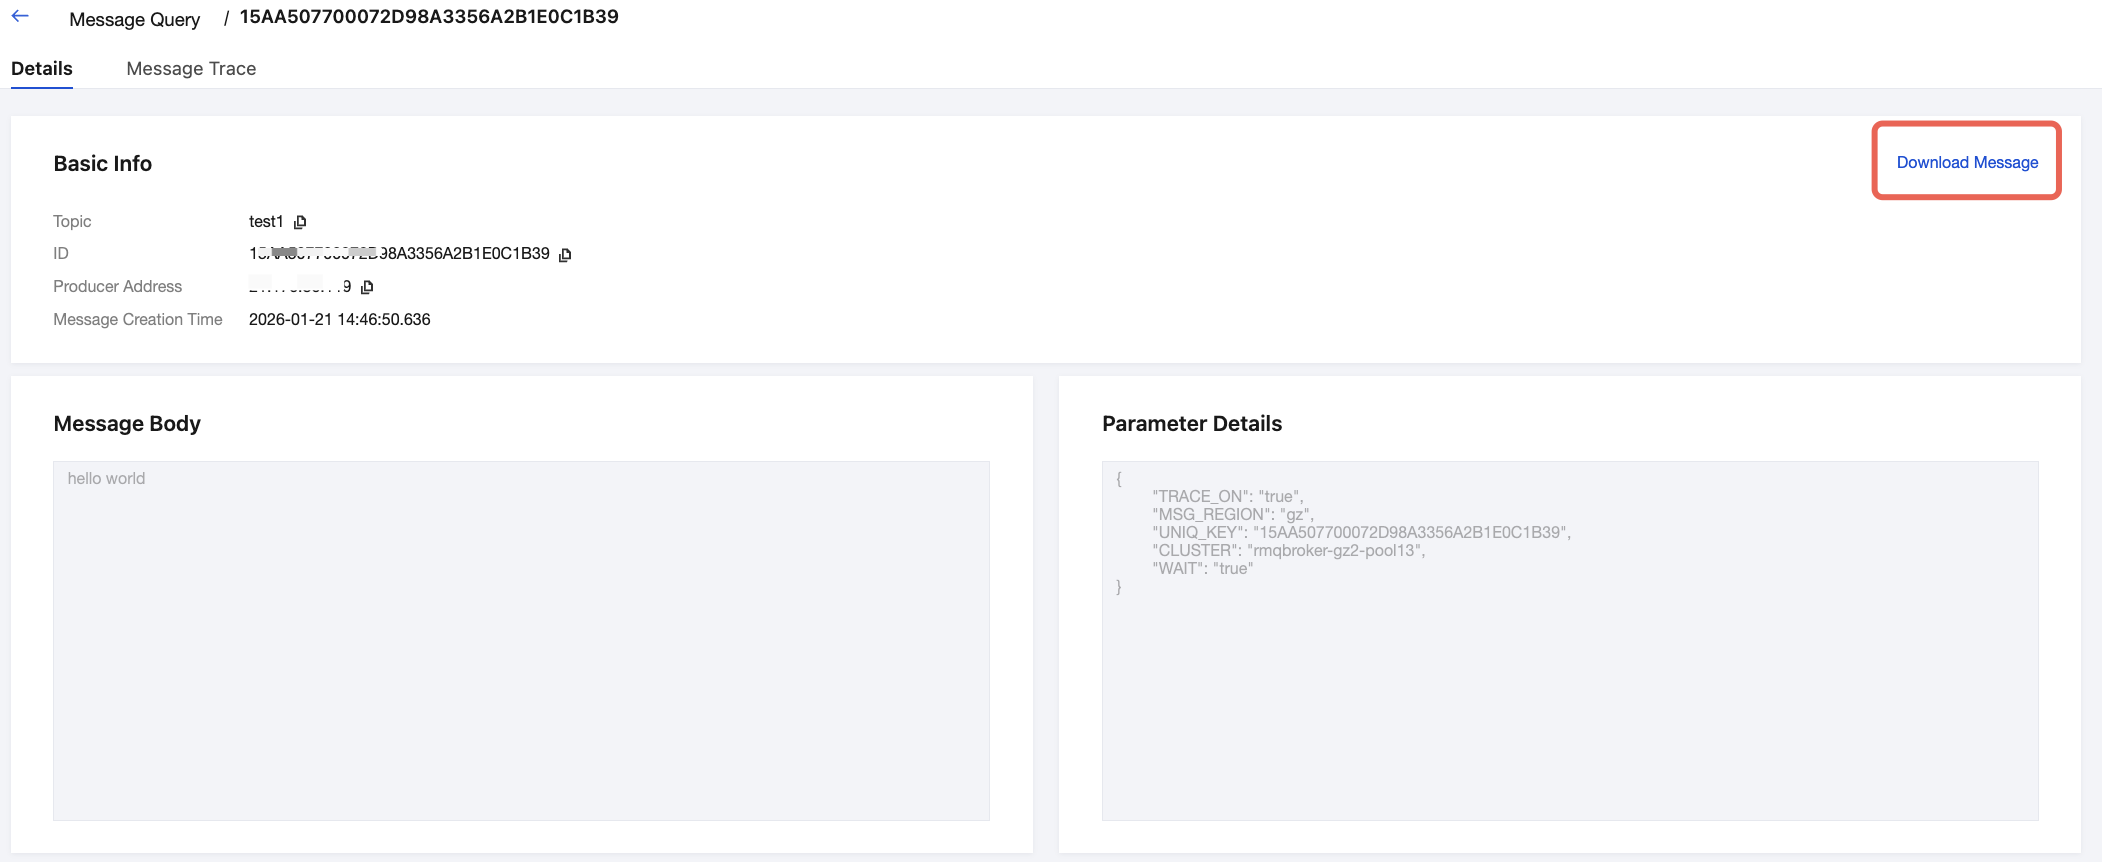
4. Find the message whose content or parameters you want to view, and click View Details in the operation column to view the basic information, content (message body), detailed parameters, and consumption status of the message.
In the Consumption Status module, you can view the group that consumes the message and the consumption status. You can also perform the following operations in the operation column:
Resend: You can click it to resend a message to the specified client. If a message has been consumed successfully, resending the message may result in duplicate consumption.
Exception Diagnosis: If the consumption is abnormal, you can click it to view the exception diagnosis information.
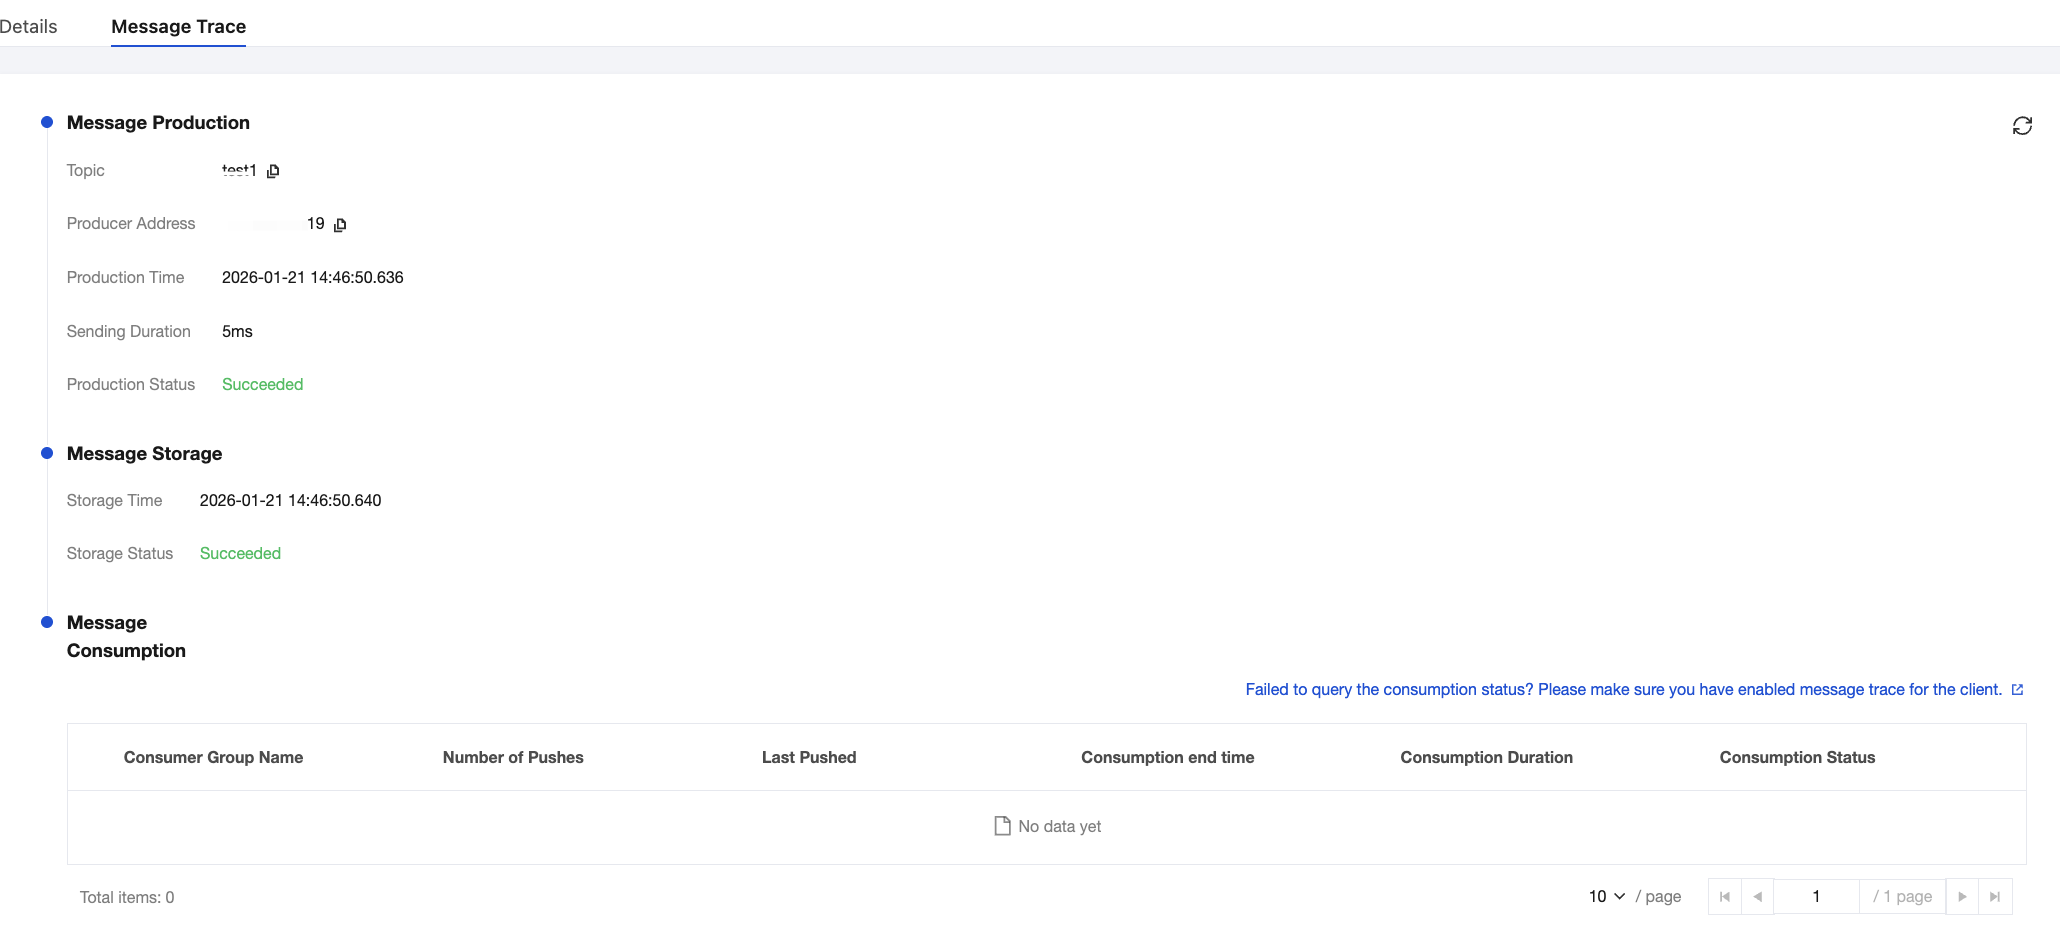
5. Click View Message Trace in the operation column, or click the Message Trace tab on the details page to view the message trace. For detailed description, see Message Trace and Description.
Consumption Verification
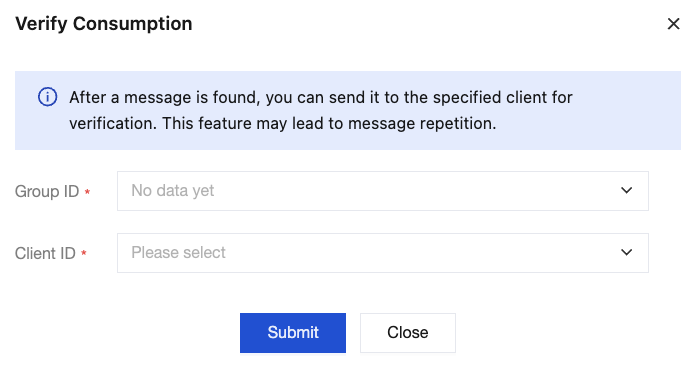
After a message is queried, you can click Verify Consumption in the operation column to send the message to the specified client to verify it. This feature may cause message duplication.
Note:
The consumption verification feature is only used to verify whether the consumption logic of the client functions properly. It does not affect normal message receiving. Information, including the message consumption status, will not be changed after consumption verification.
The consumption verification feature does not support sending messages to Python and C++ clients.
Exporting Messages
After a message is queried, you can click Export Message in the operation column to export message information, such as the message body, message tag, message key, message production time, and consumption properties.
You can also select the messages to be exported and click Batch Export in the upper-left corner to batch export the selected messages.
Downloading Messages
On the message details page, you can click Download Message in the upper-right corner to save the message body and message headers of a message to a local directory.
Was this page helpful?
You can also Contact Sales or Submit a Ticket for help.
Yes
No
Feedback