Memory tuning aims to achieve an optimal balance between machine resources and performance by providing a sufficient and stable memory usage to ensure normal system performance rather than simply reducing the memory usage. This document describes why and how TencentDB for MongoDB memory is occupied. It also provides troubleshooting methods and solutions for you to tune the database performance in time.
Storage Engine Memory
The cache size of WiredTiger (TencentDB for MongoDB storage engine) cannot exceed 60% of the actual requested instance memory specification. If the storage engine cache reaches 95% of the limit, the instance load will be high. If the dirty data cache percentage reaches 20% in the storage engine, user threads will be blocked.
Troubleshooting
You can view the engine memory utilization by running the db.serverStatus().wiredTiger.cache command in MongoDB Shell. The size of the cached data is indicated by the value after the returned bytes currently in the cache as shown below:
{
......
"bytes belonging to page images in the cache":6511653424,
"bytes belonging to the cache overflow table in the cache":65289,
"bytes belonging to page images in the cache":8563140208,
"bytes dirty in the cache cumulative":NumberLong("369249096605399"),
......
}
You can view the percentage of the dirty data cached in the storage engine in real time on the MongoStatus feature of the DBbrain performance trends. For more information, see mongostat. Usage suggestions
If Cache Dirty of the storage engine stays above 20%, you can troubleshoot as follows:
A. Control the volume of data written per unit time.
C. Increase the number of threads for cleaning dirty data. The higher the number of threads, the more instance resources will be consumed. Select the value with caution. Threads_max=4,threads_min=1 is set by default, but you can adjust it as follows:
db.runCommand({"setParameter":1, "wiredTigerEngineRuntimeConfig":"eviction=(threads_max=8,threads_min=4)"})
Note:
You can adjust the number of threads for cleaning the dirty data through db.runCommand, but this operation is only suitable for replica set architecture 4.0 and later.
If Cache Used of the storage engine stays above 95%, you can troubleshoot as follows:
c. Increase the number of threads for cleaning dirty data.
Memory of Connection and Request
Each connection needs one request thread. But excessive request threads will cause frequent context switch, leading to high memory overload. Each thread can use up to 1 MB thread stack. Generally, the memory ranges from a few KB to dozens of KB.
When a request command is received, a request context will be created, and many temporary buffers may be allocated throughout the process, such as request packets, response packets, and sorted temporary buffers. When the request ends, these buffers will be released to the memory allocator tcmalloc which will send them to their cache and return them to the operating system gradually. In many cases, the failure of 'tcmalloc' to return the memory to the operating system timely is a common cause of high memory usage, which can reach tens of GB.
Troubleshooting
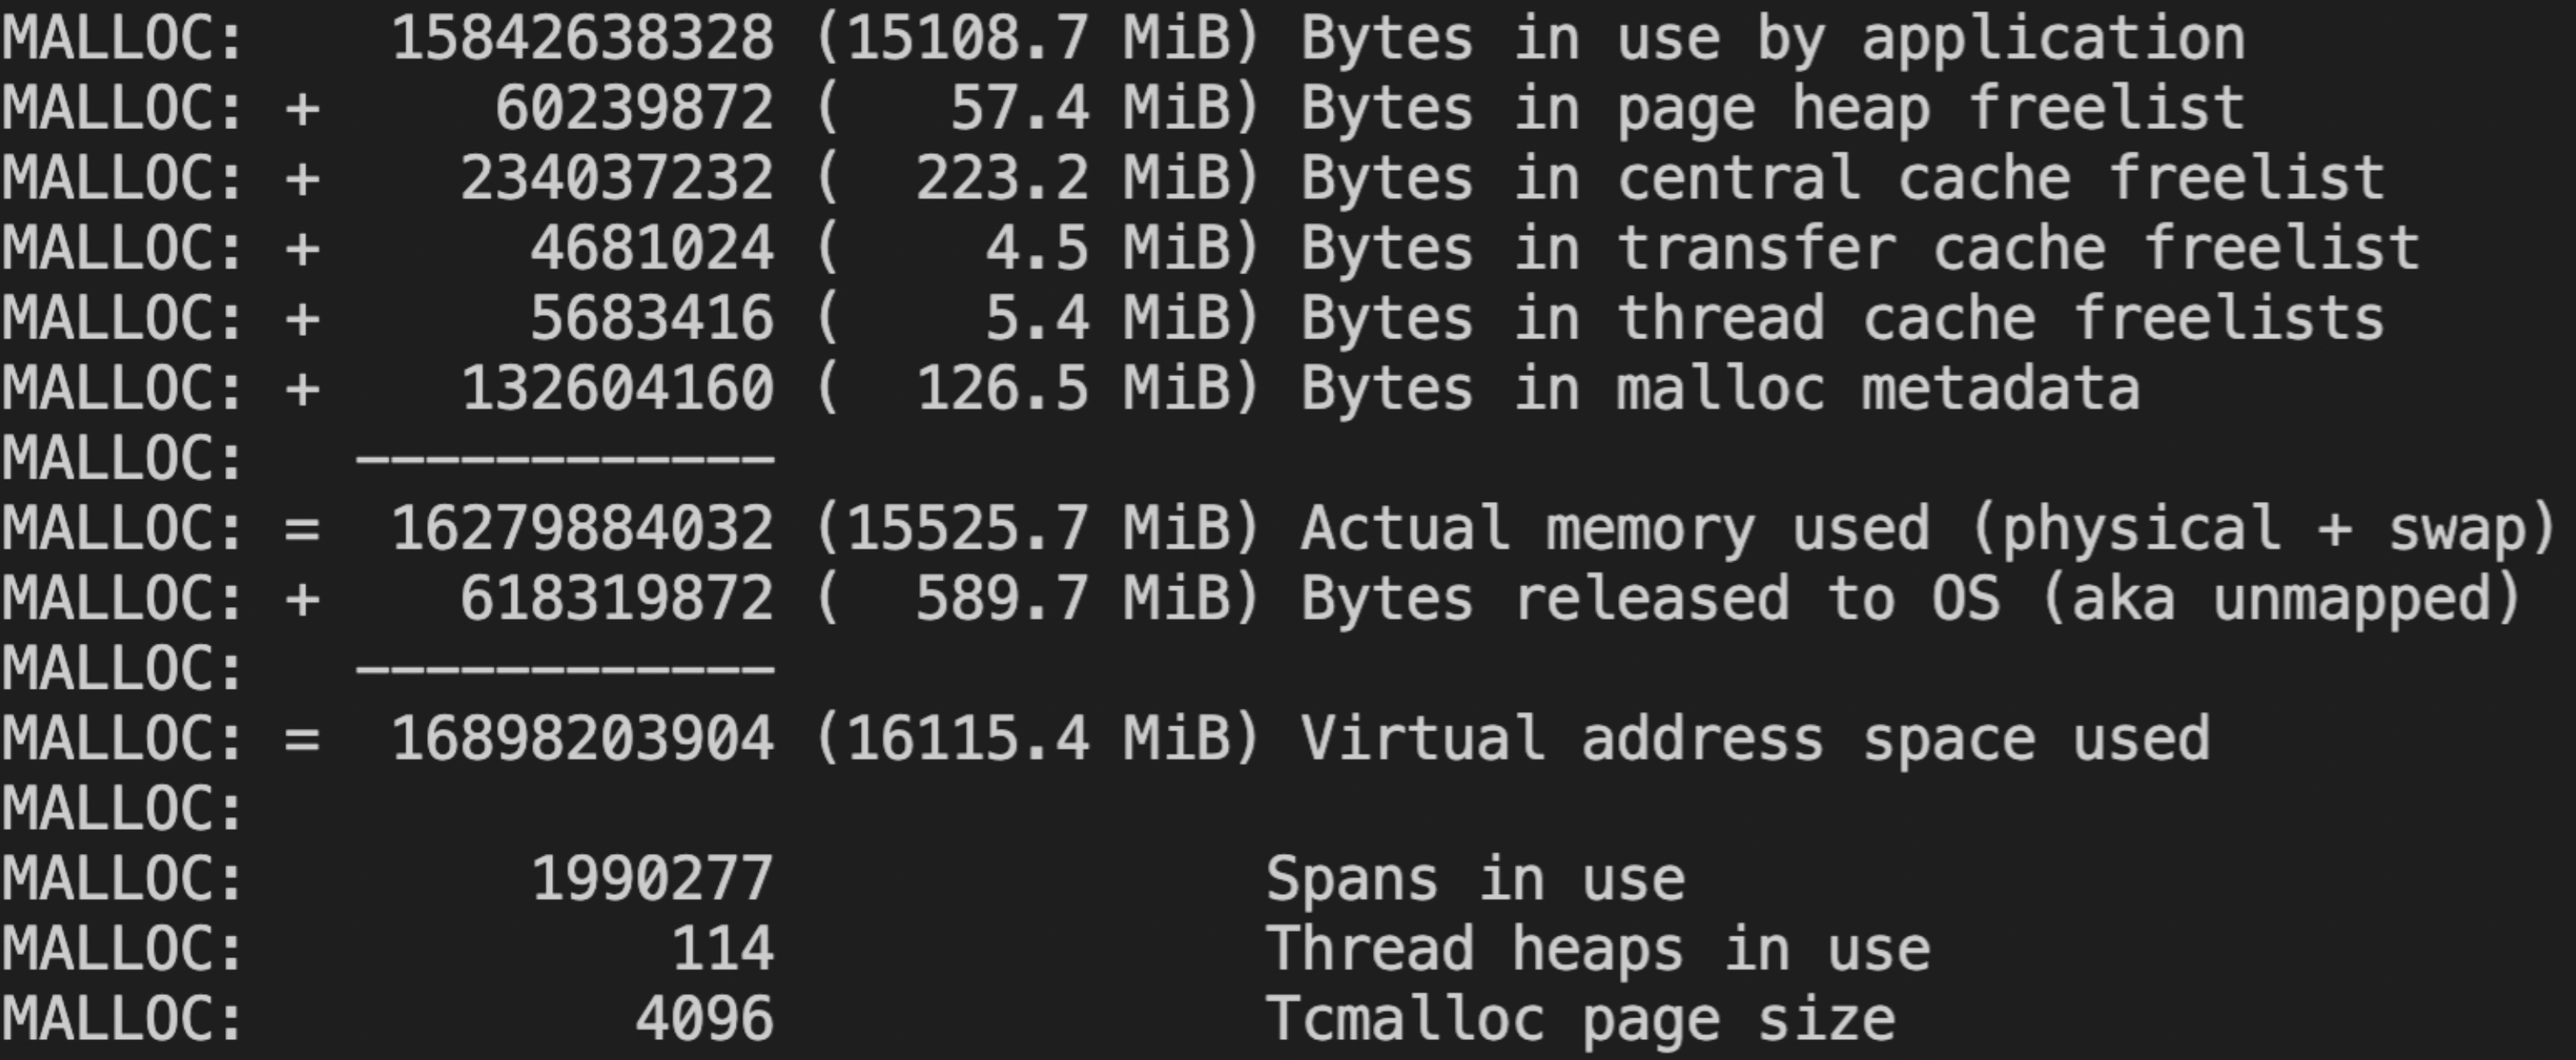
For memory unreturned to the system by tcmalloc, you can view it
by running the command db.serverStatus().tcmalloc.tcmalloc.formattedString or
db.serverStatus().tcmalloc. You can query the memory information by using db.serverStatus().tcmalloc.tcmalloc.formattedString as prompted below. Bytes in use by application refers to the memory actually consumed by the Mongod node, and Bytes in page heap freelist refers to the memory unreturned to the operating system.
Log in to the TencentDB for MongoDB console, and view the trend chart of the connection percentage for instance monitoring metric on the System Monitoring page. Connection percentage refers to the ratio of current connections to the maximum connections. Usage suggestions
1. Repossess the memory in time.
The tcmallocReleaseRate parameter is used to control the release of the memory, whichspecifies the amount of memory to release when the memory usage reaches a ratio. The higher the value of tcmallocReleaseRate, the faster MongoDB will release memory, but it will also have an impact on performance. You need to make adjustment when configuring tcmallocReleaseRate as required. By doing so, you can reach a balance between memory usage and performance requirements. You can run the following commands to set the value of tcmallocReleaseRate to a number between 1 and 10.
When diagnosticDataCollectionVerboseTCMalloc is true , you can repossess the memory directly in the following method:
db.adminCommand( { setParameter: 1, tcmallocReleaseRate: 5.0 } )
db.runCommand( { setParameter: 1, diagnosticDataCollectionVerboseTCMalloc:true}
Note:
tcmallocReleaseRate is suitable for TencentDB for MongoDB replica set instance 4.2 and later.
diagnosticDataCollectionVerboseTCMalloc is suitable for TencentDB for MongoDB replica set instance 4.4 and later.
2. Control the number of concurrent connections.
Up to 100 persistent connections can be created in the database, and 100 connection pools will be created between MongoDB Driver and the backend by default. If there are many clients, you need to reduce their connection pool size. We recommend that you keep the number of long connections established with the entire database below 1000. When the connection percentage is high, see Troubleshooting High Connection Utilization. 3. Reduce the memory overhead per request.
For example, you can reduce collection scans and memory sorting by creating indexes. To create an index, see MongoDB Indexes. 4. Upgrade the memory specification.
If the memory utilization continues to rise when the number of connections is appropriate, we recommend that you upgrade the memory specifications to avoid drastic decline in system performance due to memory overflow and large cache purge.
Metadata Memory
TencentDB for MongoDB maintains some metadata for each collection, such as index information, number of documents, and storage engine options. The management of this information will occupy some system resources. If there is a large amount of memory metadata in your collection or index, a lot of memory will be occupied. Especially in versions earlier than TencentDB for MongoDB 4.0, a large number of file handles will be opened during full logical backup. If they are not returned to the operating system in time, the memory usage will increase rapidly. Furthermore, in lower versions of TencentDB for MongoDB, file handles may not be deleted after a large number of collections are deleted, which may also cause memory leaks.
Troubleshooting
To count the number of collections and indexes in MongoDB, use the following commands separately:
use <database>;
db.getCollectionNames().filter(function(c) { return !c.startsWith("system."); }).length
db.getCollectionNames().forEach(function(col) { print("Indexes for " + col + ": " + db.getCollection(col).getIndexes().length); })
Query the number of collections as prompted below:
mongos> db.getCollectionNames().filter(function(c) { return !c.startsWith("system."); }).length
4
Query the index number of each collection as follows:
mongos> db.getCollectionNames().forEach(function(col) { print("Indexes for " + col + ": " + db.getCollection(col).getIndexes().length); })
Indexes for nba: 3
Indexes for t1: 1
Indexes for test: 1
Indexes for user: 1
Usage suggestions
We recommend that you keep the number of collections within a few thousand for MongoDB. Otherwise, MongoDB will experience a significant performance drop when managing these collections.
Memory Usage in Index Creation
A large amount of memory may be occupied when index is created for MongoDB. In the normal data writing, the secondary node will maintain a buffer of about 256 MB for data playback. For versions earlier than MongoDB 4.2, an index is created by the primary node in a non-background way, which will be played back serially by the backend. The playback may consume up to 500 MB of memory. But for versions later than MongoDB 4.2, background option is disused by default, and the secondary node is allowed to parallelly play back the index creation process, incurring more memory usage. Therefore, if multiple indexes are created at the same time, instance memory overflow may occur. Moreover, the secondary node may consume more memory during data replay process, especially after the index is created for the primary node.
Troubleshooting
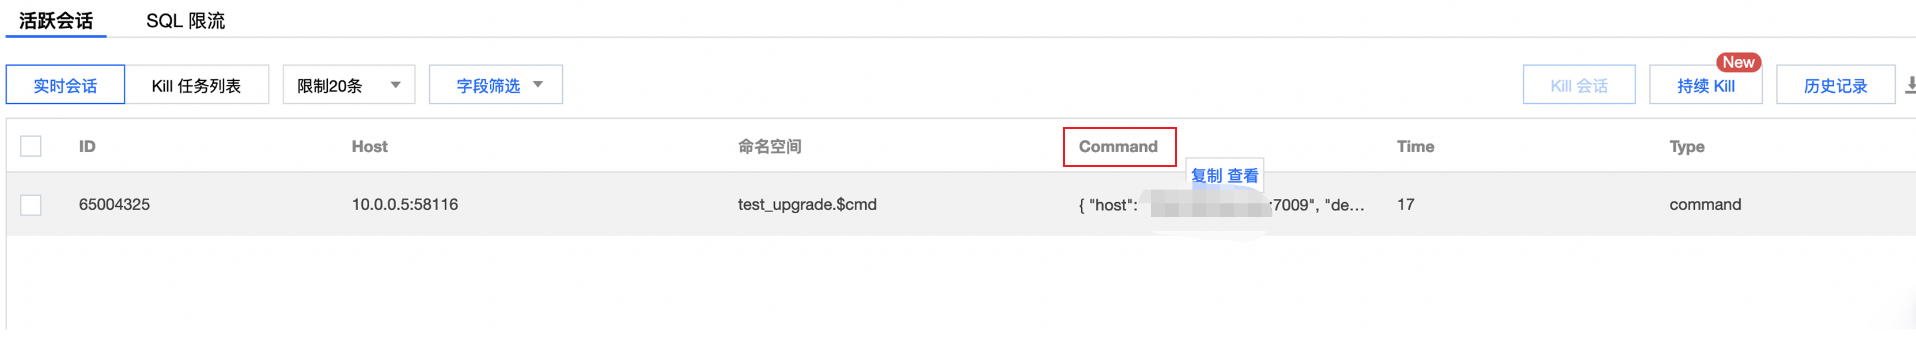
On the Real-Time Session page of DBbrain, check whether there are many processes of adding indexes. You can query the key fields of CreateIndex in the Command list as prompted below. Usage suggestions
Don’t create multiple large indexes simultaneously during peak hours.
Create an index in a background way to avoid high memory usage.
If the memory is insufficient, increase the system memory.
To reduce the memory usage, we recommend that you use more effective index types, such as text search index and geospatial index. Use DBbrain's index recommendation feature to select the optimal index. For larger collections, use sharding technology to disperse the storage of data and indexes. By doing so, the memory pressure of a single instance will be reduced.
Memory Produced in Logical Backup and Primary-Secondary Switch
Logical backup generally will produce large number of data scans, causing high memory usage. If you select secondary node or hidden node for logical backup, the memory used by secondary node will be evidently higher than that of the primary node.
In primary-secondary switch, the original primary node will be switched as the secondary node. Thus, the memory usage of the current secondary node is higher than that of the current primary node.
1. Troubleshooting
2. Log in to the MongoDB console, and check whether there is an running backup task on the Task Management page. The task being executed will be displayed on the top of the task list. Click Task Details in the Operation column, and check whether Logical Backup is selected. For detailed direction, see Task Management. 3. In Task Type on the Task Management tab, search for Promote to Primary Node to confirm whether the primary-secondary switch is performed.
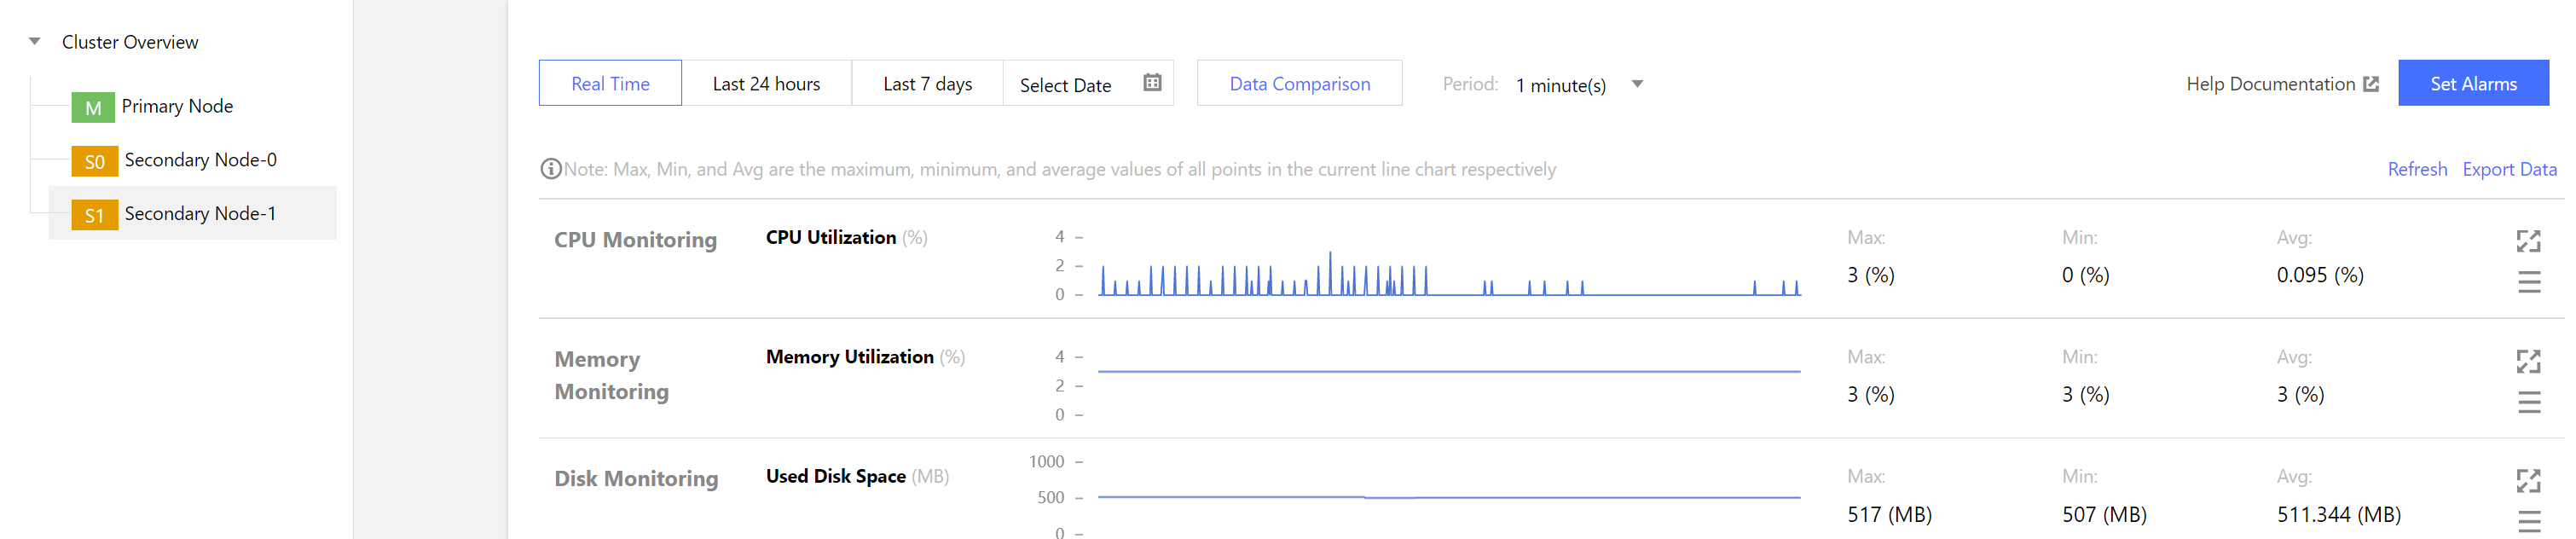
Click System Monitoring tab, in the drop-down list on the left sidebar, view the memory utilization of the primary and secondary node. Usage suggestions
As physical backup is performed by copying the physical file, memory usage is not so high. If your business has high requirements on the node memory, select physical backup mode. For more information, see Data Backup. If reading a secondary node is not set after the primary-secondary switch, restart the corresponding secondary node in the console to free up the memory. If the secondary node has a request, perform the operation during off-peak hours.