Performance Manifestation
This section describes how to use the performance testing tool SysBench to compare the performance after the CPU Elastic Scaling is enabled.
SysBench Tool Introduction
SysBench is a modular, cross-platform, and multi-threaded performance measurement tool that evaluates primary system parameters concerning its operational performance under heavy loads. The tool circumvents the need for complex database benchmark configurations, enabling swift understanding of database performance, even without the necessity of installing a database.
Testing Environment
Note:
The following environment is only used in the example.
Environment Utilized for MySQL Performance Testing:
Region/AZ: Beijing - Beijing Zone 7
Client: S5.8XLARGE64 (32-core 64 GB Standard S5)
Client OS: CentOS 8.2 64-bit
Network: Both the CVM and MySQL instances are under the same VPC subnet.
Tested MySQL Instance:
Three groups of instances: Beijing Zone 7, General 2-core 4 GB, two-node MySQL
Group A: NO-CPU-Expand, the CPU Elastic Scaling feature is not enabled.
Group B: AUTO-CPU-Expand, the Automatic CPU Elastic Scaling feature is enabled.
Group B:
Group C: MANUAL-CPU-Expand, the Manual CPU Elastic Scaling feature is enabled.
Group B:
Setting Parameters:
Set console parameter 'max_prepared_stmt_count' to its highest value to cope with high concurrency.
Testing Process
Step 1:
Create a 'sbtest' database in the system, enable the Automatic CPU Elastic Scaling feature for group B, and enable the Manual CPU Elastic Scaling feature for group C.
Step 2:
Utilize Sysbench to prepare data, including 10 tables, with each table containing a data volume of 100,000.
Step 3:
Perform a Sysbench read/write test on 10 tables, with each table containing a data volume of 100,000.
Step 4:
Proceed with Sysbench to clear data and disable the Manual CPU Elastic Scaling feature for group C.
Testing Description
The Test can be affected by factors such as testing time, duration, machine used, etc. We suggest performing multiple tests.
Executed Commands:
Following the above steps, conduct the tests respectively.
Note:
Please replace the 'XXX' in the following command with the internal network address, port number, username, user password, and database name of the MySQL instance. The specific parameters are explained as follows:
host: Private network address of the tested instance
port: Port number
user: Username
password: Password corresponding to the username
time: Time
threads: Number of concurrent threads
1. Prepare data: 100,000 data volumes in each table, with 10 tables in total.
sysbench --db-driver=mysql --mysql-host=xxx --mysql-port=xxxx --mysql-user=xxx --mysql-password='XXXXXXXXXX' --mysql-db=sbtest --table_size=100000 --tables=10 --events=0 --time=xxxx --threads={xxxx} oltp_read_write prepare
2. Execute high concurrency operations on the 100,000 data volume in each table, with 10 tables in total.
sysbench --db-driver=mysql --mysql-host=xxx --mysql-port=xxxx --mysql-user=xxx --mysql-password='XXXXXXXXXX' --mysql-db=sbtest --table_size=100000 --tables=10 --events=0 --time=xxx --threads={xxx} --percentile=95 --report-interval=1 oltp_read_write run
3. Clear the data.
sysbench --db-driver=mysql --mysql-host=xxx --mysql-port=xxxx --mysql-user=xxx --mysql-password='XXXXXXXXXX' --mysql-db=sbtest --table_size=100000 --tables=10 --events=0 --time=xxx --threads={xxx} --percentile=95 oltp_read_write cleanup
Test Results
Note:
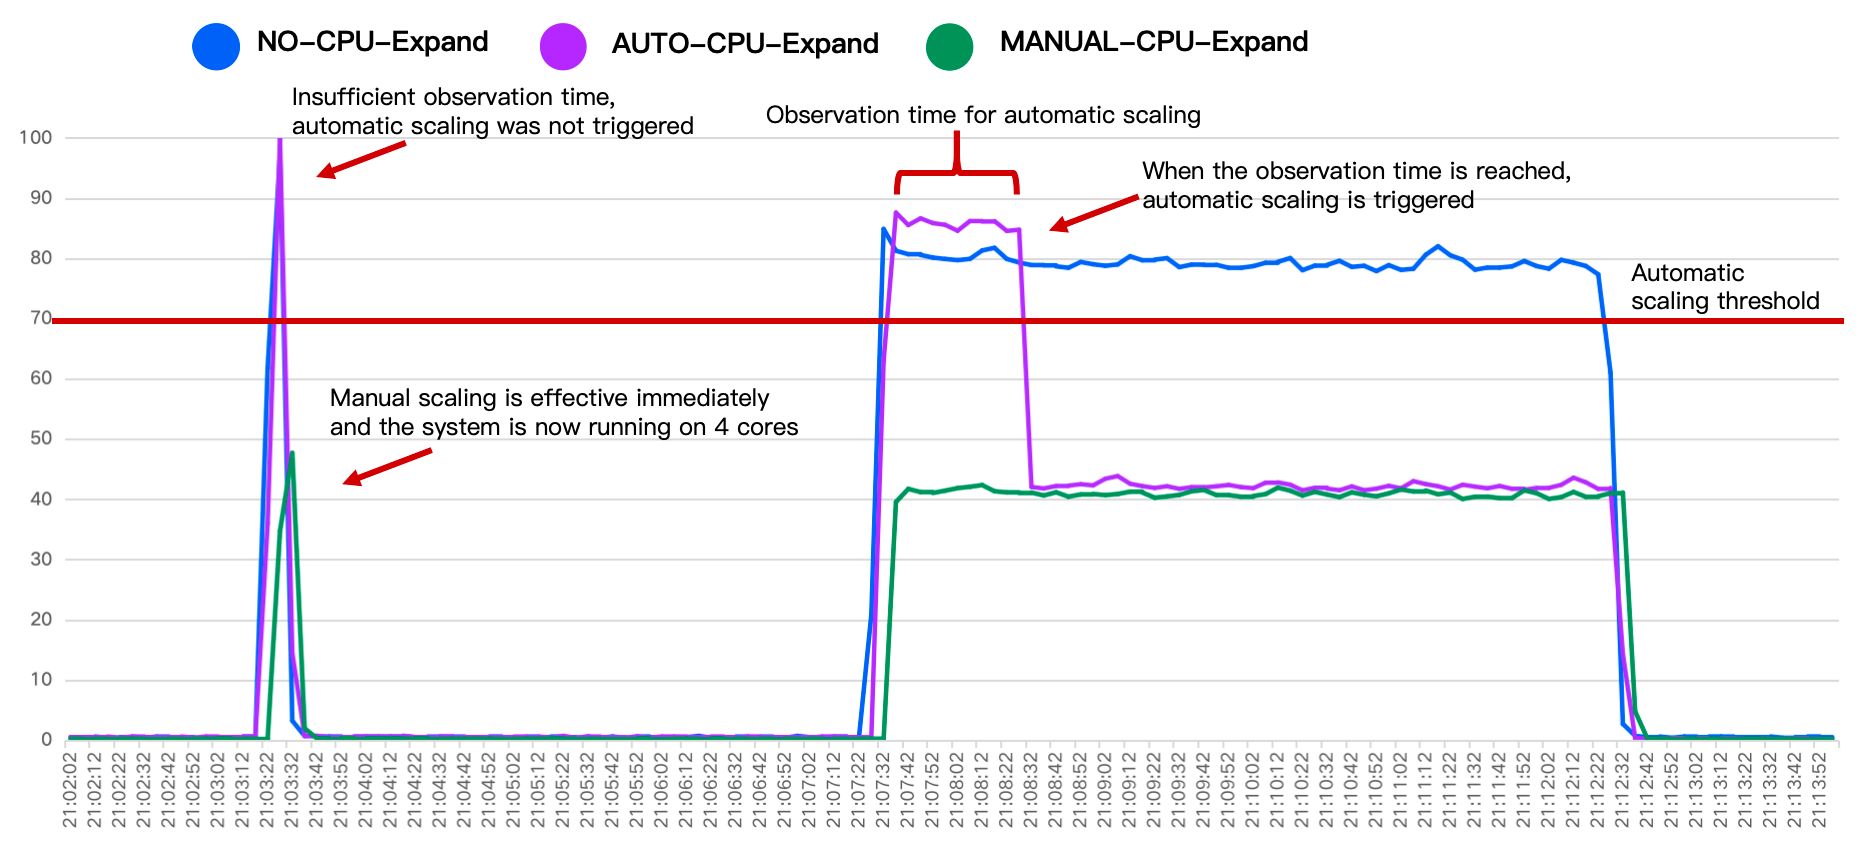
As illustrated below, in the comparative experiment results of the CPU Elastic Scaling feature of three groups of instances, we can observe:
Phase One: At 21:03, data injection was initiated. The CPU usage of both NO-CPU-Expand and AUTO-CPU-Expand exceeded 70%, but the duration did not exceed 1 minute. Therefore, the AUTO-CPU-Expand group did not trigger automatic scaling, while the MANUAL-CPU-Expand group scaled out immediately upon being operated and ran with 4 cores, with the CPU usage less than 50%.
Phase Two: At 21:07, high concurrency testing was initiated. The CPU usage of the NO-CPU-Expand group was remained over 70%, the CPU usage of the AUTO-CPU-Expand group also exceeded 70%, and it triggered automatic scaling when the CPU usage remained high for 1 minute. The scaling succeeded within seconds and reduced the usage to less than 50%. The CPU usage of the MANUAL-CPU-Expand group remained below 50%.

Note:
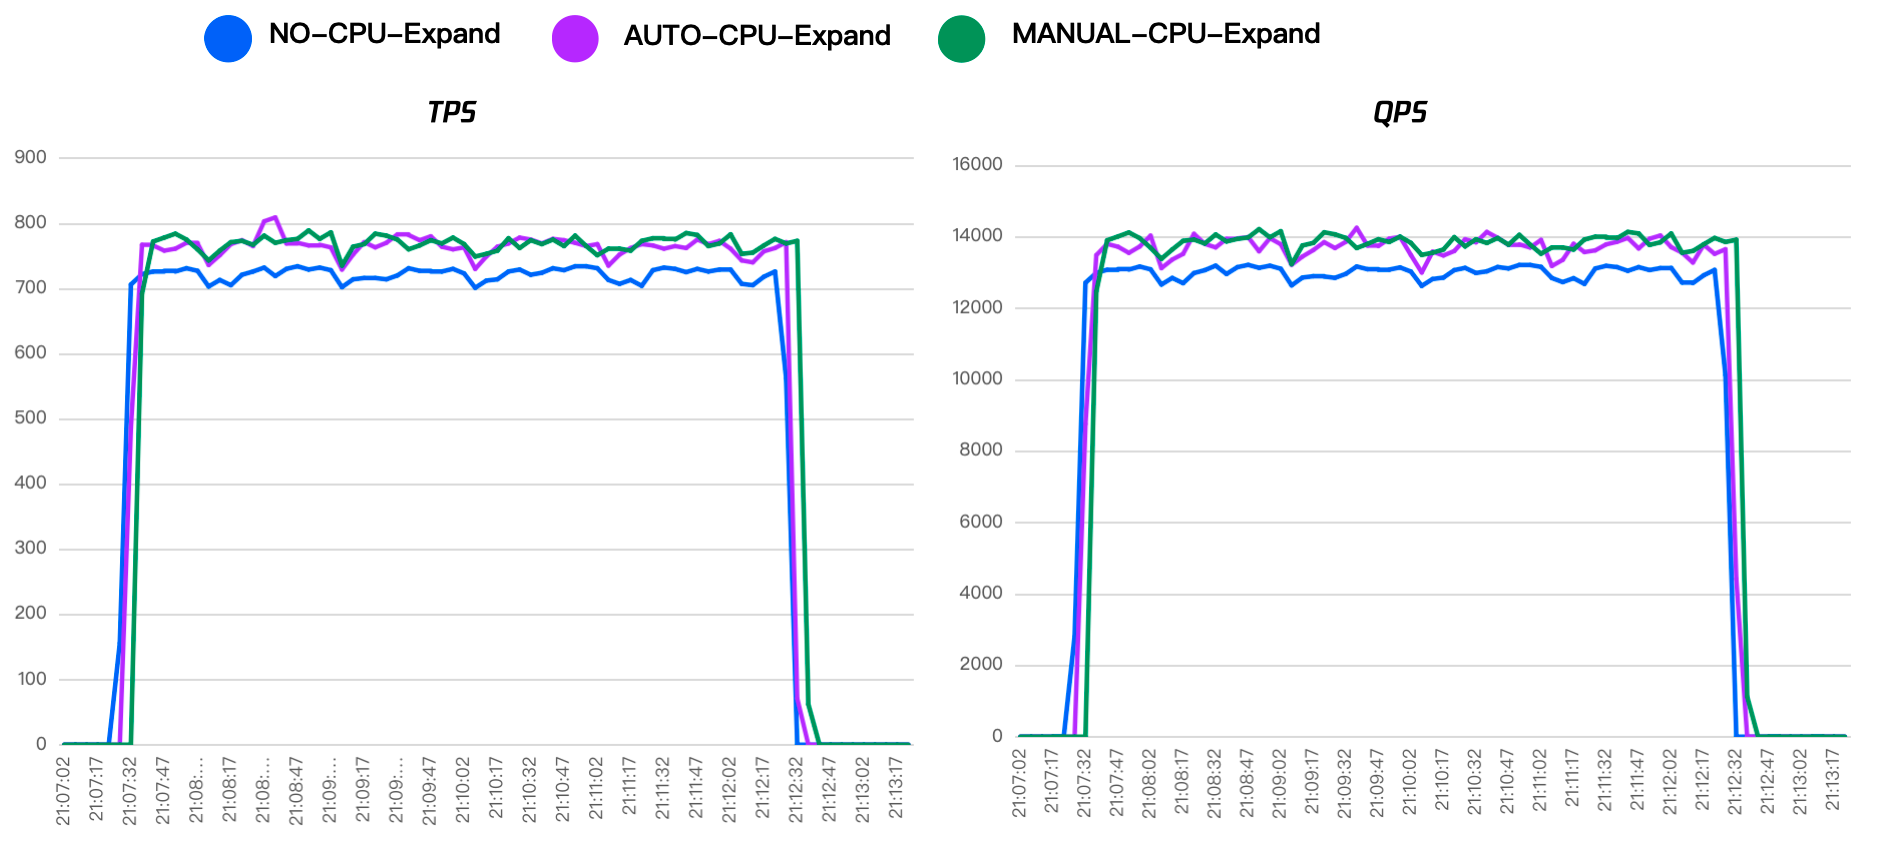
In addition to significant changes in CPU utilization, the performance of instances that have enabled the CPU Elastic Scaling feature also changes significantly. As demonstrated in the graph below, the TPS and QPS of instances with the feature enabled are higher than those for which the feature is not enabled. It should be noted, the performance in the test is affected by factors such as the testing period, duration, machine, etc. Thus, it is recommended to perform multiple tests and compare the results.

Help and Support
Was this page helpful?
You can also Contact sales or Submit a Ticket for help.
Help us improve! Rate your documentation experience in 5 mins.
Feedback