JSON
Download
포커스 모드
폰트 크기
This document describes the directions and notes for using JSON.
Viewing and Copying the JSON Template
1. Log in to the Tencent Cloud Observability Platform console.
2. In the left sidebar, click Dashboard > Dashboard List to go to the dashboard list page.
3. In the upper-left corner of the dashboard list page, click Create to go to the management page for creating a dashboard.
4. Click 
5. Click JSON and copy the JSON template to deploy the JSON format to your self-built system. Then, you can view the corresponding dashboard in your system.
The JSON template contains fields such as the dashboard attribute, template variable, and dashboard query. For the description of these fields, see the following section.
Description of JSON Fields
{"Description": "","Refresh": "close","Title": "JSONTEST","UUID": "jdq4joy56is4w60q","Version": 1,"Templating": [],"Links": [],"Panels": [],"Time": {"From": "now-12h","To": "now"},}
Name | Description |
Description | Description of the current dashboard |
Refresh | Interval for automatic refreshing |
Title | Name of the current dashboard |
UUID | Unique dashboard ID |
Version | Dashboard version, which increases every time you save the dashboard |
Templating | Dashboard template variable. For more information, see Templating |
Link | Dashboard link. For more information, see Link |
Panels | Chart configuration. See Panels |
Time | Dashboard time range |
Templating
"Templating": [ // Template variable{"Label": "cvm instance name", // Template variable alias"Multi": true, // Multiple or not"Name": "cvm", // Label"Selected": [], // Template variable value"Type": "monitor", // Template variable type"TemplatingType": "basics", // Label type: basic monitoring or custom monitoring"TemplatingType": '123', // Variable ID}]
Link
"Links": [ // Dashboard link{"IncludeVars": true, // Whether the link parameters carry template variables"KeepTime": true, // Whether the link parameters carry time variables"TargetBlank": true, // Whether to open a new tab"Title": "xxx", // Link name"Type": "other", // Link type: custom link or redirection link to another dashboard"Url": "/monitor/dashboard2/dashboards/d/0hh64oj49rru3ctk/dashboard2-0yan-shi-an-li-xia-zuan-lian-jie", // Link address"ID": 0 // ID}]
Panels
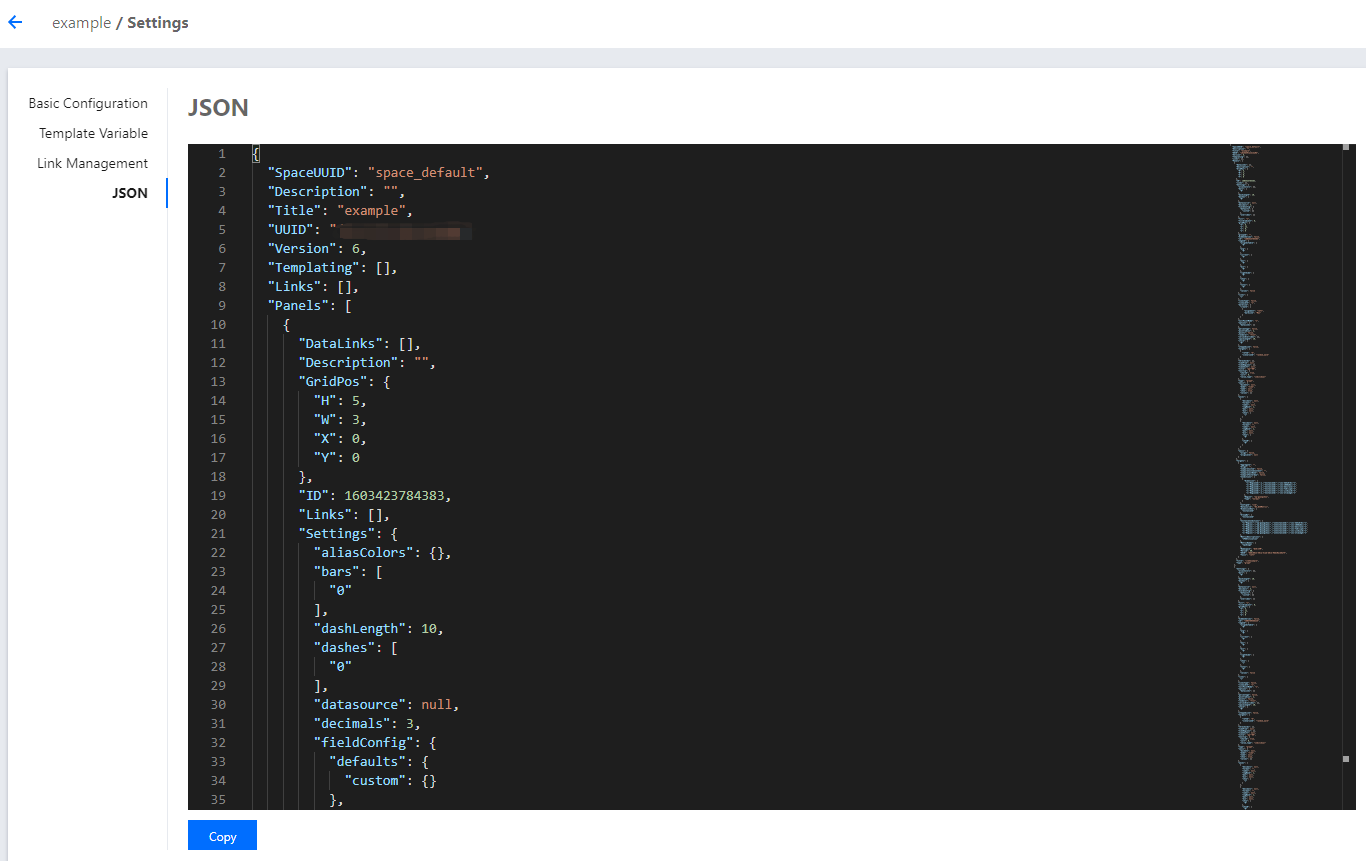
"Panels": [ // Panel configuration{"Collapsed": false, // Whether to collapse the chart group"Datasource": null, // Data source"GridPos": { // Chart position"H": 1,"W": 6,"X": 0,"Y": 0},"ID": 1595472129140, // Chart ID"Panels": [], // Panel is a field for the chart group, which stores sub-panels"Title": "Default chart group", // Title"Type": "row" // Chart type},{"DataLinks": [], // Data link for the chart configuration"Description": "", // Chart description"GridPos": {"H": 5,"W": 6,"X": 0,"Y": 1},"ID": 1595471392817,"Links": [], // Chart link"Settings": { // Chart visualization configuration"aliasColors": {},"bars": false,"dashLength": 10,"dashes": false,"datasource": null,"decimals": 2,// Legend precision"fieldConfig": {"defaults": {"custom": {}},"overrides": []},"fill": "0.8",// Chart fill opacity"fillGradient": 0,"gridPos": {"h": 8,"w": 12,"x": 0,"y": 0},"hiddenSeries": false,"id": "1595471392817",// Chart panel ID"legend": {// Legend settings"alignAsTable": [// Whether to display legends as tables"1"],"avg": [// Whether to display the average value. **‘1’**: true. **‘0’**: false."1"],"current": [// Whether to display the latest value. **‘1’**: true. **‘0’**: false."1"],"max": [// Whether to display the maximum value. **‘1’**: true. **‘0’**: false."1"],"min": [// Whether to display the minimum value. **‘1’**: true. **‘0’**: false."1"],"rightSide": [// Whether to place on the right side. **‘1’**: true. **‘0’**: false."1"],"show": [// Whether to display legends. **‘1’**: true. **‘0’**: false."1"],"total": [// Whether to display accumulative values. **‘1’**: true. **‘0’**: false."1"],"values": false},"lines": [// Whether to display curves. **‘1’**: true. **‘0’**: false."1"],"linesType": true,// Whether to display smooth curves. **‘1’**: true. **‘0’**: false."linewidth": "2",// Curve width"markline": {// Mark settings"marklineMax": {"max": [// Whether to display peak values. **‘1’**: true. **‘0’**: false."1"]}},"nullPointMode": "1",// Display mode of null values. 0: link to null data. 1: do not fill. 2: automatically fill with 0."options": {"dataLinks": []// datalinks array},"percentage": false,"pointradius": 2,"points": false,"renderer": "flot","seriesOverrides": [],"spaceLength": 10,"stack": [// Whether to allow stacked display. **‘1’**: true. **‘0’**: false."1"],"steppedLine": false,"targets": [{"refId": "A","scenarioId": "random_walk"}],"thresholds": [],"timeFrom": null,"timeRegions": [],"timeShift": null,"title": "New chart","tooltip": {"shared": true,"sort": 0,"value_type": "individual"},"type": "graph","xaxis": {"buckets": null,"mode": "time","name": null,"show": true,"values": []},"yaxes": [{"decimals": 2,// Left y-axis precision"format": "%",// Left y-axis label unit"label": null,"logBase": 1,"max": 2,// Maximum value of the left y-axis coordinate"min": 0,// Minimum value of the left y-axis coordinate"show": [// Whether to display the left y-axis. **‘1’**: true. **‘0’**: false."1"]},{"decimals": 2,"format": "","label": null,"logBase": 1,"max": null,"min": null,"show": ["1"]}],"yaxis": {"align": false,"alignLevel": null}},"Targets": [ // Metric configuration{"Aggregate": "", // Statistical mode"CompareLastWeek": false, // Compare with last week"CompareYesterday": false, // Compare with yesterday"Conditions": [ // Filtering conditions{"Dimension": ["{\\"InstanceId\\":\\"ins-19827u5b\\"}","{\\"InstanceId\\":\\"ins-xxooxxoo\\"}","{\\"InstanceId\\":\\"ins-19719mfp\\"}"],"Region": "ap-guangzhou","Type": "normal"}],"ConfigId": "cvm","Datasource": "DS_QCEMetric", // Product type"DimensionKey": ["InstanceId"],"GroupBy": [ // groupby"InstanceId"],"MetricNames": [ // Metric name"BaseCpuUsage"],"Namespace": "QCE/CVM", // Namespace"Period": 60 // Granularity},],"Title": "single metric - default configuration", // Chart name"Type": "graph" // Chart type},]
피드백