2. On the left sidebar, click Dashboard List to enter the dashboard list page.
3. In the dashboard list, find the dashboard that you want to view, and click the dashboard name to enter the dashboard management page.
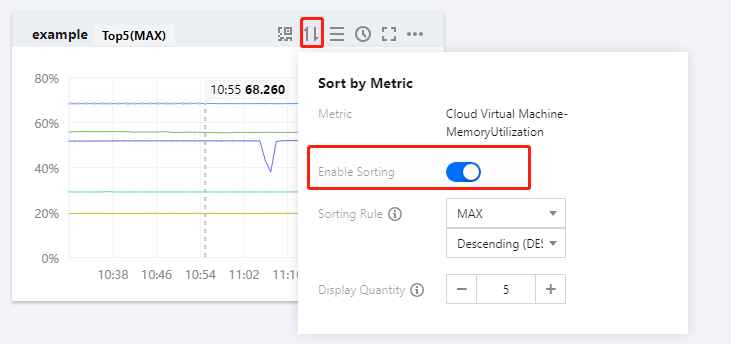
Viewing Charts by Using Metric Sorting Feature
Click
in the chart to enable the TopN feature, and then adjust the sorting rule and display quantity. This makes it easier for you to view the loads of machines in batches.
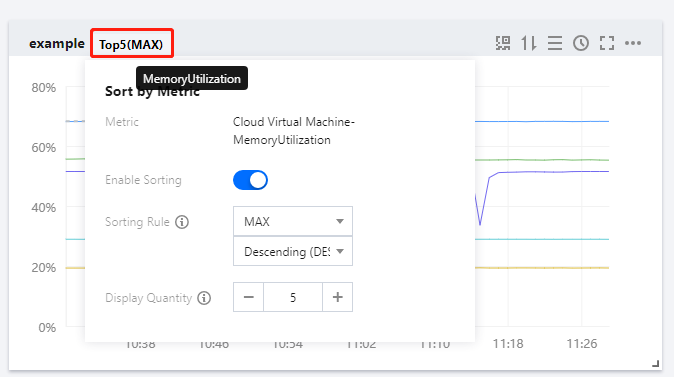
If you enable the sorting feature when creating a metric, you can also click the TopN button in the chart to adjust the sorting rule and display quantity and disable the sorting feature. This makes it easier for you to view the loads of machines in batches.
Viewing Charts in Full Screen Mode
Click
> Full-Screen Chart in the top-right corner of the chart to view it in the full-screen mode.
You can press ESC or click the
icon in the top-right corner to exit the full screen mode.
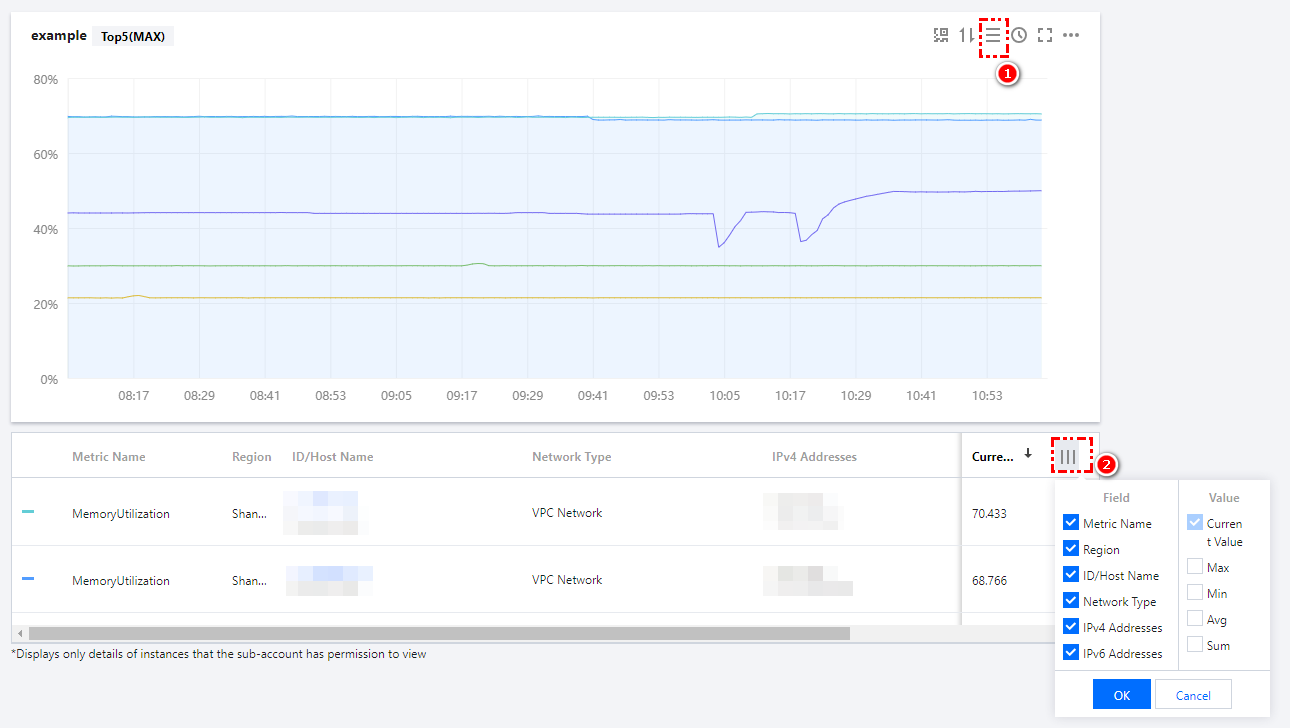
Viewing Instance Details
Click the
icon (red circle 1 in the figure below) in the top-right corner of the chart to display the instance details. You can also click the
icon (circle 2 in the figure below) in the top-right corner of the instance details to select the fields and values to be displayed.
Scaling and Moving Chart
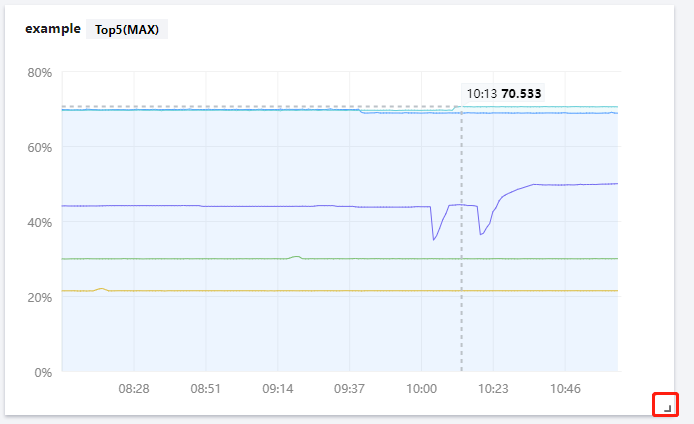
Chart scaling: you can scale a chart by hovering over the bottom-right corner of the chart until a straight-angle icon appears as shown below:
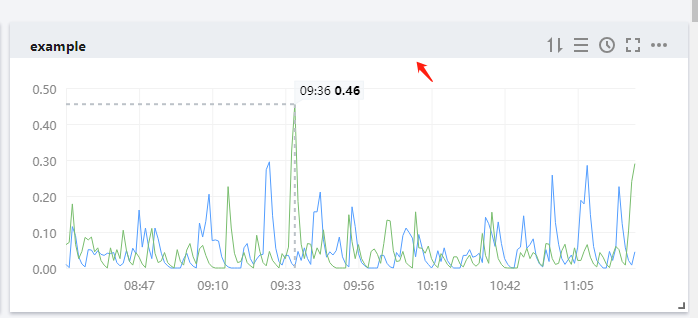
Chart moving: you can move a chart by hovering over the name of the chart until a movement icon appears as shown below:
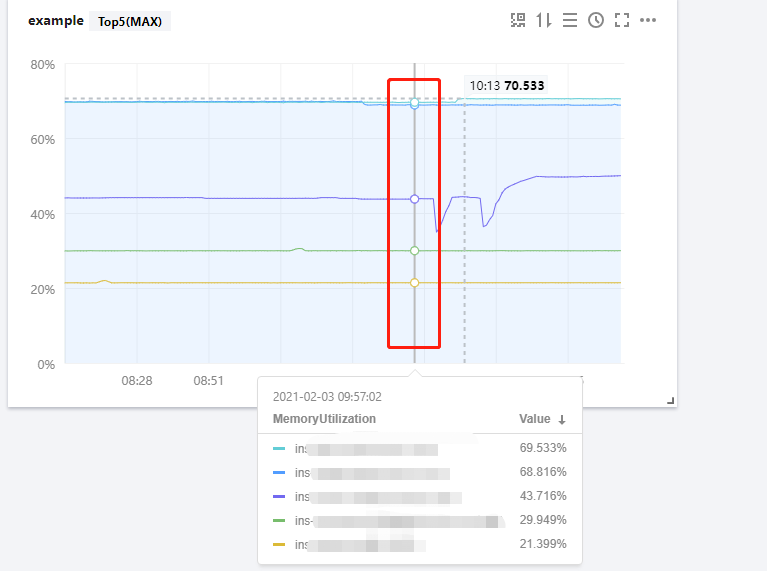
Viewing Monitoring Data in Specific Period
You can view the monitoring data in a specific period by hovering over the monitoring chart as shown below:
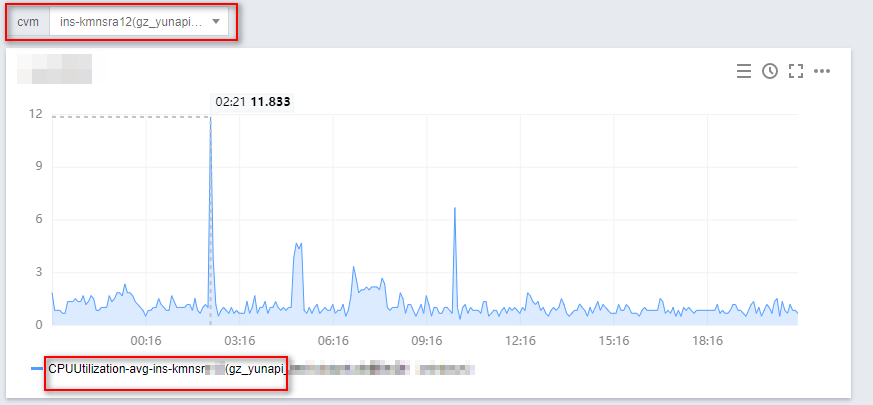
Viewing Data by Using Variable Selector
If you have many instances, you can define a template variable to dynamically switch tags, so that you can view the monitoring data of different instances in the same monitoring chart.
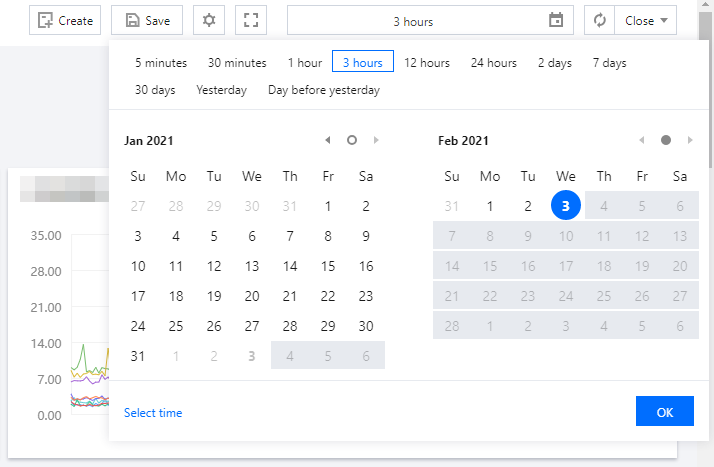
Adjusting the Time Span of Charts to View Monitoring Data
By default, dashboards display the data of the last 12 hours.
You can adjust the time span and granularity for all charts in the current dashboard by using the time selector in the top-right corner of the dashboard. In this way, you can review historical monitoring data and perform troubleshooting.
Time periods and corresponding chart granularities