- Release Notes and Announcements
- Product Introduction
- Purchase Guide
- Getting Started
- EMR on CVM Operation Guide
- Planning Cluster
- Configuring Cluster
- Managing Cluster
- Instance Information
- Node Specification Management
- Checking and Updating Public IP
- Cluster Scale-Out
- Cluster Scale-in
- Auto Scaling
- Repairing Disks
- Graceful Scale-In
- Disk Update Check
- Scaling up Cloud Disks
- Changing Configurations
- Automatic Replacement
- Exporting Software Configuration
- Cluster Scripts
- Cluster Termination
- Operation Logs
- Task Center
- Managing Service
- Managing Users
- Adding Components
- Restarting Service
- Starting/Stopping Services
- WebUI Access
- Resetting WebUI Password
- Software WebUI Entry
- Operation Guide for Access to WebUI over Private Network
- Role Management
- Client Management
- Configuration Management
- YARN Resource Scheduling
- HBase RIT Fixing
- Component Port Information
- Service Operation
- HBase Table-Level Monitoring
- Component Health Status
- Monitoring and Alarms
- Cluster Overview
- Node Status
- Service Status
- Cluster Event
- Log
- Application Analysis
- Cluster Inspection
- Monitoring Metrics
- Node Monitoring Metrics
- HDFS Monitoring Metrics
- YARN Monitoring Metrics
- ZooKeeper Monitoring Metrics
- HBase Monitoring Metrics
- Hive Monitoring Metrics
- Spark Monitoring Metrics
- Presto Monitoring Metrics
- Trino Monitoring Metrics
- ClickHouse Monitoring Metrics
- Druid Monitoring Metrics
- Kudu Monitoring Metrics
- Alluxio Monitoring Metrics
- PrestoSQL Monitoring Metrics
- Impala Monitoring Metrics
- Ranger Monitoring Metrics
- COSRanger Monitoring Metrics
- Doris Monitoring Metrics
- Kylin Monitoring Metrics
- Zeppelin Monitoring Metrics
- Oozie Monitoring Metrics
- Storm Monitoring Metrics
- Livy Monitoring Metrics
- Kyuubi Monitoring Metrics
- StarRocks Monitoring Metrics
- Kafka Monitoring Metrics
- Alarm Configurations
- Alarm Records
- EMR Lite HBase Operation Guide
- Container-Based EMR
- EMR Development Guide
- Hadoop Development Guide
- HDFS Common Operations
- HDFS Federation Management Development Guide
- HDFS Federation Management
- Submitting MapReduce Tasks
- Automatically Adding Task Nodes Without Assigning ApplicationMasters
- YARN Task Queue Management
- Practices on YARN Label Scheduling
- Hadoop Best Practices
- Using API to Analyze Data in HDFS and COS
- Dumping YARN Job Logs to COS
- Spark Development Guide
- Hbase Development Guide
- Phoenix on Hbase Development Guide
- Hive Development Guide
- Presto Development Guide
- Sqoop Development Guide
- Hue Development Guide
- Oozie Development Guide
- Flume Development Guide
- Kerberos Development Guide
- Knox Development Guide
- Alluxio Development Guide
- Kylin Development Guide
- Livy Development Guide
- Kyuubi Development Guide
- Zeppelin Development Guide
- Hudi Development Guide
- Superset Development Guide
- Impala Development Guide
- ClickHouse Development Guide
- Druid Development Guide
- TensorFlow Development Guide
- Jupyter Development Guide
- Kudu Development Guide
- Ranger Development Guide
- Doris Development Guide
- Kafka Development Guide
- Iceberg Development Guide
- StarRocks Development Guide
- Flink Development Guide
- RSS Development Guide
- Hadoop Development Guide
- Practical Tutorial
- API Documentation
- FAQs
- Service Level Agreement
- Contact Us
This document is composed based on System Tables at ClickHouse official website.
- System tables are used to implement certain system features and provide access to information on how the system is working.
- You cannot delete a system table (but you can run
DETACH). - System tables do not have files with data or metadata on the disk. The server creates all the system tables when it starts.
- System tables are read-only.
- System tables are located in the
systemdatabase.
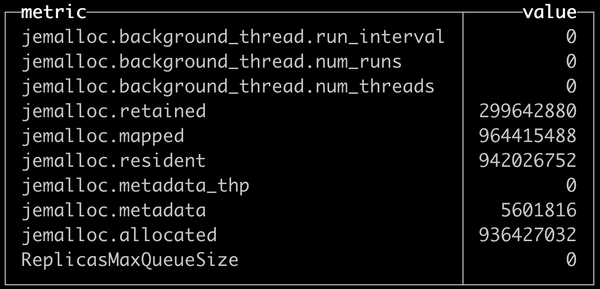
system.asynchronous_metrics
This system table contains metrics that are calculated periodically in the background, such as the RAM capacity in use.
Column information:
| Column Name | Type | Description |
|---|---|---|
| metric | String | Metric name |
| value | Float64 | Metric value |
Sample code:
SELECT * FROM system.asynchronous_metrics LIMIT 10
| Column Name | Type | Description |
|---|---|---|
| cluster | String | Cluster name |
| shard_num | UInt32 | Shard number in cluster |
| shard_weight | UInt32 | Shard weight during data writing |
| replica_num | UInt32 | Replica number in shard |
| host_name | String | Host name |
| host_address | String | Host IP address |
| port | UInt16 | Port for connecting to server |
| user | String | Username for connecting to server |
| errors_count | UInt32 | Number of host's failures in reaching replica |
| estimated_recovery_time | UInt32 | Seconds left until replica error count is zeroed and status is back to normal |
system.clusters
This system table contains information on clusters available in the configuration file and the servers in them.
Column information:errors_count is updated once per query in the cluster, while estimated_recovery_time is recalculated on demand. Therefore, there could be a case of non-zero errors_count and zero estimated_recovery_time. In this case, the next query will zero errors_count and try to use the replica as if it has no errors.
system.columns
This system table contains information on columns in all the tables. You can use this table to get information similar to the DESCRIBE TABLE query, but for multiple tables at once.
Column information:
| Column Name | Type | Description |
|---|---|---|
| database | String | Database name |
| table | String | Table name |
| name | String | Column name |
| type | String | Column type |
| default_kind | String | Expression type (DEFAULT, MATERIALIZED, or ALIAS) for the default value, or an empty string if it is not defined |
| default_expression | String | Expression for the default value, or an empty string if it is not defined |
| data_compressed_bytes | UInt64 | Size of compressed data in bytes |
| data_uncompressed_bytes | UInt64 | Size of decompressed data in bytes |
| marks_bytes | UInt64 | Size of marks in bytes |
| comment | String | Column comment, or an empty string if it is not defined |
| is_in_partition_key | UInt8 | Flag that indicates whether the column is in the partition expression |
| is_in_sorting_key | UInt8 | Flag that indicates whether the column is in the sorting key expression |
| is_in_primary_key | UInt8 | Flag that indicates whether the column is in the primary key expression |
| is_in_sampling_key | UInt8 | Flag that indicates whether the column is in the sampling key expression |
system.contributors
This system table contains information on contributors. All contributors are in random order during query execution.
system.databases
This system table contains a single String column called name, which is the name of a database. Each database that the server knows about has a corresponding entry in it. It is used to implement the SHOW DATABASES query.
system.detached_parts
This system table contains information on detached parts of MergeTree tables. The reason column specifies why the part was detached. For user-detached parts, the reason is empty. Such parts can be attached with the ALTER TABLE ATTACH PARTITION|PART command. For the description of other columns, please see system.parts . If the part name is invalid, values of some columns may be NULL. Such parts can be deleted with the ALTER TABLE DROP DETACHED PART command.
system.dictionaries
This system table contains information on external dictionaries.
Column information:
| Column Name | Type | Description |
|---|---|---|
| name | String | Dictionary name |
| type | String | Dictionary type, which can be Flat, Hashed, or Cache |
| origin | String | Path to the configuration file that describes the dictionary |
| attribute.names | Array(String) | Array of attribute names provided by dictionary |
| attribute.types | Array(String) | Corresponding array of attribute types provided by dictionary |
| has_hierarchy | UInt8 | Whether the dictionary is hierarchical |
| bytes_allocated | UInt64 | RAM capacity allocated for dictionary |
| hit_rate | Float64 | Percentage of the usage of the value in the cache for cache dictionaries |
| element_count | UInt64 | Number of items stored in dictionary |
| load_factor | Float64 | Percentage filled in dictionary |
| creation_time | DateTime | Time of creation or last successful reload of dictionary |
| last_exception | String | Text of the error that occurs when the dictionary is created or reloaded if the dictionary cannot be created |
| source | String | Text describing dictionary data source |
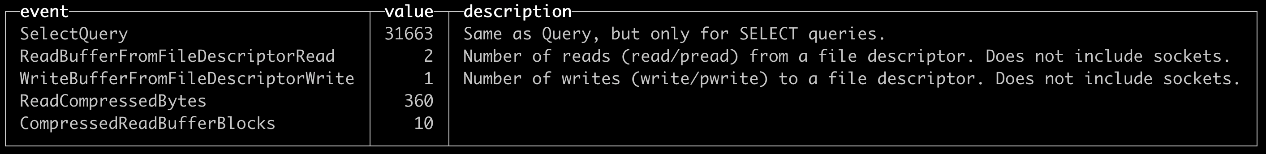
system.events
This system table contains information on the number of events that have occurred in the system. For example, in this table, you can find how many SELECT queries have been processed since the ClickHouse server was started.
Column information:
| Column Name | Type | Description |
|---|---|---|
| event | String | Event name |
| value | UInt64 | Number of occurred events |
| description | String | Event description |
Sample code:
SELECT * FROM system.events LIMIT 5
system.functions
This system table contains information on regular and aggregate functions.
Column information:
| Column Name | Type | Description |
|---|---|---|
| name | String | Function name |
| is_aggregate | UInt8 | Whether the function is aggregate |
system.graphite_retentions
This system table contains information on parameters graphite_rollup which are used in tables with * GraphiteMergeTree engines.
Column information:
| Column Name | Type | Description |
|---|---|---|
| config_name | String | graphite_rollup variable name |
| regexp | String | Metric name pattern |
| function | String | Aggregate function name |
| age | UInt64 | Minimum data usage duration in seconds |
| precision | UInt64 | Data usage duration precision in seconds |
| priority | UInt16 | Pattern priority |
| is_default | UInt8 | Whether the pattern is the default one |
| Tables.database | Array(String) | Array of names of the database tables that use the config_name parameter |
| Tables.table | Array(String) | Array of table names that use the config_name parameter |
system.merges
This system table contains information on merges and part mutations currently in process for tables in the MergeTree family.
Column information:
| Column Name | Type | Description |
|---|---|---|
| database | String | Name of the database where the table resides |
| table | String | Table name |
| elapsed | Float64 | Time elapsed (in seconds) since the merge started |
| progress | Float64 | Percentage of work completion (from 0 to 1) |
| num_parts | UInt64 | Number of the parts to be merged |
| result_part_name | String | Name of the part that will be formed as the result of merging |
| is_mutation | UInt8 | 1 if this process is a part mutation |
| total_size_bytes_compressed | UInt64 | Total size of the compressed data in the merged blocks |
| total_size_marks | UInt64 | Total number of marks in merged parts |
| bytes_read_uncompressed | UInt64 | Number of uncompressed read bytes |
| rows_read | UInt64 | Number of read rows |
| bytes_written_uncompressed | UInt64 | Number of uncompressed written bytes |
| rows_written | UInt64 | Number of written rows |
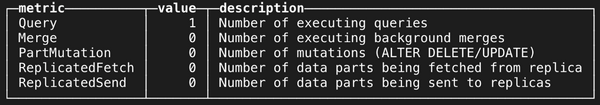
system.metrics
This system table contains metrics which can be calculated instantly or have a current value, such as the number of simultaneously processed queries or the current replica delay. This table is always up to date.
Column information:
| Column Name | Type | Description |
|---|---|---|
| metric | String | Metric name |
| value | Int64 | Metric value |
| description | String | Metric description |
You can find the list of supported metrics in the dbms/src/Common/CurrentMetrics.cpp source code file of ClickHouse.
Sample code:
SELECT * FROM system.metrics LIMIT 10
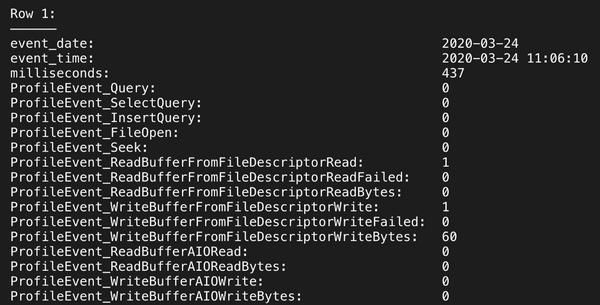
system.metric_log
This system table contains the history of metric values from the system.metrics and system.events tables, which are regularly flushed to the disk.
To enable metric history collection on system.metric_log, create /etc/clickhouse-server/config.d/metric_log.xml with the following content and restart clickhouse-server:
<yandex>
   <metric_log>
       <database>system</database>
       <table>metric_log</table>
       <flush_interval_milliseconds>7500</flush_interval_milliseconds>
       <collect_interval_milliseconds>1000</collect_interval_milliseconds>
   </metric_log>
</yandex>
Sample code:
SELECT * FROM system.metric_log LIMIT 1 FORMAT Vertical;

system.numbers
This system table contains a single UInt64 column named number that contains almost all the natural numbers starting from zero. You can use this table for tests or for a brute force search as needed. Reads from this table are not parallelized.
system.numbers_mt
This system table is the same as system.numbers, but reads from it are parallelized. The numbers can be returned in any order (used for tests).
system.one
This system table contains a single row with a single dummy UInt8 column containing the value 0. It is used if a SELECT query does not specify the FROM clause. It is similar to the DUAL table found in other DBMSs.
system.parts
This system table contains information on parts of MergeTree tables. Each row describes one data part.
Column information:
| Column Name | Type | Description |
|---|---|---|
| partition | String | Partition name |
| name | String | Data part name |
| active | UInt8 | Flag that indicates whether the data part is active. If it is active, it will be used in a table; otherwise, it will be deleted. Inactive data parts will be retained after merging |
| marks | UInt64 | Number of marks |
| rows | UInt64 | Number of rows |
| bytes_on_disk | UInt64 | Total size of all data part files in bytes |
| data_compressed_bytes | UInt64 | Total size of compressed data in data part. All the auxiliary files (e.g., files with marks) are not included |
| data_uncompressed_bytes | UInt64 | Total size of uncompressed data in data part. All the auxiliary files (e.g., files with marks) are not included |
| marks_bytes | UInt64 | Size of the file with marks |
| modification_time | DateTime | Time when the directory with the data part was modified |
| remove_time | DateTime | Time when the data part became inactive |
| refcount | UInt32 | Number of places where the data part is used. A value greater than 2 indicates that the data part is used in queries or merges |
| min_date | Date | Minimum value of date key in data part |
| max_date | Date | Maximum value of date key in data part |
| min_time | DateTime | Minimum value of date and time key in data part |
| max_time | DateTime | Maximum value of date and time key in data part |
| partition_id | String | Partition ID |
| min_block_number | UInt64 | Minimum number of data parts that make up the current part after merging |
| max_block_number | UInt64 | Maximum number of data parts that make up the current part after merging |
| level | UInt32 | Depth of merge tree. 0 indicates that the current part was created by insertion rather than by merging other parts |
| data_version | UInt64 | Mutations that should be applied to the data part (mutations with a version above data_version) |
| primary_key_bytes_in_memory | UInt64 | Memory capacity in bytes used by primary key values |
| primary_key_bytes_in_memory_allocated | UInt64 | Memory capacity (in bytes) reserved for primary key values |
| is_frozen | UInt8 | Flag that indicates whether a partition data backup exists. 1: yes; 0: no |
| database | String | Database name |
| table | String | Table name |
| engine | String | Table engine name without parameters |
| path | String | Absolute path to the folder containing data part files |
| disk | String | Name of the disk that stores data parts |
| hash_of_all_files | String | Compressed files of SipHash128 |
| hash_of_uncompressed_files | String | Uncompressed files of SipHash128 (files with marks, index files, etc.) |
| uncompressed_hash_of_compressed_files | String | Data in the SipHash128 compressed files as if they were uncompressed |
| bytes | UInt64 | Alias for bytes_on_disk |
| marks_size | UInt64 | Alias for mark_bytes |
system.part_log
This system table can be created only if the part_log server setting is specified. It contains information on events that occurred with data parts in the MergeTree family tables, such as adding or merging data.
Column information:
| Column Name | Type | Description |
|---|---|---|
| event_type | Enum | Type of the event that occurred with the data part. Valid values: NEW_PART, MERGE_PARTS, DOWNLOAD_PART, REMOVE_PART, MUTATE_PART, MOVE_PART |
| event_date | Date | Event date |
| event_time | DateTime | Event time |
| duration_ms | UInt64 | Duration |
| database | String | Name of the database where the data part resides |
| table | String | Name of the table where the data part resides |
| part_name | String | Data part name |
| partition_id | String | ID of the partition into which the data part is inserted |
| rows | UInt64 | Number of rows in data part |
| size_in_bytes | UInt64 | Data part size in bytes |
| merged_from | Array(String) | Array of names of the parts that make up the current part (after merging) |
| bytes_uncompressed | UInt64 | Size of uncompressed bytes |
| read_rows | UInt64 | Number of rows read during merging |
| read_bytes | UInt64 | Number of bytes read during merging |
| error | UInt16 | Error code |
| exception | String | Error message |
The system.part_log table will be created after the first insertion of data into the MergeTree table.
system.processes
This system table is used to implement the SHOW PROCESSLIST query.
Column information:
| Column Name | Type | Description |
|---|---|---|
| user | String | User who made the query |
| address | String | IP address from which the request was initiated |
| elapsed | Float64 | Elapsed time in seconds since request execution started |
| rows_read | UInt64 | Number of rows read from table. For distributed processing, on the requester server, this parameter is the total for all remote servers |
| bytes_read | UInt64 | Number of uncompressed bytes read from table. For distributed processing, on the requester server, this parameter is the total for all remote servers |
| total_rows_approx | UInt64 | Approximation of total number of the rows that should be read. For distributed processing, on the requester server, this parameter is the total for all remote servers. |
| memory_usage | UInt64 | RAM capacity used by request. It might not include some types of dedicated memory |
| query | String | Query text. For INSERT, it does not include the data to insert |
| query_id | String | Query ID (if defined) |
system.text_log
This system table contains log entries. Levels of logs that can be stored in this table can be limited with the text_log.level server setting.
Column information:
| Column Name | Type | Description |
|---|---|---|
| event_date | Date | Entry date |
| event_time | DateTime | Entry time |
| microseconds | UInt32 | Entry time |
| thread_name | String | Name of thread for logging |
| thread_id | UInt64 | OS thread ID |
| level | Enum8 | Log level. Valid values: 'Fatal' = 1, 'Critical' = 2, 'Error' = 3, 'Warning' = 4, 'Notice' = 5, 'Information' = 6, 'Debug' = 7, 'Trace' = 8 |
| query_id | String | Query ID |
| logger_name | LowCardinality(String) | Logger name (such as DDLWorker) |
| message | String | Log message |
| revision | UInt32 | ClickHouse version |
| source_file | LowCardinality(String) | Source file from which the logging was done |
| source_line | UInt64 | Source line from which the logging was done |
system.query_log
This system table contains information on execution of queries. For each query, you can view the processing start time, processing duration, error message, and other information.
- This table does not contain input data for
INSERTqueries. - ClickHouse will create this table only if the
query_log serverparameter is specified, which sets the logging rules, such as the logging interval or the name of the table into which the queries will be logged. - To enable query logging, please set the
log_queriesparameter to 1.
The system.query_log table registers two types of queries:
- Initial queries that were run directly by the client.
- Subqueries that were initiated by other queries (for distributed query execution). For this type of queries, information on the parent queries is displayed in the
initial_*columns.
Each query creates one or two rows in the query_log table based on the query status:
- If the query execution succeeds, two events of types 1 and 2 will be created (for more information, please see the
typecolumn). - If an error occurs during query processing, two events of types 1 and 4 will be created.
- If an error occurs before the query is started, one event of type 3 will be created.
By default, logs are added to the table at intervals of 7.5 seconds. You can set this interval in the query_log server setting (for more information, please see the flush_interval_milliseconds parameter). To flush the logs forcibly from the memory buffer into the table, please use the SYSTEM FLUSH LOGS query.
When the table is deleted manually, it will be automatically created immediately. All the previous logs will be deleted.
Note: the log storage period is unlimited. Logs will not be automatically deleted from the table, and you need to delete outdated logs by yourself. You can specify an arbitrary partitioning key for the system.query_log table in the query_log server setting (for more information, please see the partition_by parameter).
system.query_thread_log
This system table contains information on each query execution thread.
- ClickHouse will create this table only if the
query_thread_log serverparameter is specified, which sets the logging rules, such as the logging interval or the name of the table into which the queries will be logged. - To enable query logging, please set the
log_query_threadsparameter to 1.
By default, logs are added to the table at intervals of 7.5 seconds. You can set this interval in the query_log server setting (for more information, please see the flush_interval_milliseconds parameter). To flush the logs forcibly from the memory buffer into the table, please use the SYSTEM FLUSH LOGS query.
When the table is deleted manually, it will be automatically created immediately. All the previous logs will be deleted.
Note: the log storage period is unlimited. Logs will not be automatically deleted from the table, and you need to delete outdated logs by yourself. You can specify an arbitrary partitioning key for the system.query_log table in the query_log server setting (for more information, please see the partition_by parameter).
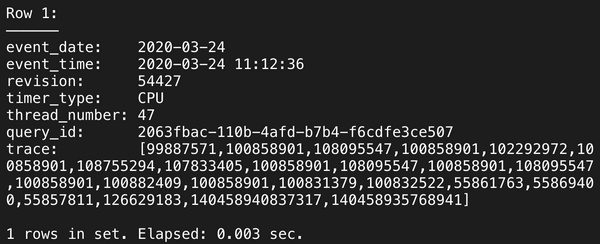
system.trace_log
This system table contains stack traces collected by the sampling query profiler. ClickHouse will create this table when the trace_log server configuration is set. You also need to set query_profiler_real_time_period_ns and query_profiler_cpu_time_period_ns. To analyze logs, please use the addressToLine, addressToSymbol, and demangle introspection functions.
Column information:
| Column Name | Type | Description |
|---|---|---|
| event_date | Date | Sampling date |
| event_time | DateTIme | Sampling time |
| revision | UInt32 | ClickHouse server version revision |
| timer_type | Enum8 | Timer type. Valid values: Real, CPU |
| thread_number | UInt32 | Thread identifier |
| query_id | String | Query identifier that can be used to get details of a running query from the query_log system table |
| trace | Array(UInt64) | Stack trace at the moment of sampling. Each element is a virtual memory address inside the ClickHouse server process |
Sample code:
SELECT * FROM system.trace_log LIMIT 1 \G;
system.replicas
This system table contains information and status of replicated tables residing on the local server. It can be used for monitoring and contains a row for every Replicated * table.
Column information:
| Column Name | Type | Description |
|---|---|---|
| database | String | Database name |
| table | String | Table name |
| engine | String | Table engine name |
| is_leader | UInt8 | Whether the replica is the leader |
| can_become_leader | UInt8 | Whether the replica can be elected as the leader |
| is_readonly | UInt8 | Whether the replica is in read-only mode |
| is_session_expired | UInt8 | Expiration of session with ZooKeeper. It is basically the same as is_readonly |
| future_parts | UInt32 | Number of data parts that will appear as the result of uncompleted INSERT statements or merges |
| parts_to_check | UInt32 | Number of data parts in queue for verification. A part will be put into the verification queue if it is suspected to be corrupted |
| zookeeper_path | String | Path to table data in ZooKeeper |
| replica_name | String | Replica name in ZooKeeper. Different replicas of the same table have different names |
| replica_path | String | Path to replica data in ZooKeeper |
| columns_version | Int32 | Version number of table structure, which indicates how many times ALTER has been executed |
| queue_size | UInt32 | Size of queue for operations waiting to be performed. Operations include inserting blocks of data, merging, and certain other actions. It is usually the same as future_parts |
| inserts_in_queue | UInt32 | Number of data blocks that need to be inserted. Insertions are usually replicated quickly. If this number is large, it means that something is wrong |
| merges_in_queue | UInt32 | Number of merges waiting to be made. Sometimes merges are lengthy, so this value may be greater than zero for a long time |
| part_mutations_in_queue | UInt32 | Number of mutations waiting to be made |
| queue_oldest_time | DateTime | Time when the earliest operation was added to the queue (this will be displayed only if queue_size is greater than 0) |
| inserts_oldest_time | DateTime | For more information, please see queue_oldest_time |
| merges_oldest_time | DateTime | For more information, please see queue_oldest_time |
| part_mutations_oldest_time | DateTime | For more information, please see queue_oldest_time |
| log_max_index | UInt64 | Maximum number of entries in the log of general activity |
| log_pointer | UInt64 | Maximum number of entries in the log of general activity to whose execution queue the replica is copied plus one. If log_pointer is much smaller than log_max_index, something is wrong |
| last_queue_update | DateTime | Time when the queue was last updated |
| absolute_delay | UInt64 | Delay in seconds of the current replica |
| total_replicas | UInt8 | Total number of known replicas of this table |
| active_replicas | UInt8 | Number of replicas of this table that have a session in ZooKeeper (i.e., number of running replicas) |
Only one replica can be the leader at a time. The leader is responsible for selecting backend merges to perform. Data can be written into any replica that is available and has a session in ZooKeeper, regardless of whether it is a leader.
- If you request all the columns, the table may run a bit slowly, as several reads from ZooKeeper are made for each row.
- If you do not request the last 4 columns (log_max_index, log_pointer, total_replicas, and active_replicas), the table runs quickly.
For example, you can check whether everything is running correctly as follows:
SELECT
  database,
  table,
  is_leader,
  is_readonly,
  is_session_expired,
  future_parts,
  parts_to_check,
  columns_version,
  queue_size,
  inserts_in_queue,
  merges_in_queue,
  log_max_index,
  log_pointer,
  total_replicas,
  active_replicas
FROM system.replicas
WHERE
     is_readonly
  OR is_session_expired
  OR future_parts > 20
  OR parts_to_check > 10
  OR queue_size > 20
  OR inserts_in_queue > 10
  OR log_max_index - log_pointer > 10
  OR total_replicas < 2
  OR active_replicas < total_replicas
If this query does not return anything, it means that everything is normal.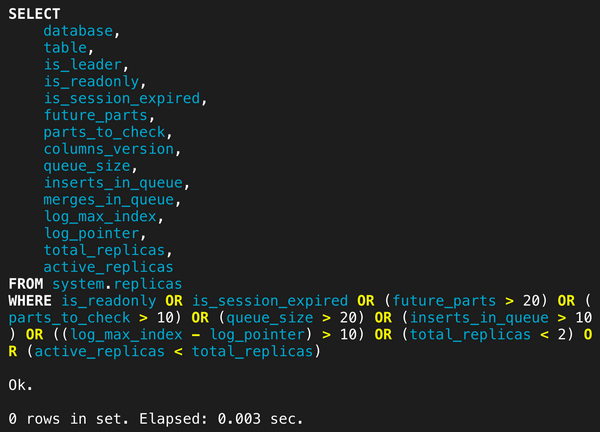
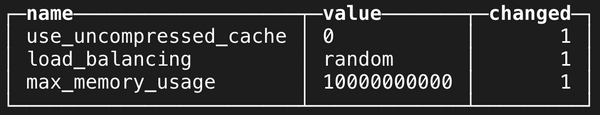
system.settings
This system table contains information on settings that are being used currently, i.e., used for executing queries to read from the system.settings table.
Column information:
| Column Name | Type | Description |
|---|---|---|
| name | String | Setting name |
| value | String | Setting value |
| changed | UInt8 | Whether a setting is explicitly defined or changed in the configuration |
Sample code:
SELECT name,value,changed FROM system.settings WHERE changed;
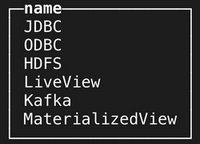
system.table_engines
This system table contains descriptions of table engines supported by the server and their feature support information. It has only one column indicating the table engine name.
Sample code:
select * from system.table_engines limit 5;
system.tables
This system table contains metadata of each table that the server knows about. Detached tables are not displayed in system.tables.
Column information:
| Column Name | Type | Description |
|---|---|---|
| database | String | Name of the database where the table resides |
| name | String | Table name |
| engine | String | Table engine name (without parameters) |
| is_temporary | UInt8 | Flag that indicates whether the table is temporary |
| data_path | String | Path to table data in file system |
| metadata_path | String | Path to table metadata in file system |
| metadata_modification_time | DateTime | Last modified time of table metadata |
| dependencies_database | Array(String) | Database dependencies |
| dependencies_table | Array(String) | Table dependencies (MaterializedView tables based on current table) |
| create_table_query | String | Query that was used to create the table |
| engine_full | String | Table engine parameters |
| partition_key | String | Partition key expression specified in table |
| sorting_key | String | Sorting key expression specified in table |
| primary_key | String | Primary key expression specified in table |
| sampling_key | String | Sampling key expression specified in table |
The system.tables table is used to implement SHOW TABLES queries.
system.zookeeper
This system table can't exist if ZooKeeper is not configured. It allows reading data from the ZooKeeper cluster defined in the configuration. The query must have a path equality condition in the WHERE clause. This is the path to the descendants in ZooKeeper from which you want to get data.
The SELECT * FROM system.zookeeper WHERE path = '/clickhouse' query outputs data of all descendants on the /clickhouse node. To output data of all root nodes, write the path ='/'. If the path specified in path does not exist, an exception will be thrown.
Column information:
| Column Name | Type | Description |
|---|---|---|
| name | String | Node name |
| path | String | Node path |
| value | String | Node value |
| dataLength | Int32 | Value size |
| numChildren | Int32 | Number of descendants |
| czxid | Int64 | ID of the transaction that created the node |
| mzxid | Int64 | ID of the transaction that last changed the node |
| pzxid | Int64 | ID of the transaction that last deleted or added descendants |
| ctime | DateTime | Node creation time |
| mtime | DateTime | Last modified time of node |
| version | Int32 | Node version, i.e., number of times that the node was changed |
| cversion | Int32 | Number of added or deleted descendants |
| aversion | Int32 | Number of changes to ACL |
| ephemeralOwner | Int64 | ID of the session that owns this node for an ephemeral node |
system.mutations
This system table contains information on mutations of MergeTree tables and their progress. Each mutation command is represented by a single row.
Column information:
| Column Name | Type | Description |
|---|---|---|
| database | String | Name of the database to which the mutation was applied |
| table | String | Name of the table to which the mutation was applied |
| mutation_id | String | Mutation ID |
| command | String | Mutation command |
| create_time | DateTime | Time when this mutation command was submitted for execution |
| block_numbers.partition_id | Array(String) | Partition ID |
| block_numbers.number | Array(Int64) | Block number |
| parts_to_do | Int64 | Number of data parts that need to be mutated for the mutation to be completed |
| is_done | UInt8 | Flag indicates whether the mutation is completed |
| latest_failed_part | String | Name of the last part that could not be mutated |
| latest_fail_time | DateTime | Time of the last part mutation failure |
| latest_fail_reason | String | Message of the exception that caused the last part mutation failure |
system.disks
This system table contains information on disks defined in the server configuration.
Column information:
| Column Name | Type | Description |
|---|---|---|
| name | String | Disk name in server configuration |
| path | String | Path to mount point in file system |
| free_space | UInt64 | Available disk space in bytes |
| total_space | UInt64 | Disk volume in bytes |
| keep_free_space | UInt64 | Disk space that should stay available on disk in bytes. It is defined in the keep_free_space_bytes parameter in disk configuration |
system.storage_policies
This system table contains information on storage policies and volumes defined in the server configuration.
Column information:
| Column Name | Type | Description |
|---|---|---|
| policy_name | String | Storage policy name |
| volume_name | String | Volume name as defined in storage policy |
| volume_priority | UInt64 | Volume priority in configuration |
| disks | Array(String) | Disk names as defined in storage policy |
| max_data_part_size | UInt64 | Maximum size of data part that can be stored on volume disks (from 0 to infinite) |
| move_factor | Float32 | Ratio of available disk capacity. When the ratio exceeds this value, ClickHouse will start to move data to the next volume in order |
If the storage policy contains more than one volume, then information for each volume will be stored in individual rows of the table.

 Yes
Yes
 No
No
Was this page helpful?