Feature overview
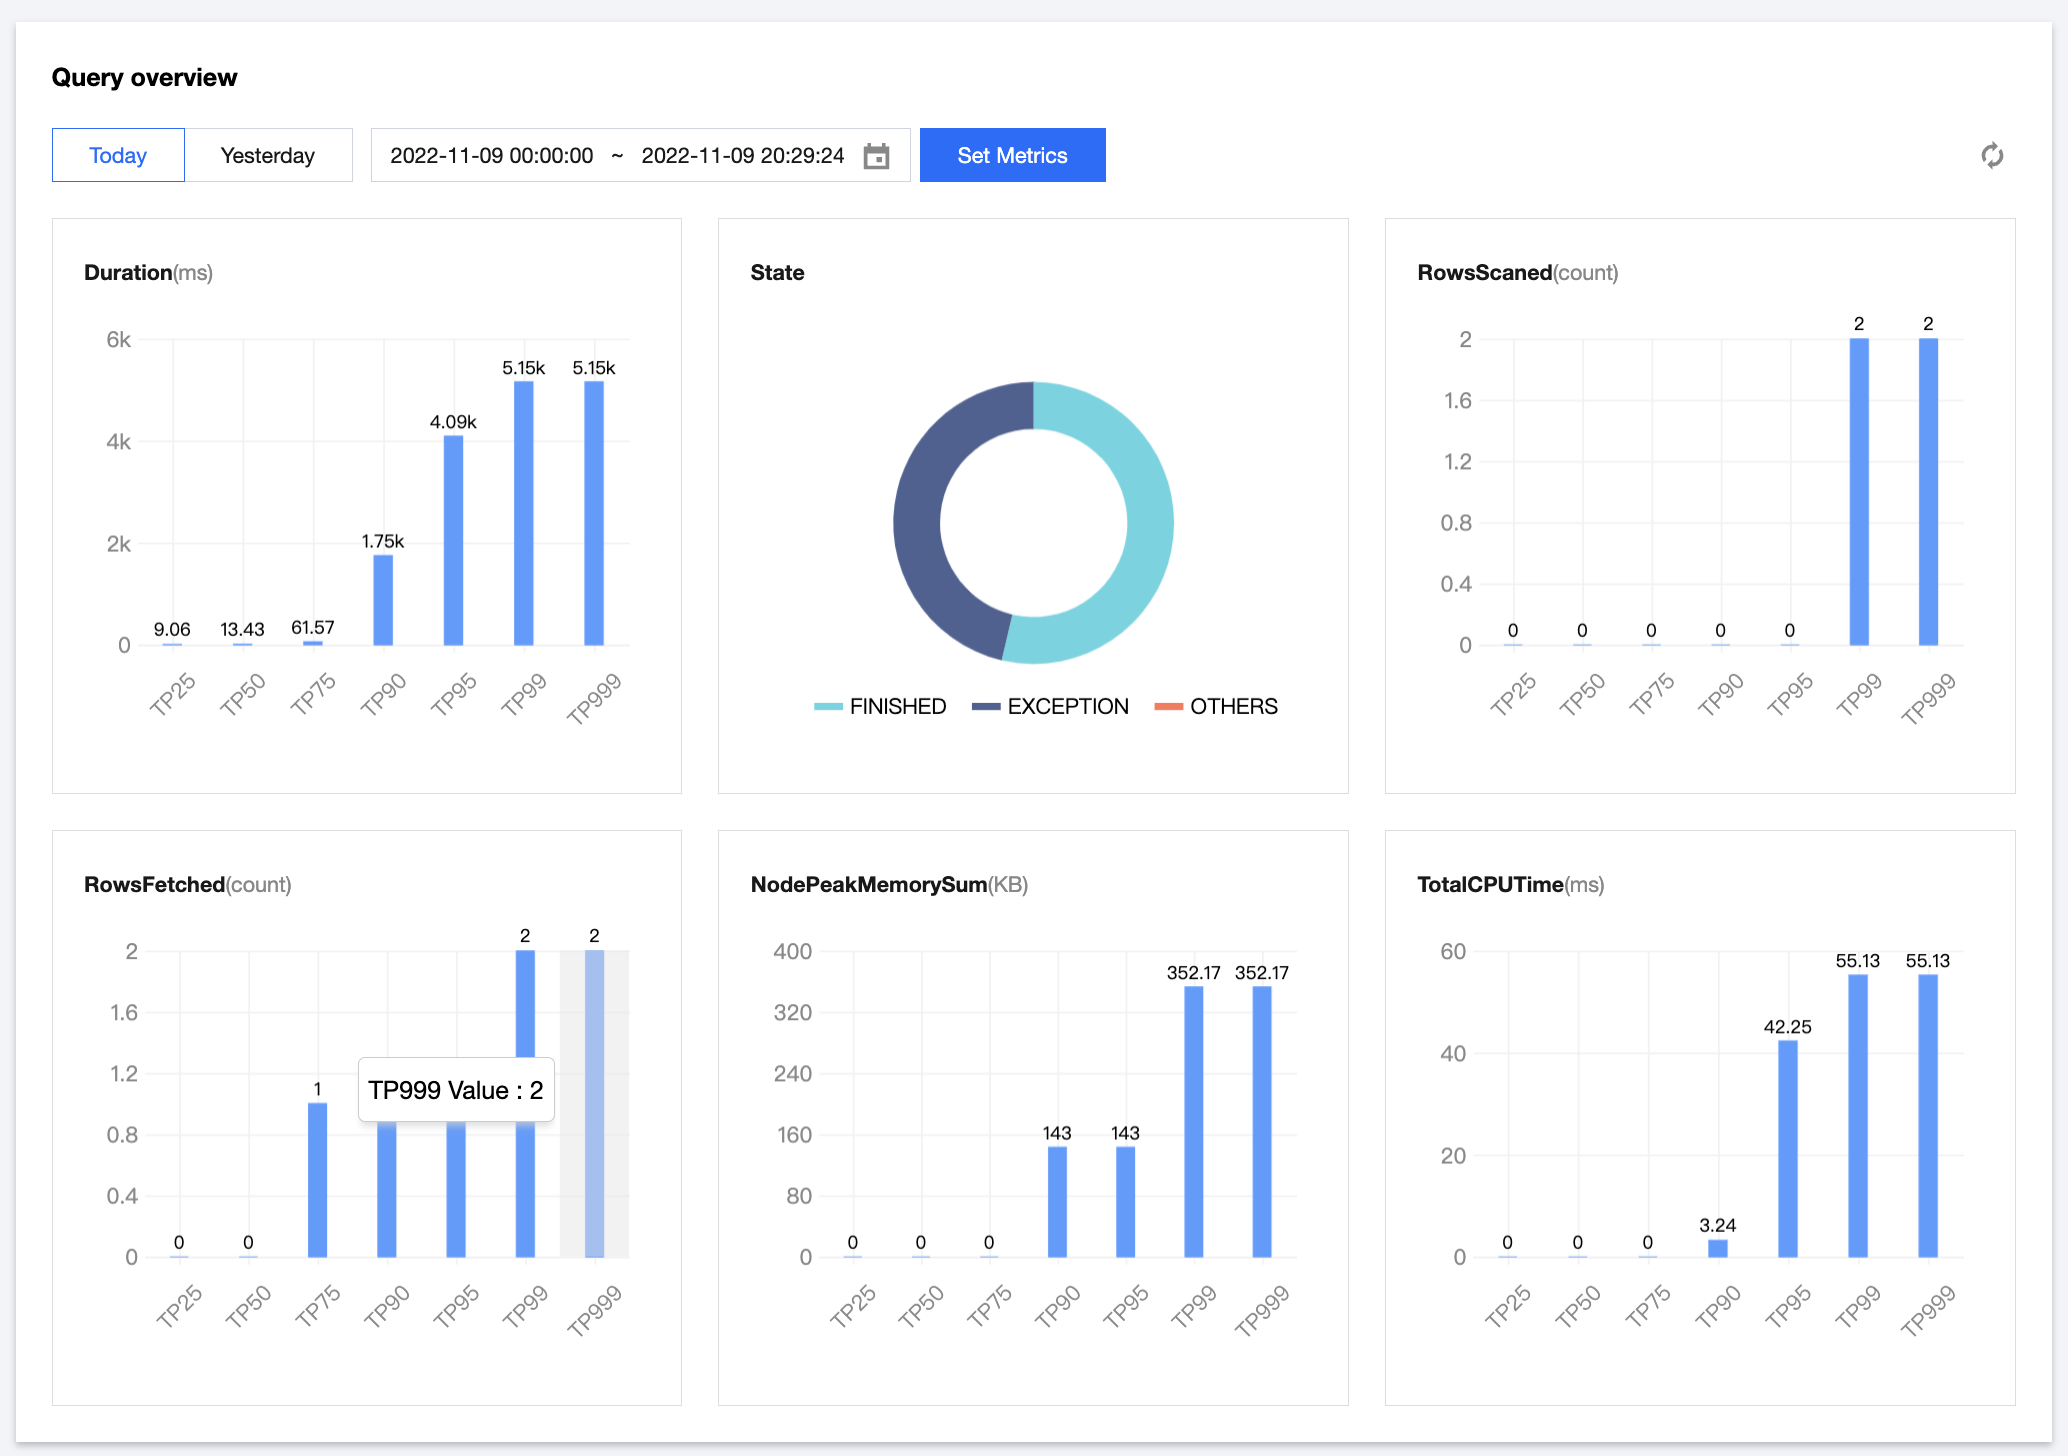
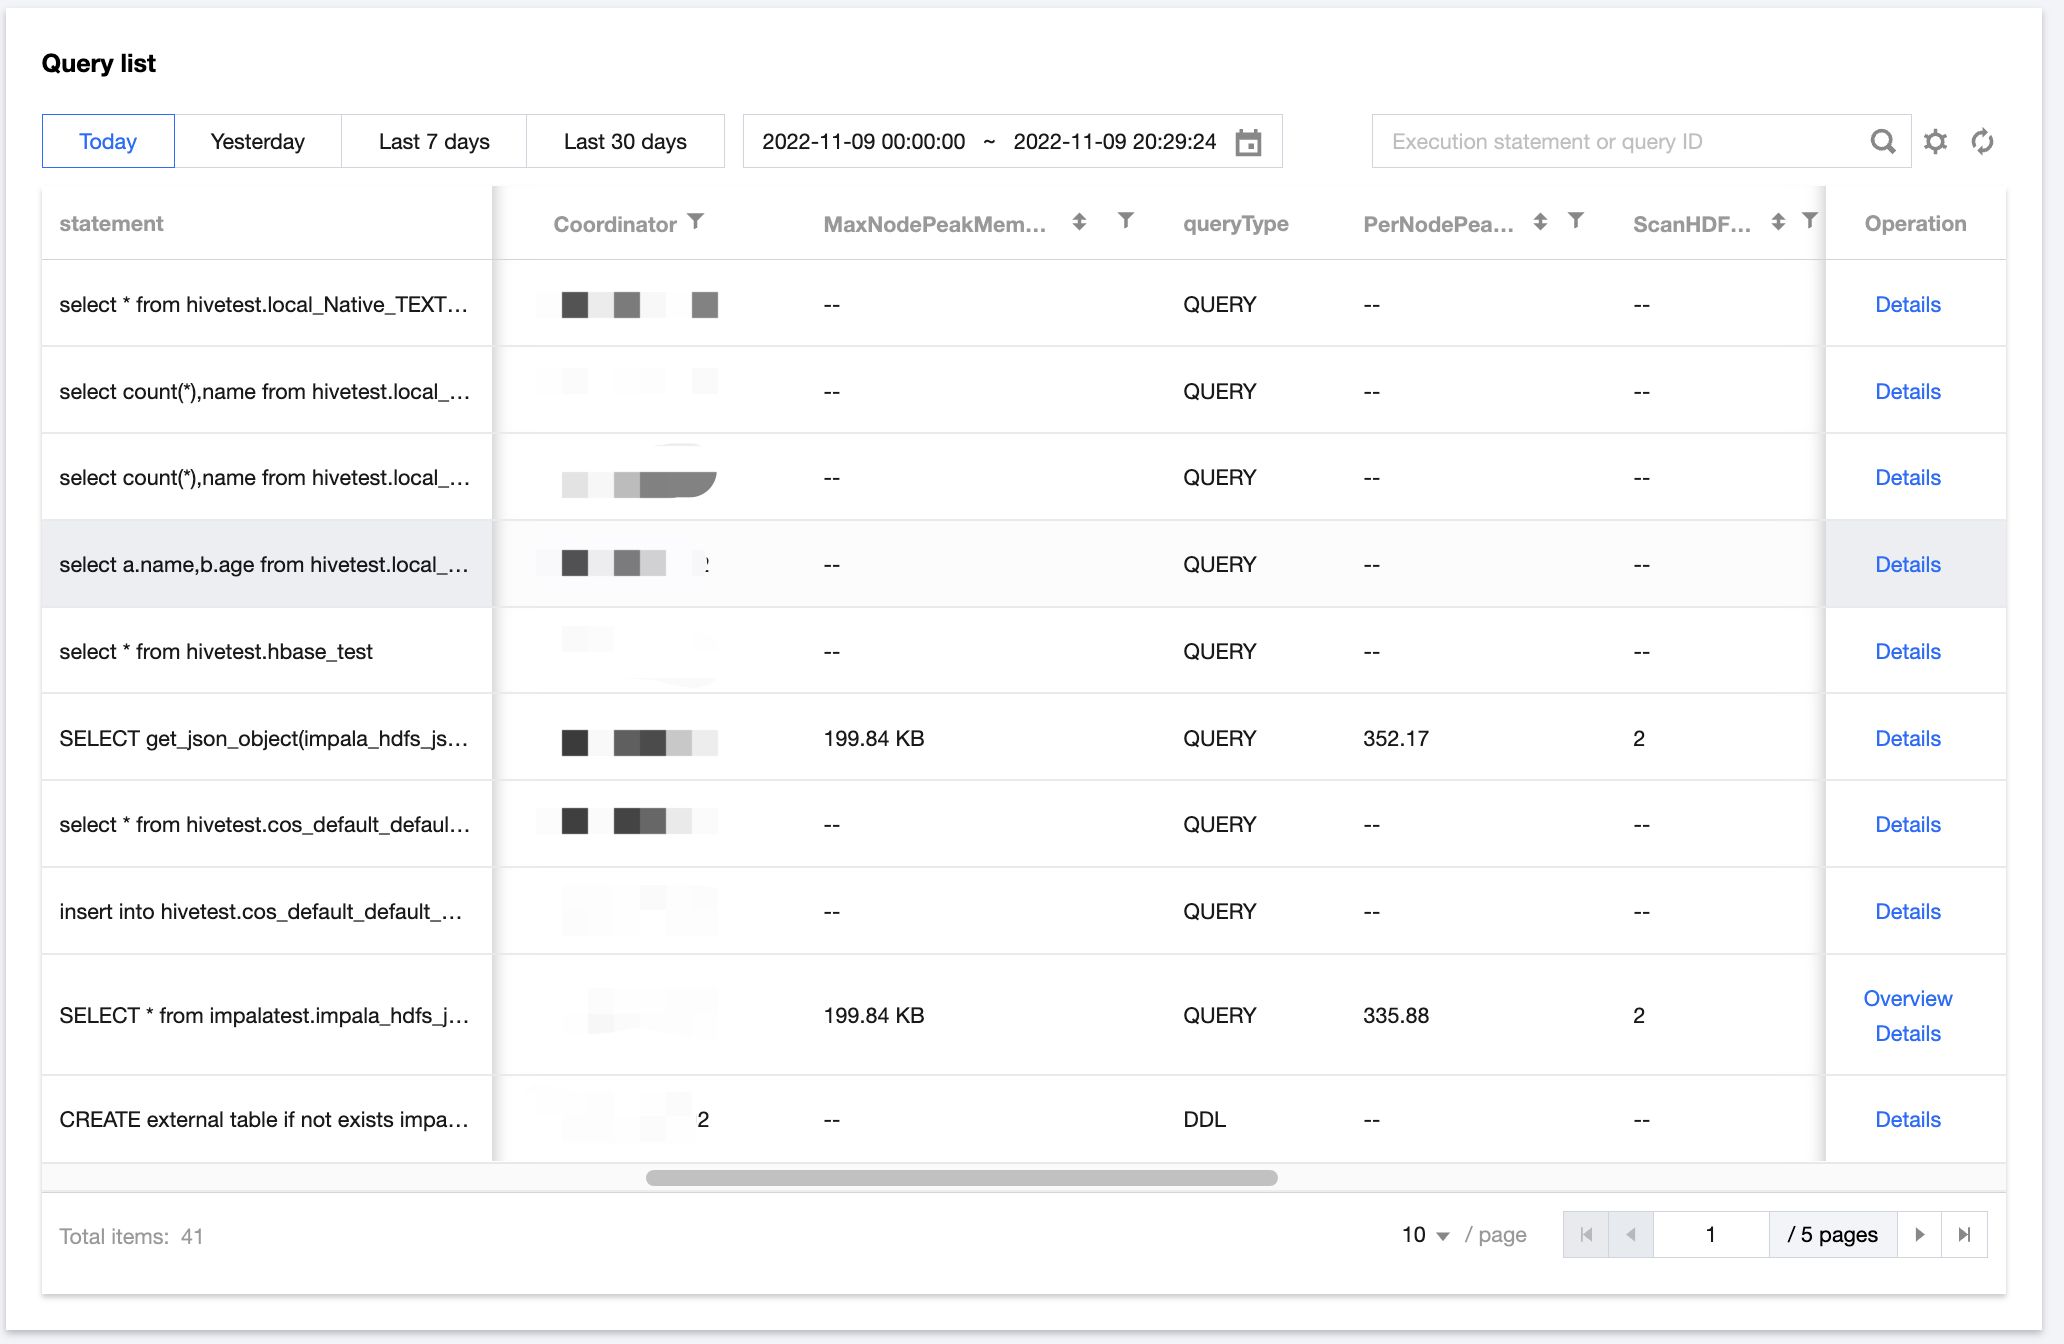
You can view the percentile distribution of various metrics for Impala queries in multiple dimensions. The Impala list allows you to quickly view detailed metrics such as query statements, query status, users, databases, scanned rows, peak memory usage, total read/sent bytes, and HDFS scanned rows.
Directions
1. Log in to the EMR console and click the ID/Name of the target cluster in the cluster list to enter the cluster details page. 2. On the cluster details page, click Cluster Service and select Operation > Query Management in the top-right corner of the Impala component to query jobs.
Take the duration as an example. In the currently selected time range, if the TP90 percentile duration is 6.86k (ms), 90% of queries last for within 6.86s.
3. Impala query list information is provided. Certain column header fields can be filtered and sorted, and compound filtering by multiple dimensions is supported.
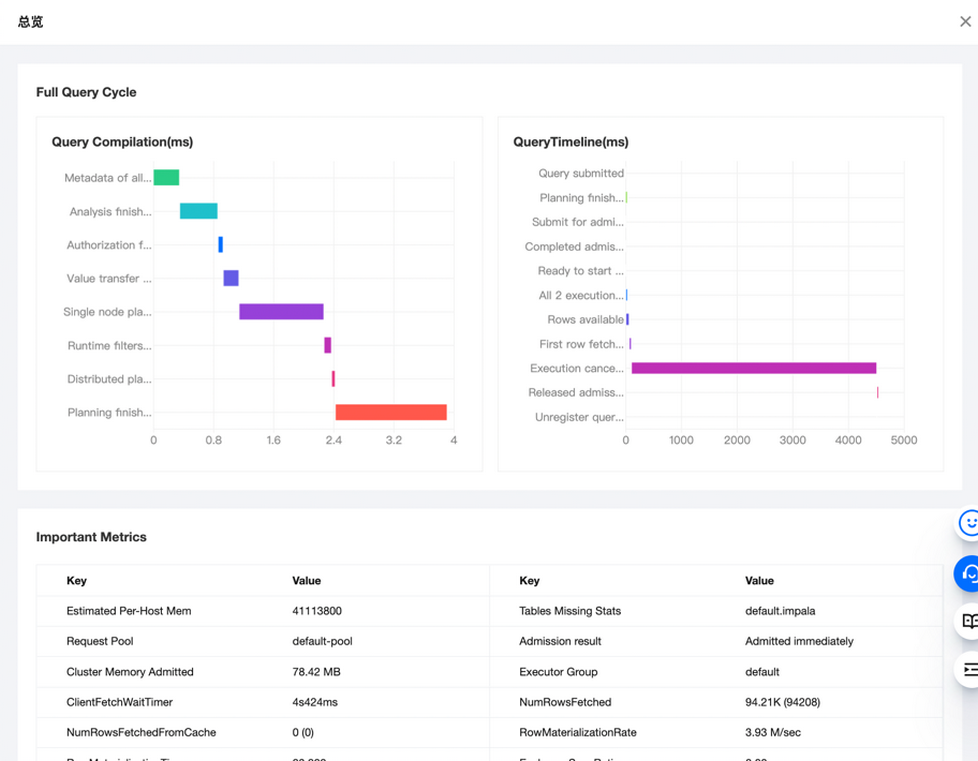
4. Click Overview in the Operation column to view the time distribution information throughout the entire lifecycle of an Impala query, key metric information, and certain node information of the runtime.
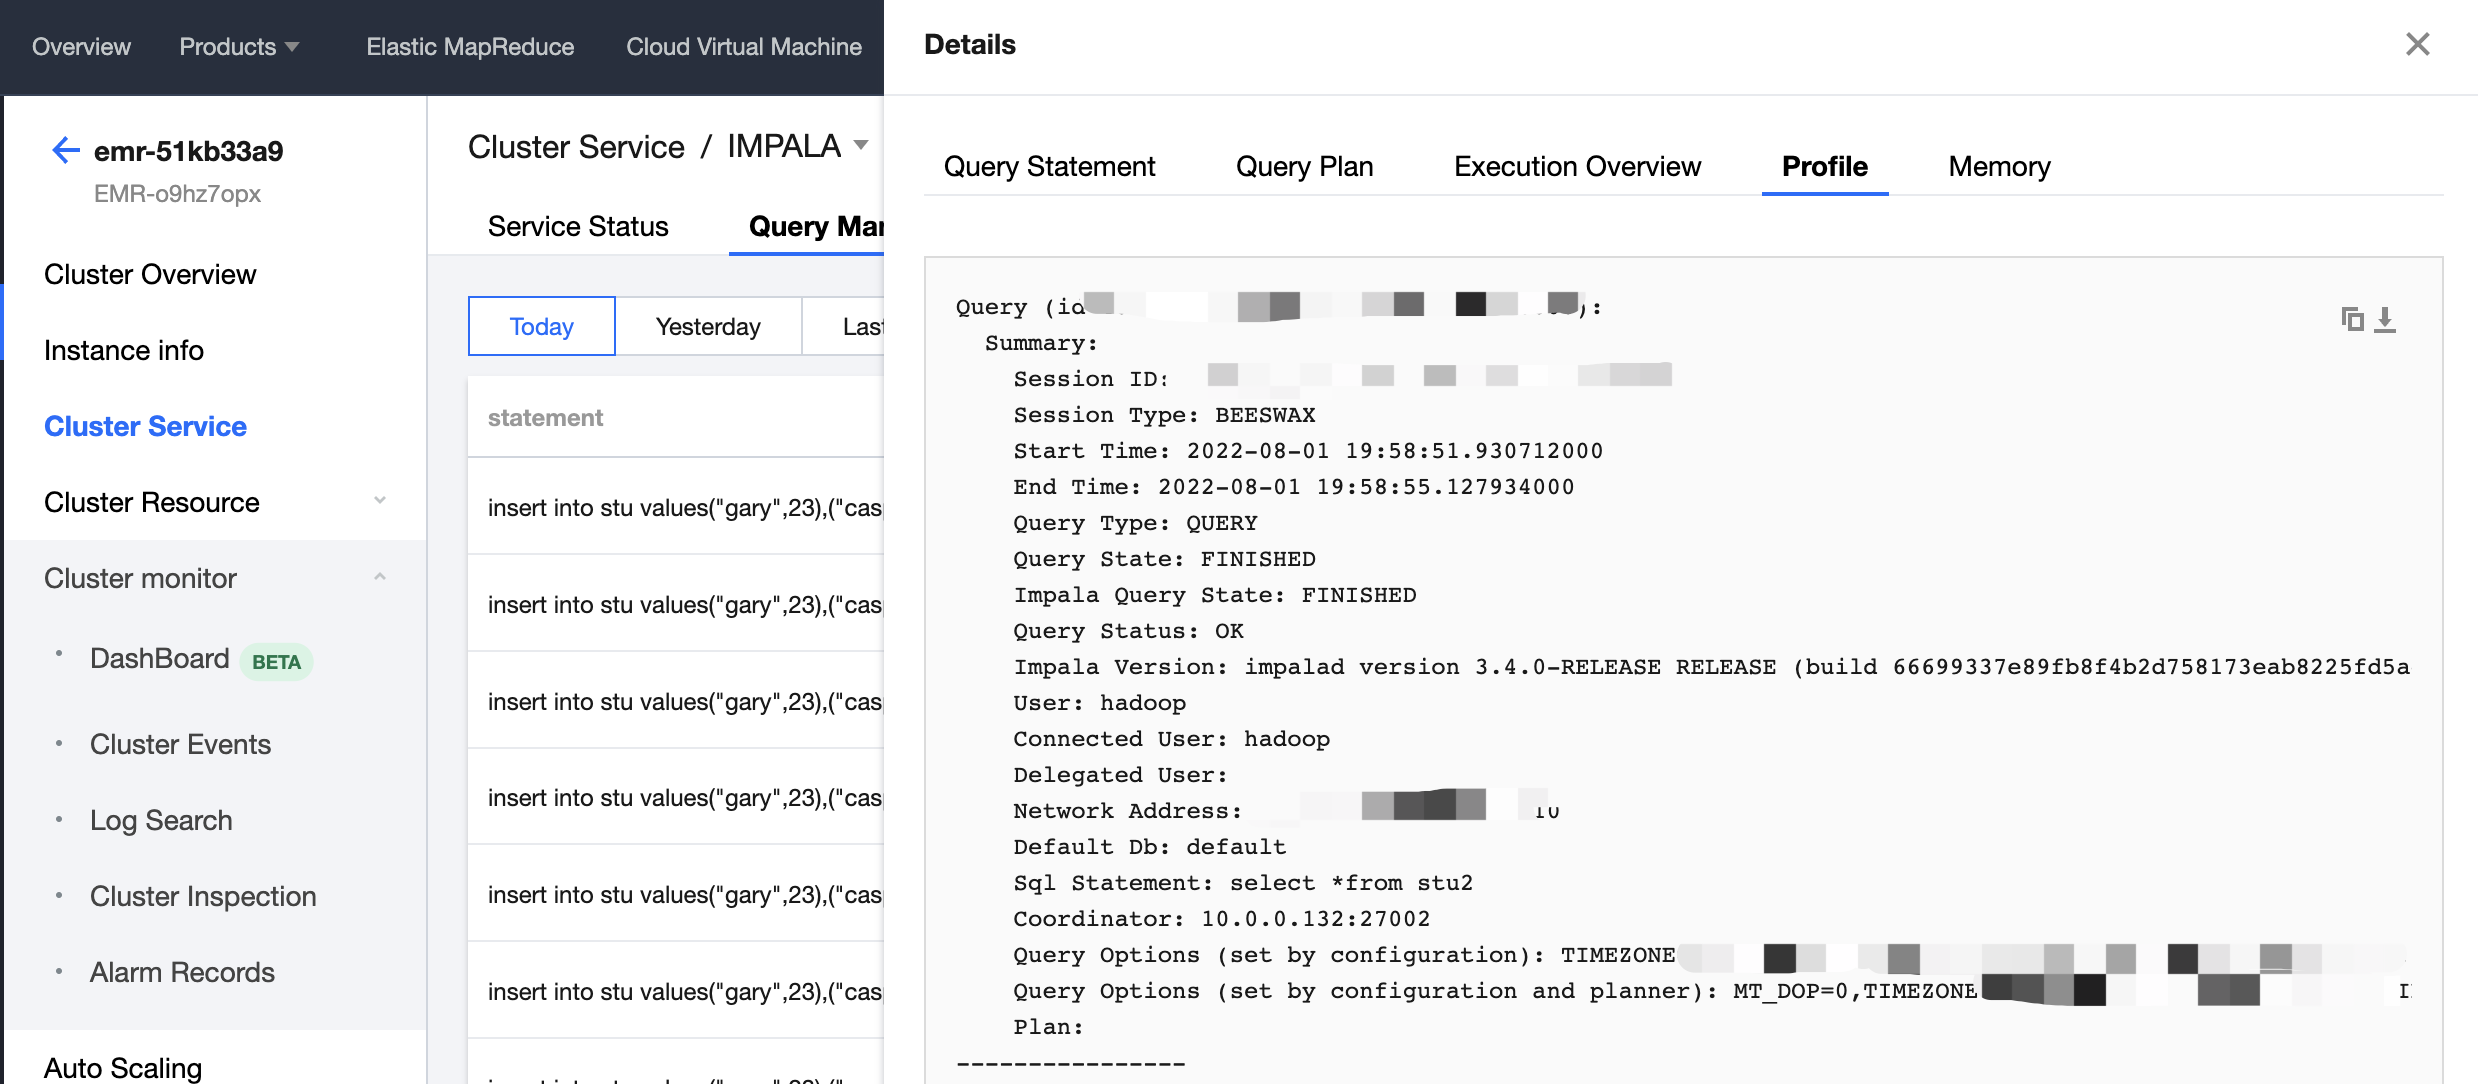
Click Details in the Operation column to view query statements, query plans, execution overview, profiles, and memory information.
Note:
For Impala queries that take more than 3s to execute, you can view profiles in Overview and Details.


