Release Notes
Broker Release Notes
Announcement
Metric Name | Unit | Recommended Attention Level | Recommended Alarm Configuration | Description | Alarm Handling Recommendation |
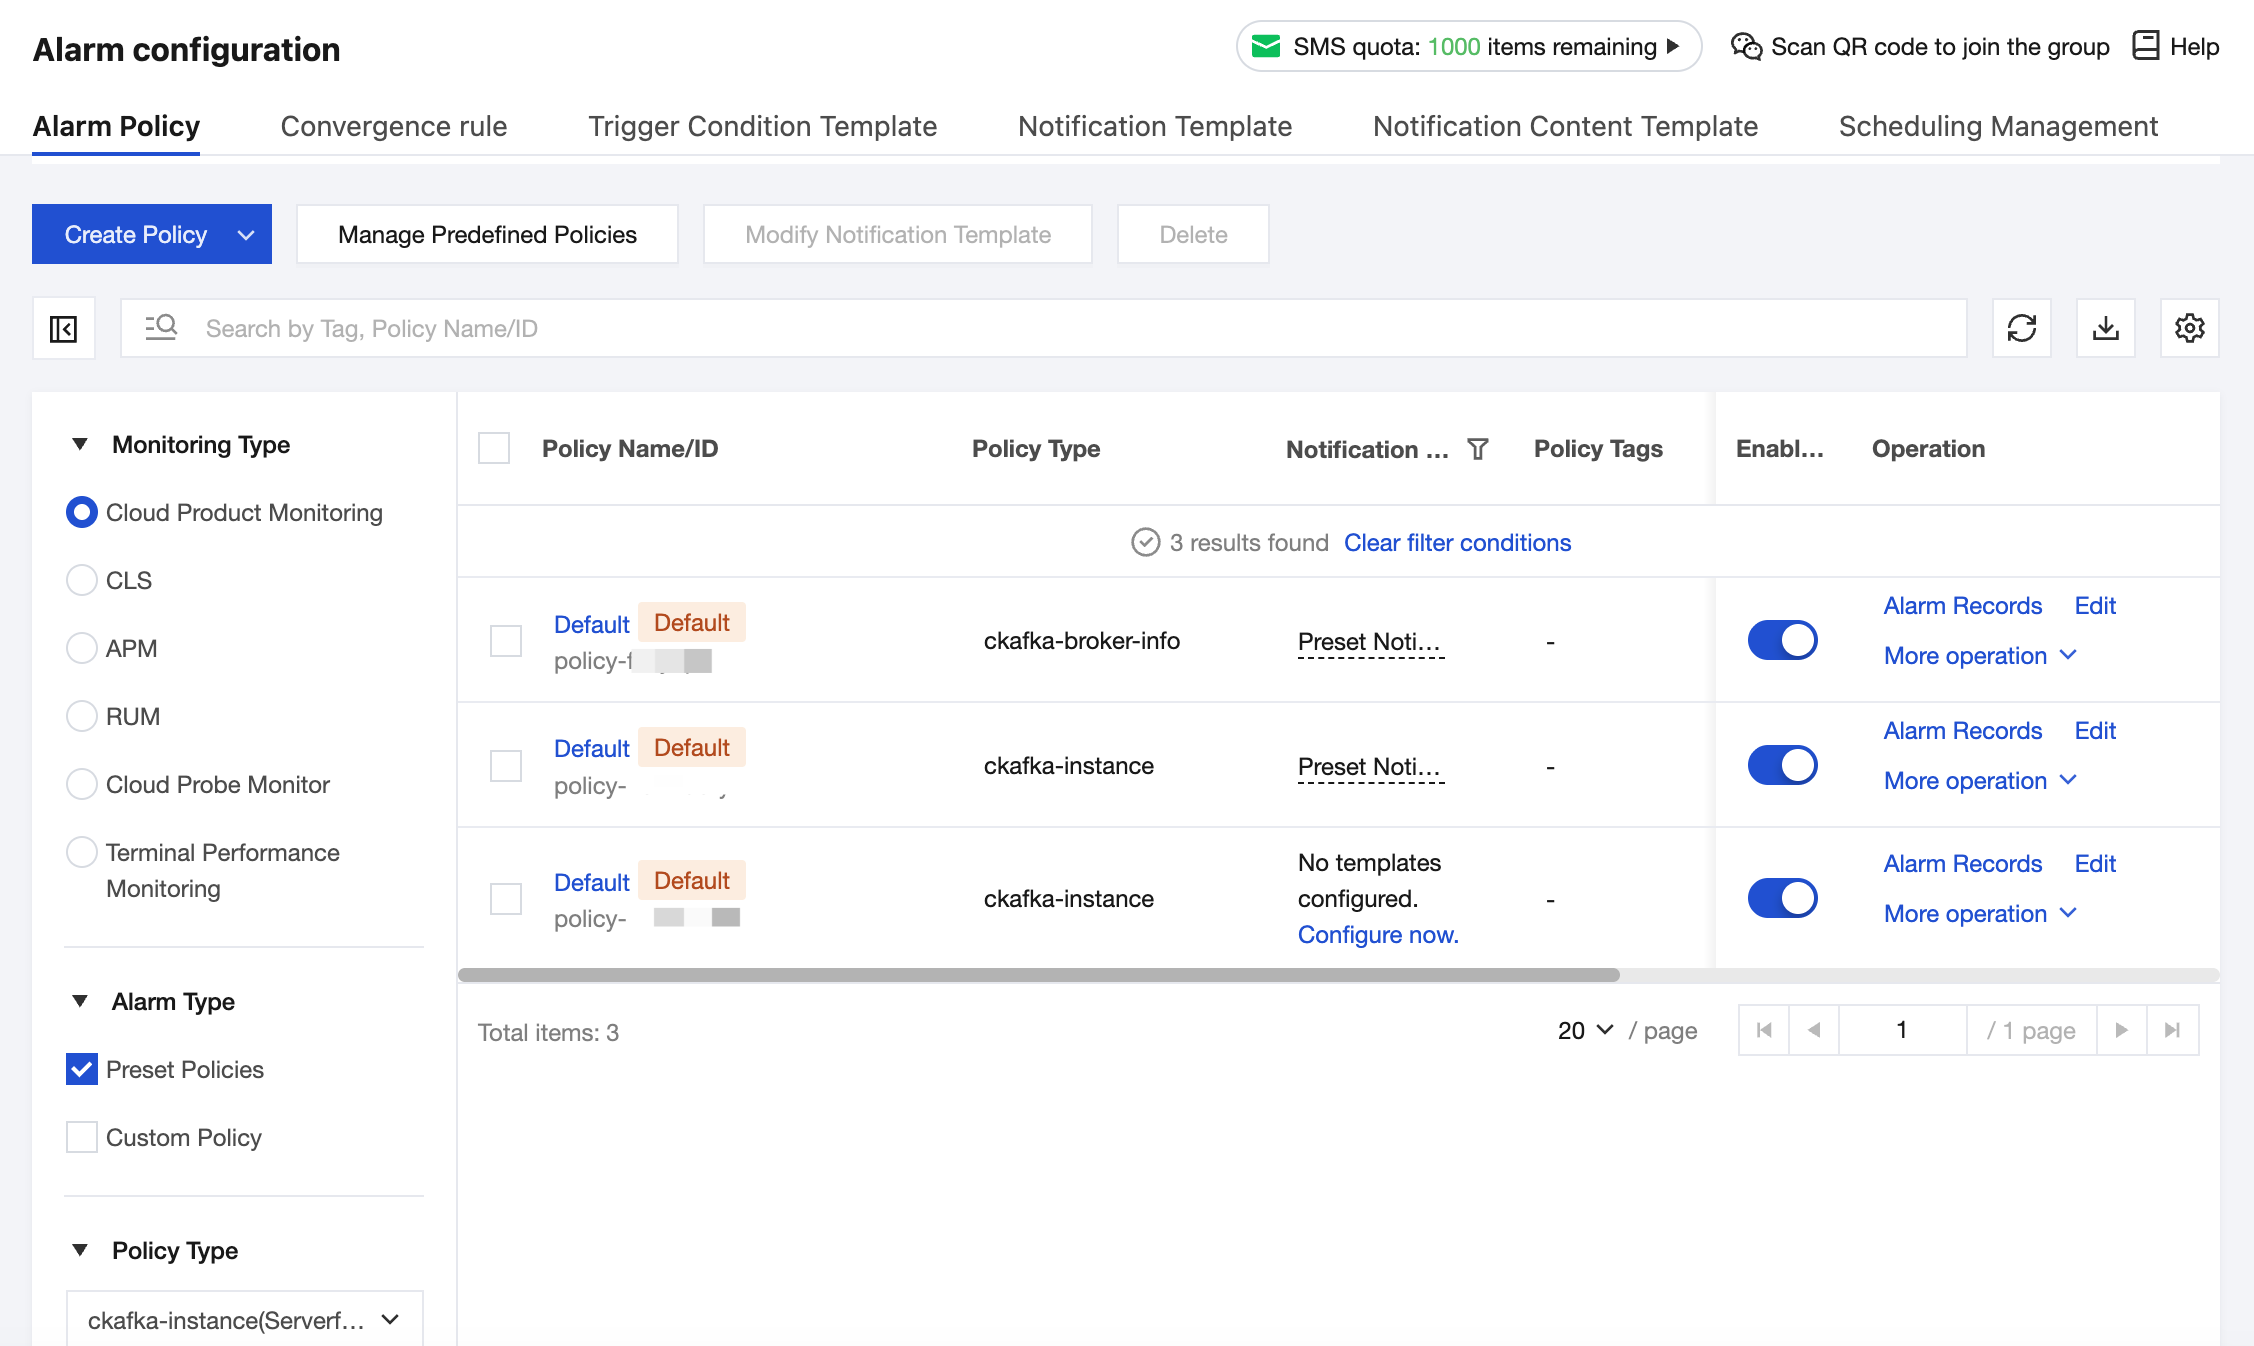
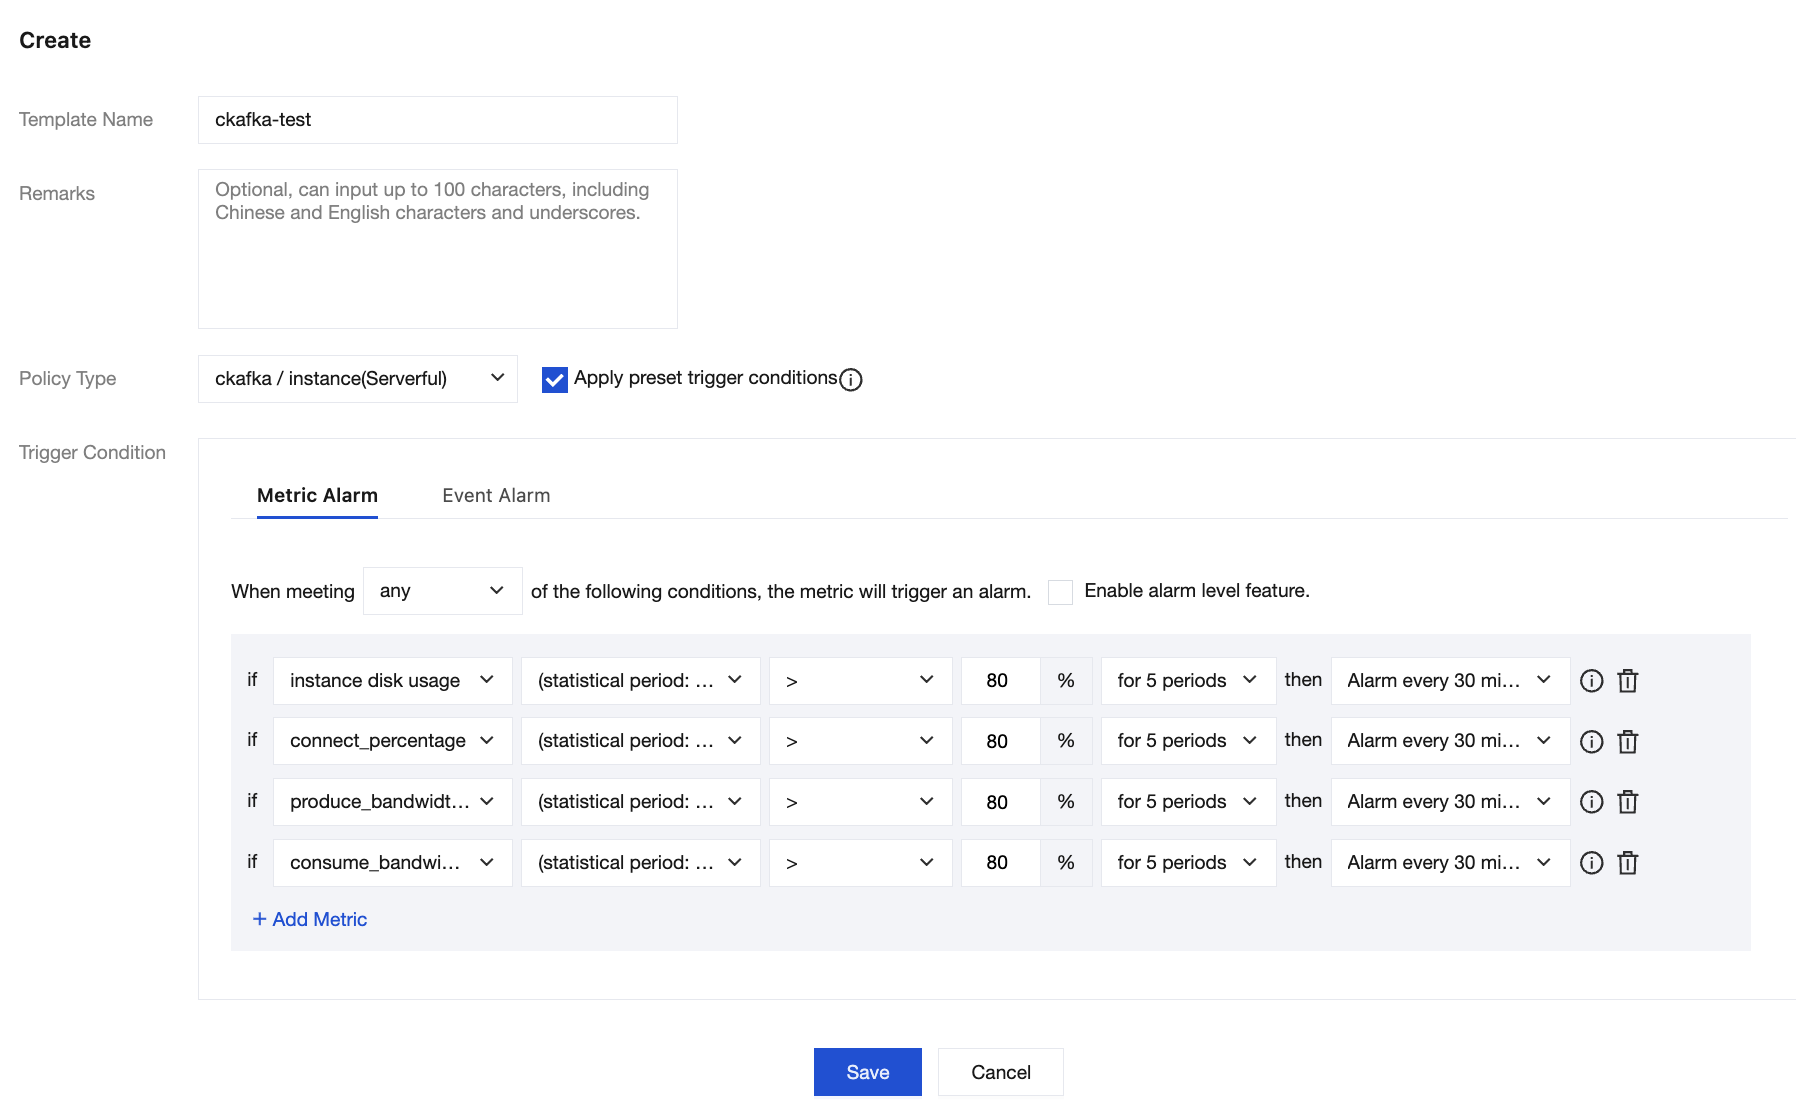
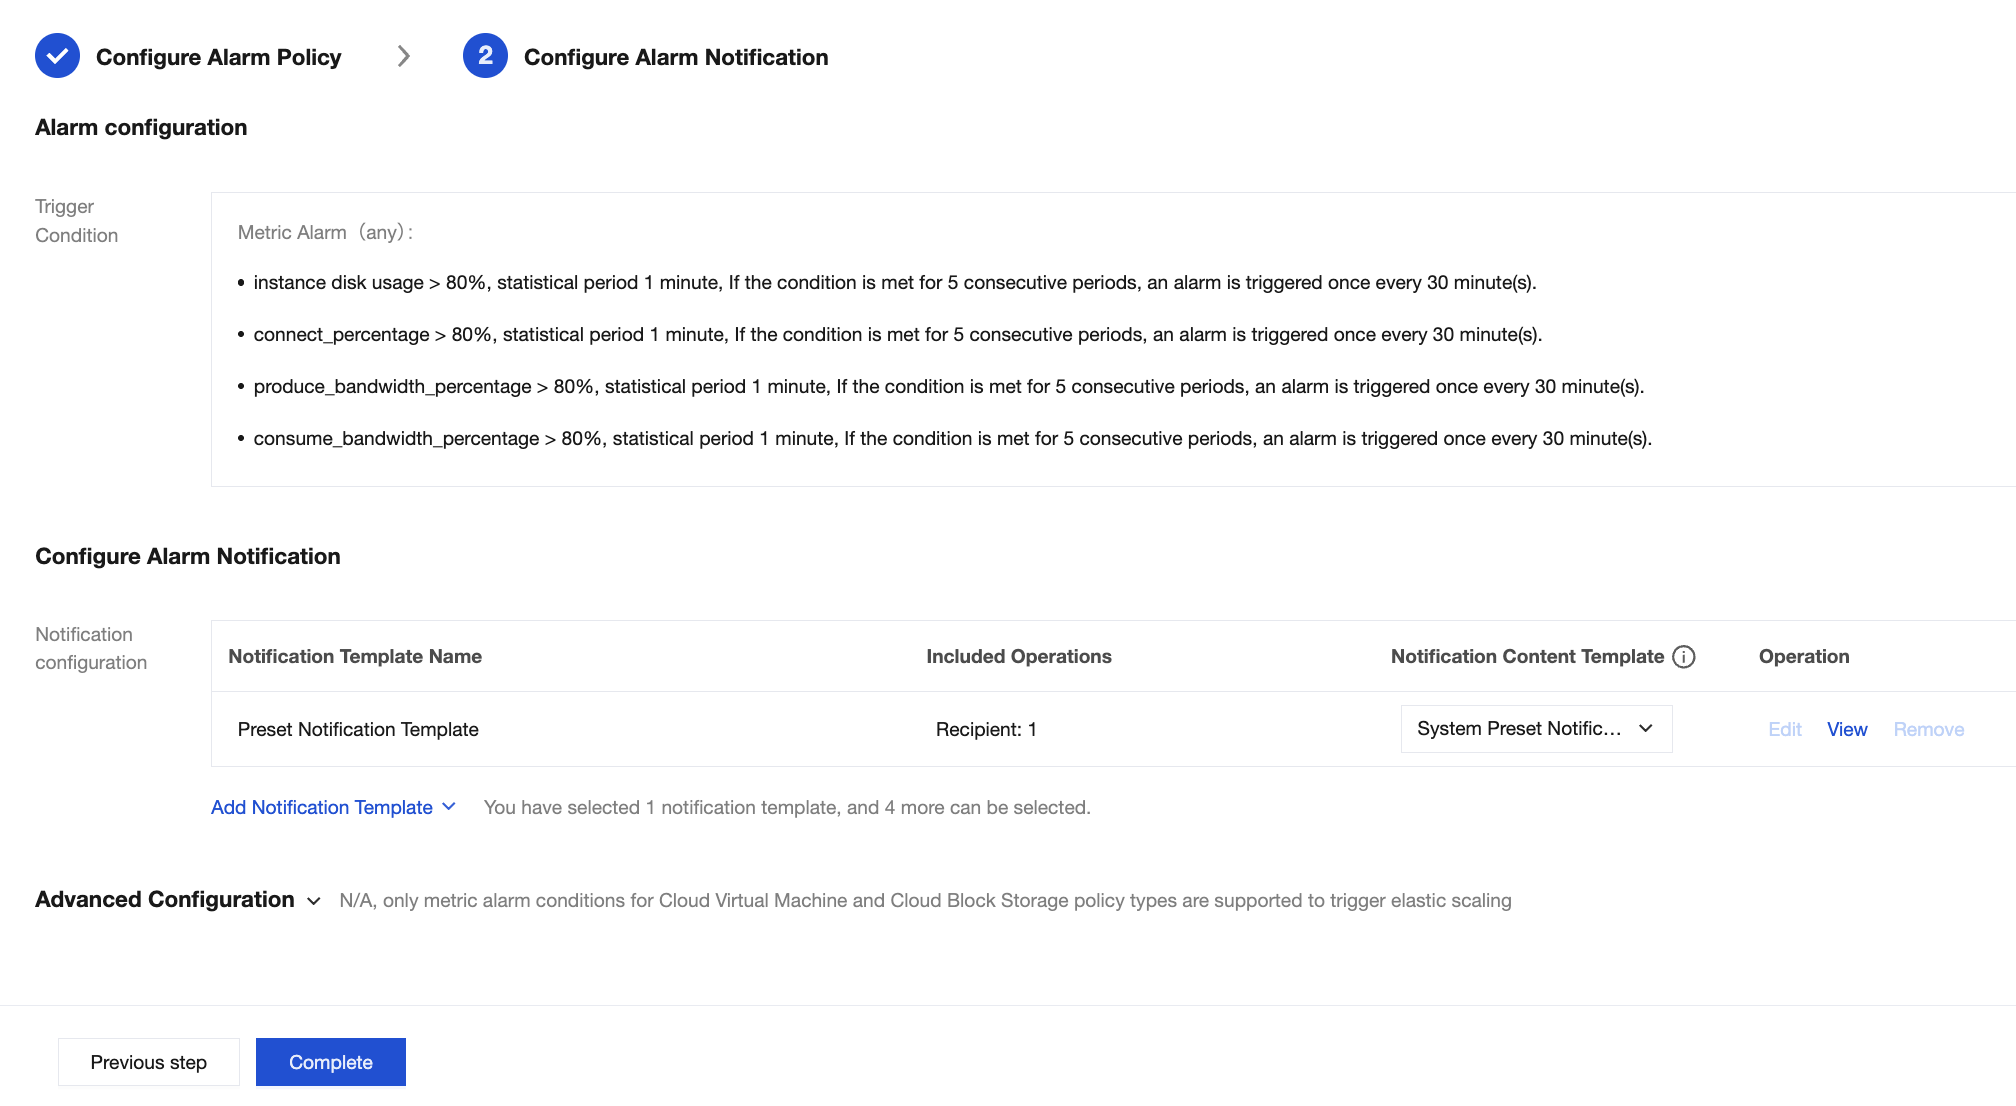
produce_bandwidth_percentage (instance) | % | P0 (default alarm) | The statistical period is 1 minute. If the value exceeds 80% for 5 consecutive periods, an alarm will be triggered once every 10 minutes. | The percentage of the instance production bandwidth quota used. A high percentage may lead to traffic throttling or delays for the producer, affecting real-time delivery of messages. | It is recommended to change the instance specifications on the instance details page or enable elastic bandwidth to provide buffer space. |
consume_bandwidth_percentage (instance) | % | P0 (default alarm) | The statistical period is 1 minute. If the value exceeds 80% for 5 consecutive periods, an alarm will be triggered once every 30 minutes. | The percentage of the instance consumption bandwidth quota used. A high percentage may lead to traffic throttling or delays for the consumer. | It is recommended to change the instance specifications on the instance details page or enable elastic bandwidth to provide buffer space. |
instance conections | Count | P0 (default alarm) | The statistical period is 1 minute. If the value exceeds 80% for 5 consecutive periods, an alarm will be triggered once every 30 minutes. | The number of connections between clients and servers. This metric reflects cluster stability and performance. | It is recommended to optimize the number of clients. If the utilization consistently exceeds 80%, submit a ticket to apply for a quota increase. Reserve 20% buffer space for the number of connections. |
instance disk usage | % | P0 (default alarm) | The statistical period is 1 minute. If the value exceeds 80% for 5 consecutive periods, an alarm will be triggered once every 30 minutes. | Disk utilization represents the average disk utilization across all nodes in the cluster. Excessively high disk utilization will result in insufficient disk space on nodes to accommodate allocated resources, preventing messages from being persisted to disks. | It is recommended to clean up data or scale out the cluster when the average disk utilization exceeds 75%, or configure a disk watermark adjustment policy to prevent impacts on normal business operations. |
Metric Name | Unit | Recommended Attention Level | Recommended Alarm Configuration | Description | Handling Recommendation |
zookeeper disconnects count | Count | P0 (default alarm) | The statistical period is 1 minute. If the value exceeds 3 for 5 consecutive periods, an alarm will be triggered once every 30 minutes. | The number of times the persistent connection between the broker and ZooKeeper disconnects and reconnects. Network fluctuations or high cluster load may cause disconnections and reconnections, which can trigger a leader switch when they occur. There is no normal value range. This value is cumulative. It increments by 1 after each disconnection since broker startup and is reset to 0 only when the broker restarts. The number of ZooKeeper disconnections is cumulative. A high value does not necessarily indicate a cluster issue. Monitor the frequency of ZooKeeper disconnections. If they occur frequently, further troubleshooting is required. | Check in the console whether the cluster load exceeds 80%. If the threshold is exceeded, you can upgrade the bandwidth specifications of the cluster. For specific operations, see Changing Instance Specifications. |
ISR expand count | Count | P0 (default alarm) | The statistical period is 1 minute. If the value exceeds 10 for 5 consecutive periods, an alarm will be triggered once every 30 minutes. | There is no normal value range. Expansions may occur when the cluster experiences fluctuations. Infrequent fluctuations (for example, less than 3 times per hour) require no intervention. If the value persistently increases, troubleshooting is required. | It is recommended to maintain the cluster load level below 80%. If the threshold is exceeded, upgrade the specifications. For specific operations, see Changing Instance Specifications. If the cluster load level is normal, clients can optimize producer parameters by setting linger.ms to a non-zero value and ack to 1. This ensures throughput while reducing synchronization pressure on the cluster. If ISR issues frequently occur, affecting production or consumption, and the situation does not recover for an extended period, contact us. |
ISR shrink count | Count | P0 (default alarm) | The statistical period is 1 minute. If the value exceeds 3 for 5 consecutive periods, an alarm will be triggered once every 30 minutes. | There is no normal value range. Shrinkings may occur when the cluster experiences fluctuations. Instantaneous fluctuations have no impact. If they occur frequently over an extended period, a check is required. | It is recommended to maintain the cluster load level below 80%. If the threshold is exceeded, upgrade the specifications. If the cluster load level is normal, it is recommended to perform manual partition balancing for high-load partitions. For messages with keys, ensure balanced writes by setting a partition policy. If a single partition becomes a bottleneck, increase the number of partitions to improve write parallelism. |
under AR replica | Count | P0 (default alarm) | The statistical period is 1 minute. If the value exceeds 3 for 5 consecutive periods, an alarm will be triggered once every 30 minutes. | To ensure your instance runs normally, CKafka sets up certain built-in topics. These topics may be offline under certain circumstances, but are counted in the number of OSRs, which does not affect your business operations. Under normal circumstances, the number of OSRs should be below 5. If the value remains above 5 for an extended period, it indicates that intervention is required. Occasional broker fluctuations, where the curve value spikes and then returns to normal after a period, are normal phenomena. | When an instance has OSRs, it is usually due to broker node exceptions or network factors. Check the broker logs for troubleshooting. |
Node exceptions | Count | P0 (default alarm) | The statistical period is 1 minute. If the value exceeds 3 for 5 consecutive periods, an alarm will be triggered once every 30 minutes. | The raw metrics for node exceptions originate from broker metrics. If the metrics of the current node are empty, the node is considered abnormal. Common scenarios involve underlying nodes being abnormal and not responding to network requests. | If node exceptions frequently occur, continuously affecting production or consumption, and the situation does not recover for an extended period, contact us. |
Metric Name | Unit | Recommended Attention Level | Recommended Alarm Configuration | Description | Alarm Handling Recommendation |
instance_max_producer_flow | MB/s | P1 (recommended alarm) | Configure an alarm policy based on the purchased specifications. Recommended threshold: Bandwidth specification x 80%. The statistical period is 1 minute. If the value exceeds the threshold for 5 consecutive periods, an alarm will be triggered once every 30 minutes. | The peak bandwidth of production messages for a single replica of the instance. This metric reflects business throughput and indicates bandwidth costs. Exceeding the purchased specifications may lead to traffic throttling, and adjustments should be made promptly. | It is recommended to change the instance specifications on the instance details page or enable elastic bandwidth to provide buffer space. |
instance_max_consumer_flow | MB/s | P1 (recommended alarm) | Configure an alarm policy based on the purchased specifications. Recommended threshold: Bandwidth specification x 80%. The statistical period is 1 minute. If the value exceeds the threshold for 5 consecutive periods, an alarm will be triggered once every 30 minutes. | The peak consumption bandwidth for the instance. This metric reflects the processing capability of the consumer. Exceeding the purchased specifications may lead to traffic throttling, and adjustments should be made promptly. | It is recommended to change the instance specifications on the instance details page or enable elastic bandwidth to provide buffer space. |
messages offset count (instance) | Count | P1 (recommended alarm) | Configure an alarm policy based on the actual business specifications. Recommended threshold: Disk capacity/Average message size x 60%. The statistical period is 1 minute. If the value exceeds the threshold for 5 consecutive periods, an alarm will be triggered once every 30 minutes. | Total number of messages persisted to disks for an instance (excluding replicas). If the value is too high, it may indicate insufficient consumer processing capacity. Optimize the consumer processing speed or expand the disk capacity. | It is recommended to increase the message consumption speed or configure the disk watermark adjustment policy for the instance on the Auto Scaling page in Intelligent Ops. |
max_produce_flow(topic) | MB/s | P1 (recommended alarm) | Configure an alarm policy based on the purchased specifications. Recommended threshold: Topic bandwidth specification x 80%. The statistical period is 1 minute. If the value exceeds the threshold for 5 consecutive periods, an alarm will be triggered once every 30 minutes. | The maximum production traffic of a topic per unit time (excluding the traffic generated by replicas). | A high value may trigger production traffic throttling. You need to monitor peak values. If the value is excessively high, consider configuring traffic throttling rules for the current topic. |
max_consume_flow(topic) | MB/s | P1 (recommended alarm) | Configure an alarm policy based on the purchased specifications. Recommended threshold: Topic bandwidth specification x 80%. The statistical period is 1 minute. If the value exceeds the threshold for 5 consecutive periods, an alarm will be triggered once every 30 minutes. | The maximum consumption traffic of a topic per unit time (excluding the traffic generated by replicas). | It is recommended to observe the topic subscription relationships and producer connection relationships, enhance the consumption capability, or perform manual partition balancing to redirect traffic. |
messages offset count(topic) | Count | P1 (recommended alarm) | Configure an alarm policy based on the actual business specifications. Recommended threshold: Disk capacity/Number of topics/Average message size x 60%. The statistical period is 1 minute. If the value exceeds the threshold for 5 consecutive periods, an alarm will be triggered once every 30 minutes. | Total number of messages persisted to disks for a topic (excluding replicas). Continuous increase may indicate insufficient consumption capacity for the subscribed topic. Check the consumer group status or reduce the message retention period. | It is recommended to troubleshoot and adjust consumer parameters to improve throughput, or adjust the advanced parameters of the topic, dynamically set the message retention period, and evaluate increasing the number of partitions to enhance parallel consumption capability. |
Metric Name | Unit | Recommended Attention Level | Recommended Alarm Configuration | Description | Alarm Handling Recommendation |
Live Broker Nodes | % | P1 (recommended alarm) | The statistical period is 1 minute. If the value is less than 100% for 5 consecutive periods, an alarm will be triggered once every 30 minutes. | The service status of each broker node. This metric allows you to monitor node availability through the heartbeat mechanism. If the node liveness rate is below the normal value, namely, a broker is down, it will trigger ISR shrinking. Alarm and default alarm policy will be available soon. | When the node status is abnormal, it is recommended to immediately restart the faulty node and check the system resource usage. If multiple restart attempts fail, contact online customer service. |
Cluster Load | % | P1 (recommended alarm) | The statistical period is 1 minute. If the value exceeds 80% for 5 consecutive periods, an alarm will be triggered once every 30 minutes. | Cluster overall load, which is the maximum value among all nodes. For single-AZ deployment, the cluster load should be less than 70%. For a two-AZ deployment, the normal cluster load should be less than 35%. For a three-AZ deployment, the normal cluster load should be less than 47%. If the bandwidth utilization is low but the cluster load is high, it is necessary to scale out the cluster bandwidth based on cluster load metrics. Alarm and default alarm policy will be available soon. | It is recommended to promptly upgrade the cluster bandwidth specification when the load is excessively high. For more information, see Use Cases of Cluster Capacity Planning. |


Was this page helpful?
You can also Contact sales or Submit a Ticket for help.
Help us improve! Rate your documentation experience in 5 mins.
Feedback