Scenarios
If you need to integrate and connect TDMQ for CKafka (CKafka) monitoring metrics with your own Ops platform, CKafka provides two methods to connect to Prometheus monitoring:
1. Integration based on Tencent Cloud Observability Platform (TCOP)
Cloud product monitoring can be configured by using Prometheus and Grafana provided by TCOP. It supports integrating and displaying the metrics collected by Cloud Monitor through Prometheus. For more information, see Cloud Monitor. 2. Connection based on open-source standard Prometheus Exporter
CKafka allows Pro Edition users to connect to Prometheus based on the open-source standard Prometheus Exporter. The details are as follows:
Instance-level metrics: Pro Edition instances provide all users with an access method to external monitoring services by default. You can monitor CKafka instances through the provided access points. The metrics include but are not limited to Out-of-Sync Replicas, Topic Read/Write Rates, Request Response Time, and a series of other observable metrics from Apache Kafka.
Node-level metrics: Pro Edition instances provide node metric information scraped by Prometheus Exporter, including but not limited to basic monitoring metrics such as CPU and memory usage, system load, as well as metrics exposed by the broker JMX. All relevant metrics can be aggregated, displayed, and analyzed after being collected by Prometheus.
This document describes how to connect CKafka to Prometheus monitoring based on the open-source standard Prometheus Exporter.
Operation Steps
Step 1: Obtaining Prometheus Monitoring Objects
2. In the left sidebar, select Instance List. Click the ID of the target instance to go to the basic instance information page.
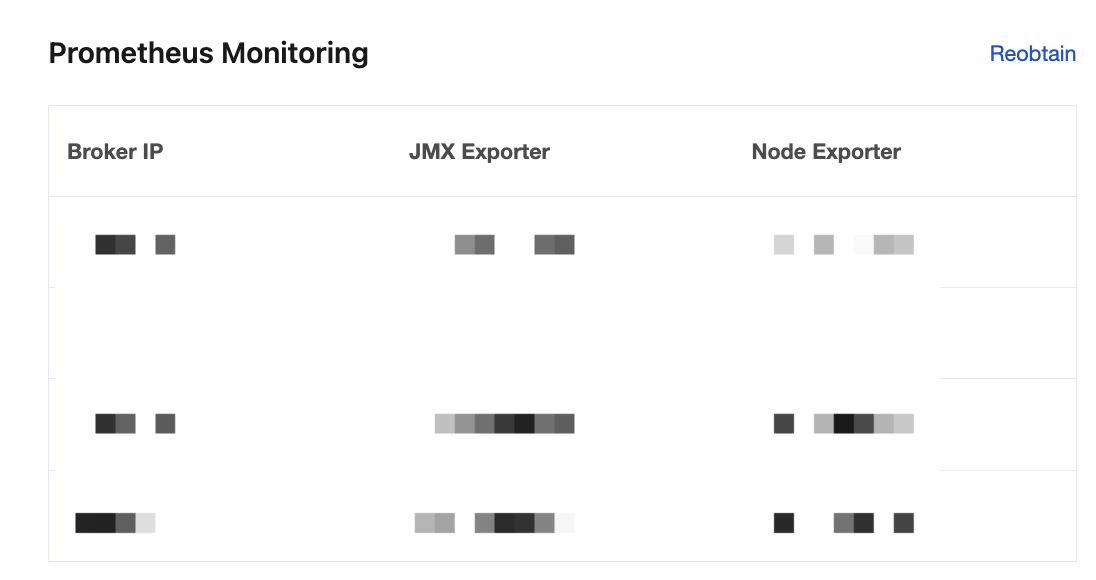
3. In the Prometheus Monitoring module, click Get Monitoring Target in the upper-right corner, and select a Virtual Private Cloud (VPC) network and subnet.
4. Click Submit to obtain a group of monitoring targets.
5. Click Reobtain in the upper-right corner of the Prometheus monitoring instance. The monitoring addresses under the existing network will be deleted.
6. Click OK to re-obtain monitoring targets.
Note:
If the instance undergoes operations such as migration, specification change, or availability zone (AZ) change, the underlying brokers may migrate, causing Prometheus monitoring data to become unavailable. In this case, you need to click Re-obtain in the console to obtain the latest Exporter IP address and port.
Step 2: Collecting Monitoring Data with Prometheus
1. Download Prometheus and configure the monitoring scrape address. 2. Go to the directory where the Prometheus package resides and run the following command to extract the Prometheus package.
tar -vxf prometheus-2.30.3.linux-amd64.tar.gz
3. Modify the configuration file prometheus.yml to add scraping jobs for jmx_exporter and node_exporter.
scrape_configs:  # The job name is added as a label `job=<job_name>` to any timeseries scraped from this config.  - job_name: "prometheus"    # metrics_path defaults to '/metrics'    # scheme defaults to 'http'.    static_configs:      - targets: ["localhost:9090"]
  - job_name: "broker-jmx-exporter"    scrape_interval: 5s    metrics_path: '/metrics'    static_configs:      - targets: ['10.x.x.0:60001','10.x.x.0:60003','10.x.x.0:60005']        labels:           application: 'broker-jmx'  - job_name: "broker-node-exporter"    scrape_interval: 10s    metrics_path: '/metrics'    static_configs:       - targets: ['10.x.x.0:60002','10.x.x.0:60004','10.x.x.0:60006']         labels:           application: 'broker-node'
broker-jmx-exporter is the label for the Prometheus configuration to scrape the JMX metrics of the broker. The targets include the mapped port information.
broker-node-exporter is the label for the configuration to scrape basic metrics of the node where the broker resides. scrape_interval is the frequency for scraping metric data.
4. Start Prometheus.
./prometheus --config.file=prometheus.yml --web.enable-lifecycle
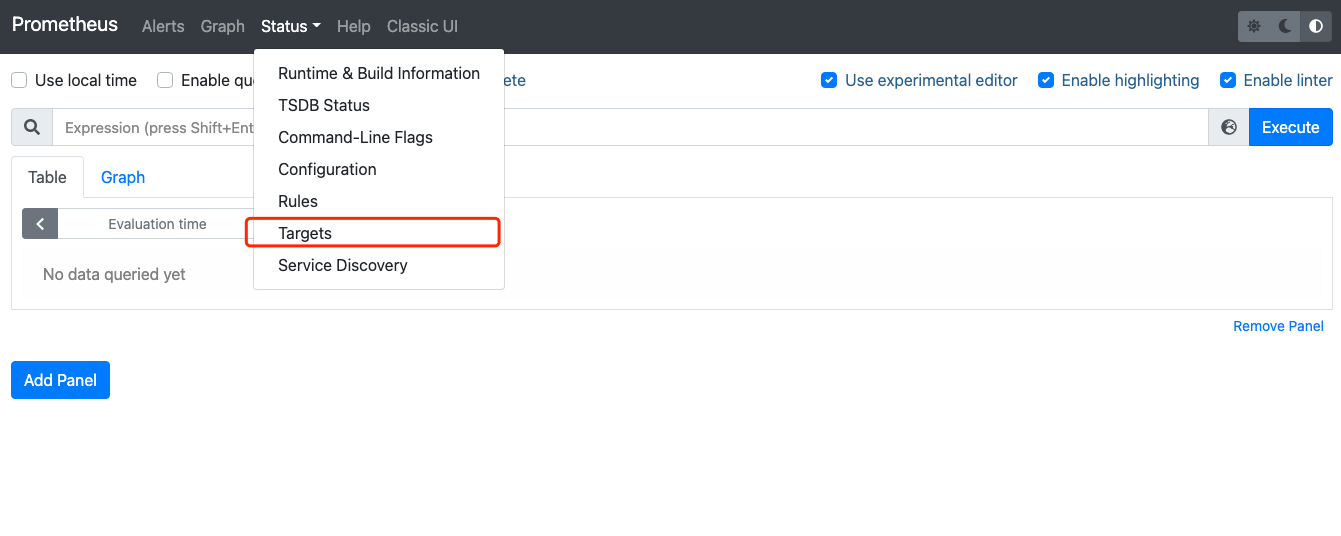
5. Open the UI page provided by Prometheus to check whether the status of the connected targets is normal. For example, you can enter http://localhost:9090 in your browser.
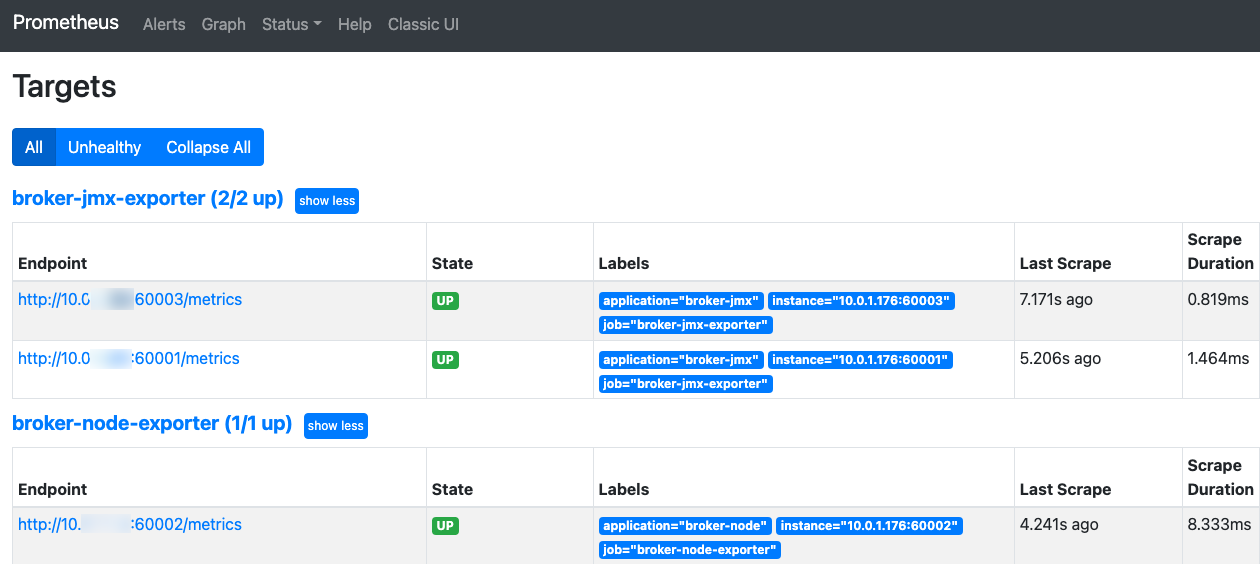
6. Verify that the status of all targets is UP.
If the status of a target is DOWN, check whether network access is reachable or view the reason in the Error option in the last column of the status bar.
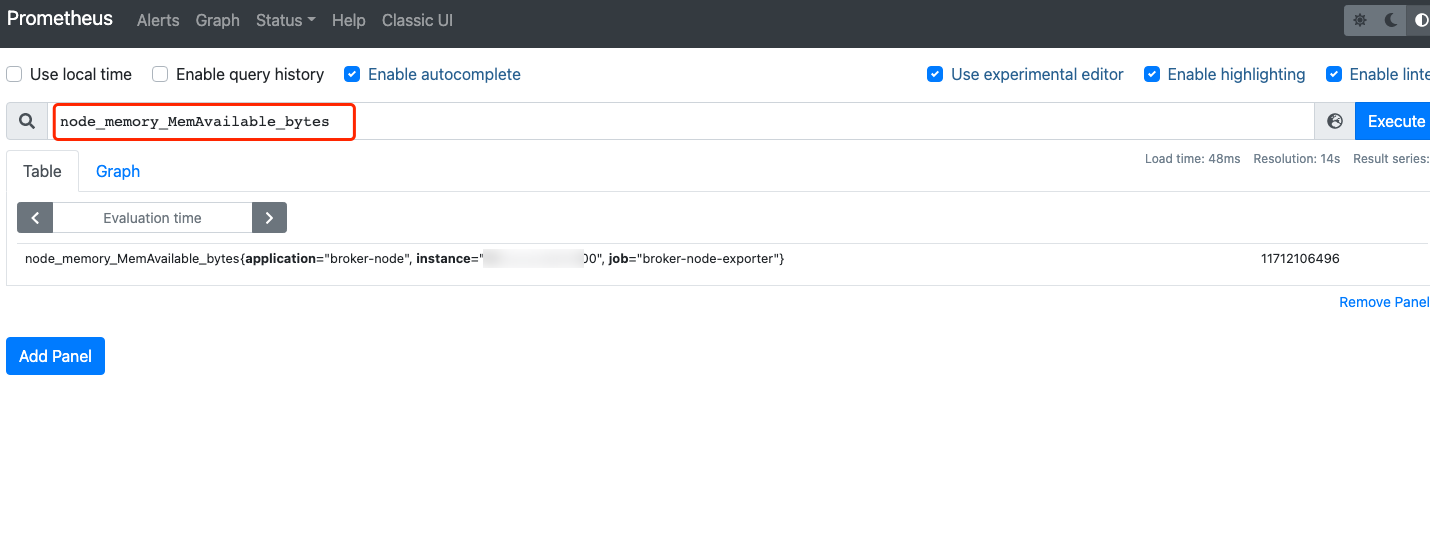
7. Query the monitoring metric data.
Click the Graph option, enter the name of the metric you want to query, and then view the corresponding monitoring data. For example, you can enter node_memory_MemAvailable_bytes and click Execute.
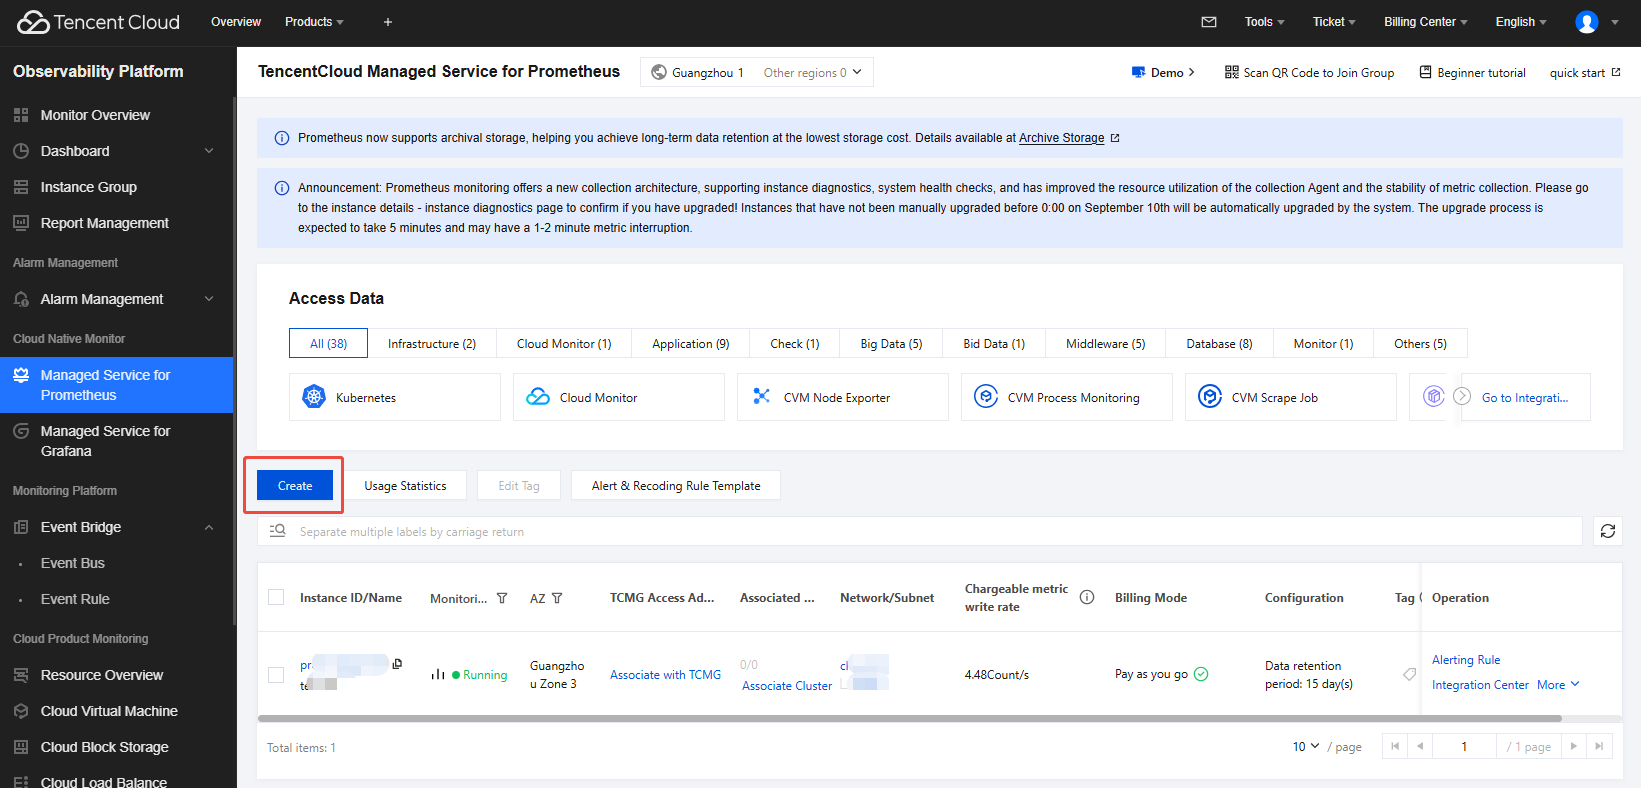
1. Log in to TCOP and select TMP. If no TencentCloud Managed Service for Prometheus (TMP) instance exists, click Create to create one. For detailed instructions, see Creating a TMP Instance. Note:
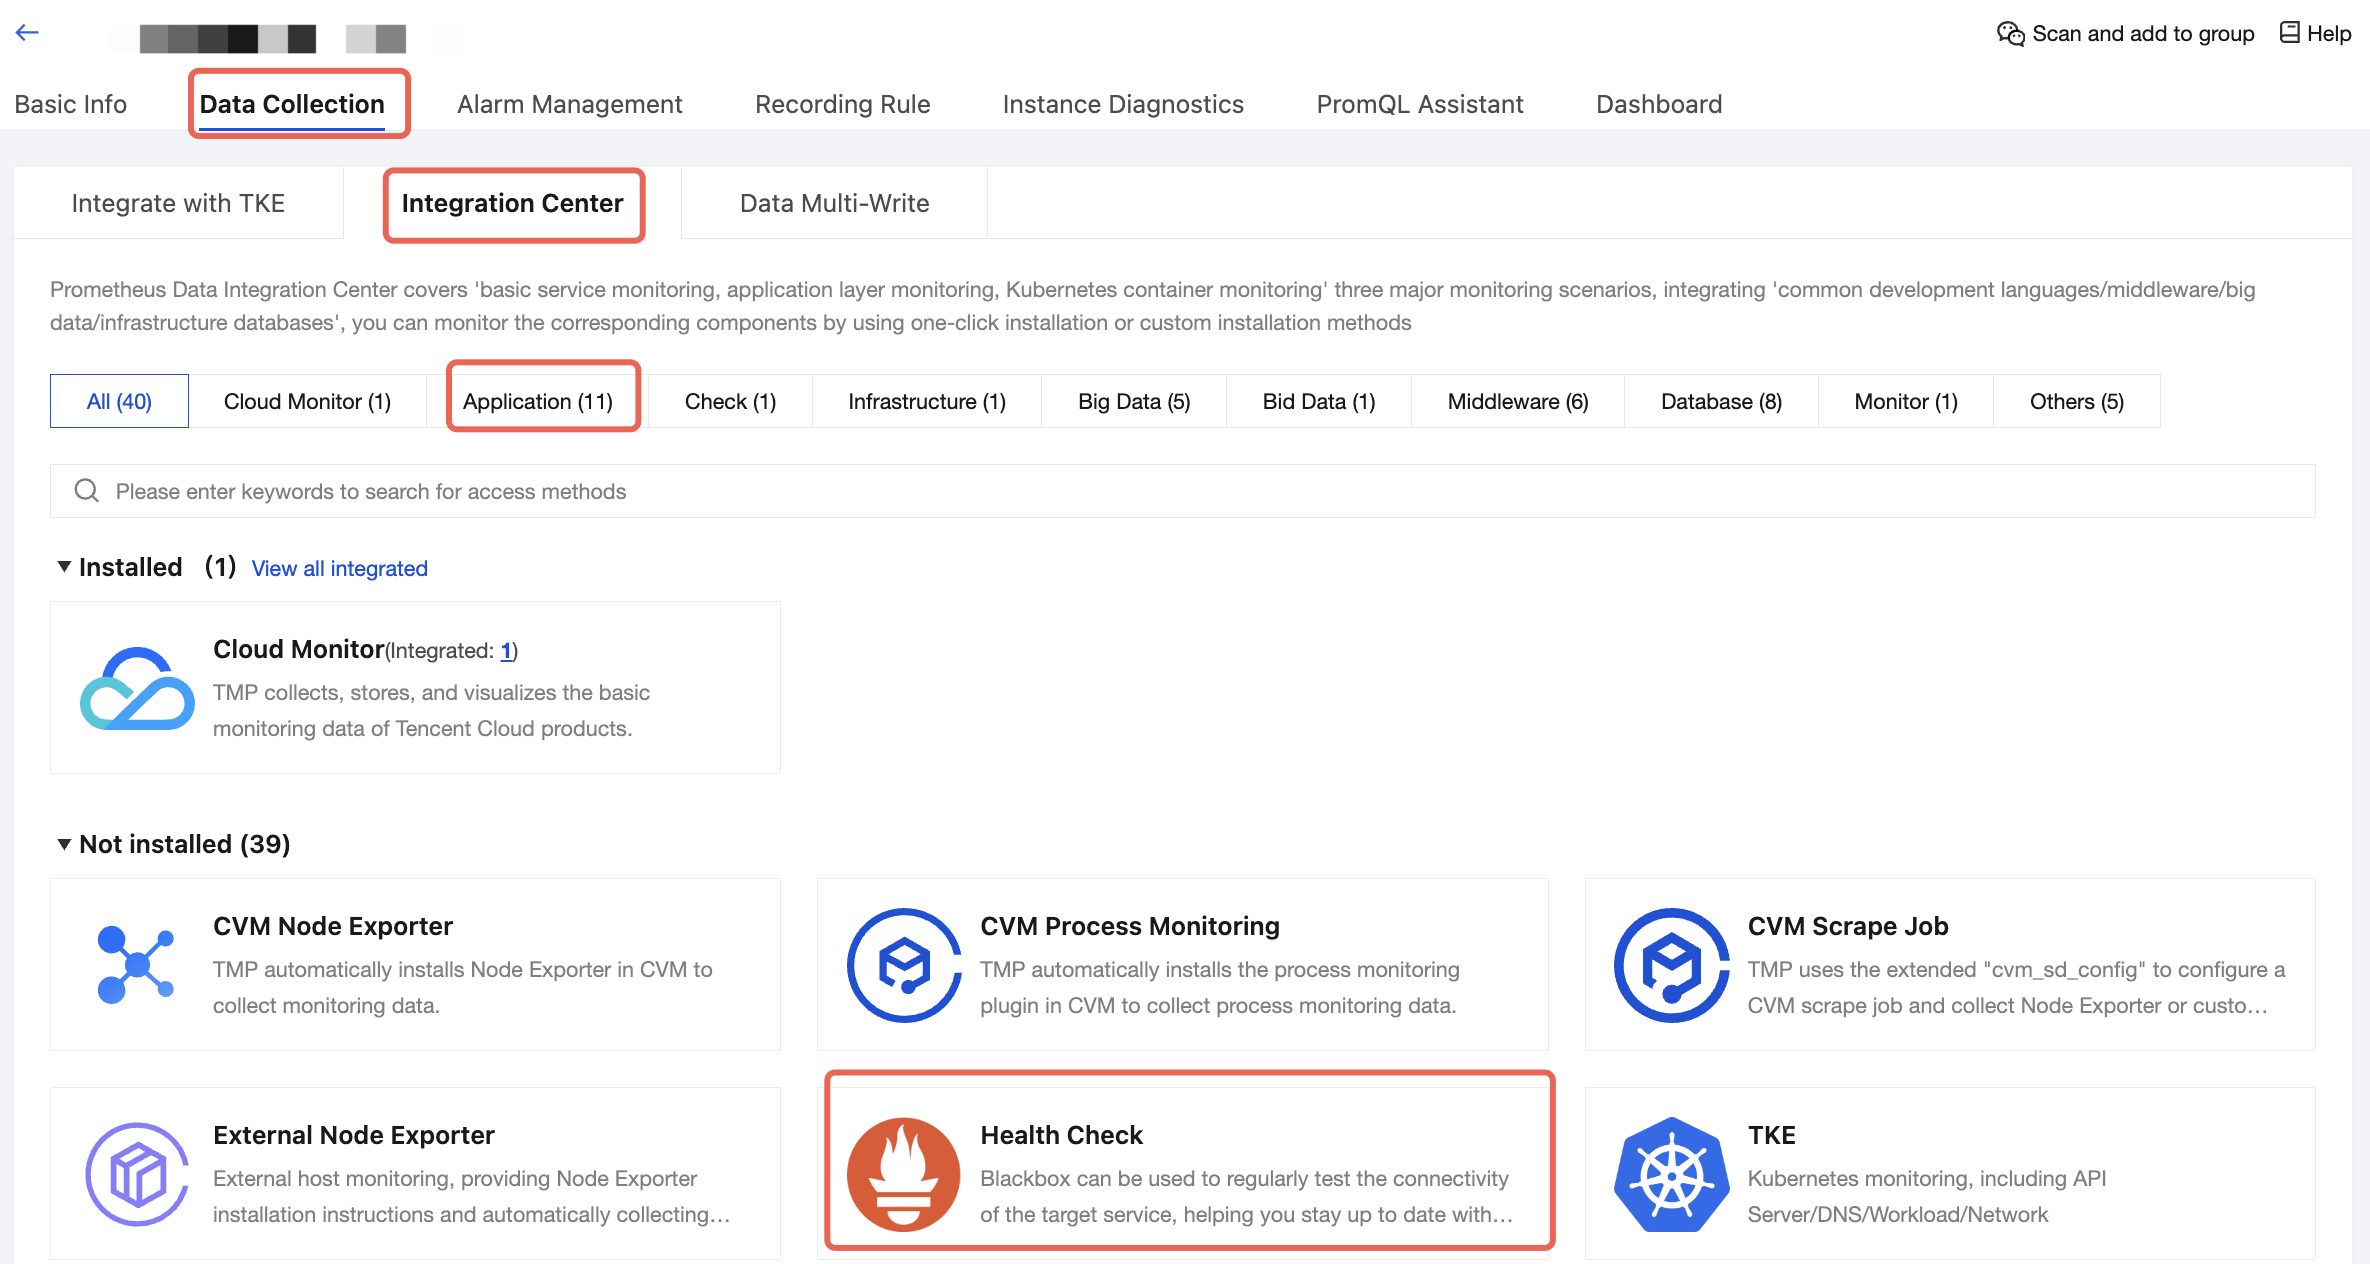
When a TMP instance is created, ensure that the bound VPC network and subnet are consistent with the vpcId and subnetId in Step 1. Otherwise, network connectivity issues occur. 2. In the instance list, click a TMP instance to go to the instance details page. Choose Data Collection > Integration Center, click Application, and find and click Scrape Tasks.
3. In the pop-up scrape task drawer, specify the collection configuration as shown in the sample code below, and click Save.
Configure based on the major categories of metrics you need to collect. jmx-exporter and node-exporter are supported.
jmx-exporter configuration example:
job_name: broker-jmx-exporter
scrape_interval: 10s
metrics_path: /metrics
static_configs:
- targets:
- 10.0.x.x:60001
- 10.0.x.x:60003
- 10.0.x.x:60005
- 10.0.x.x:60007
labels:
application: broker-jmx
node-exporter configuration example:
job_name: broker-node-exporter
scrape_interval: 10s
metrics_path: /metrics
static_configs:
- targets:
- 10.0.x.x:60002
- 10.0.x.x:60004
- 10.0.x.x:60006
- 10.0.x.x:60008
labels:
application: broker-node
4. On the Scrape Tasks page, click the Integrated tab. Wait 2–3 minutes, and you can see that the operation status changes to Deployed. In the Targets column, you can view specific data scraping objects. Click Metric Details to view the scraped broker metrics.

