tencent cloud

Tencent Kubernetes Engine

Release Notes and Announcements
Release Notes
Announcements
Release Notes
Product Introduction
Overview
Strengths
Architecture
Scenarios
Features
Concepts
Native Kubernetes Terms
Common High-Risk Operations
Regions and Availability Zones
Service Regions and Service Providers
Open Source Components
Purchase Guide
Purchase Instructions
Purchase a TKE General Cluster
Purchasing Native Nodes
Purchasing a Super Node
Getting Started
Beginner’s Guide
Quickly Creating a Standard Cluster
Examples
Container Application Deployment Check List
Cluster Configuration
General Cluster Overview
Cluster Management
Network Management
Storage Management
Node Management
GPU Resource Management
Remote Terminals
Application Configuration
Workload Management
Service and Configuration Management
Component and Application Management
Auto Scaling
Container Login Methods
Observability Configuration
Ops Observability
Cost Insights and Optimization
Scheduler Configuration
Scheduling Component Overview
Resource Utilization Optimization Scheduling
Business Priority Assurance Scheduling
QoS Awareness Scheduling
Security and Stability
TKE Security Group Settings
Identity Authentication and Authorization
Application Security
Multi-cluster Management
Planned Upgrade
Backup Center
Cloud Native Service Guide
Cloud Service for etcd
TMP
TKE Serverless Cluster Guide
TKE Registered Cluster Guide
Use Cases
Cluster
Serverless Cluster
Scheduling
Security
Service Deployment
Network
Release
Logs
Monitoring
OPS
Terraform
DevOps
Auto Scaling
Containerization
Microservice
Cost Management
Hybrid Cloud
AI
Troubleshooting
Disk Full
High Workload
Memory Fragmentation
Cluster DNS Troubleshooting
Cluster kube-proxy Troubleshooting
Cluster API Server Inaccessibility Troubleshooting
Service and Ingress Inaccessibility Troubleshooting
Common Service & Ingress Errors and Solutions
Engel Ingres appears in Connechtin Reverside
CLB Ingress Creation Error
Troubleshooting for Pod Network Inaccessibility
Pod Status Exception and Handling
Authorizing Tencent Cloud OPS Team for Troubleshooting
CLB Loopback
API Documentation
History
Introduction
API Category
Making API Requests
Elastic Cluster APIs
Resource Reserved Coupon APIs
Cluster APIs
Third-party Node APIs
Relevant APIs for Addon
Network APIs
Node APIs
Node Pool APIs
TKE Edge Cluster APIs
Cloud Native Monitoring APIs
Scaling group APIs
Super Node APIs
Other APIs
Data Types
Error Codes
TKE API 2022-05-01
FAQs
TKE General Cluster
TKE Serverless Cluster
About OPS
Hidden Danger Handling
About Services
Image Repositories
About Remote Terminals
Event FAQs
Resource Management
Service Agreement
TKE Service Level Agreement
TKE Serverless Service Level Agreement
Contact Us
Glossary

Audit Logs

PDF
Mode fokus
Ukuran font
Terakhir diperbarui: 2024-12-23 15:29:48
Note:
From now to June 30, 2022, users are exempt from CLS service fees incurred by audit log/event data generated by TKE for auto-created log topics. For details, see Note on Free Log Storage for TKE Audit and Event Center.

Introduction

Cluster audit is a feature based on Kubernetes Audit that can store and search the records of kube-apiserver JSON logs to generate configurable policies. This feature records the access events of kube-apiserver and records the activities of each user, admin, or system component that has an impact on the cluster in sequence.

Advantages

The cluster audit feature provides a different cluster monitoring dimension from metrics. After cluster audit is enabled, Kubernetes can record the log of every audit operation on the cluster. An audit log is a structured record in JSON format and consists of three parts: metadata, requestObject, and responseObject. The metadata (containing request context information, such as who initiated the request, where it was initiated, and the accessed URI) component is required, whereas requestObject and responseObject are optional, depending on the audit level. You can obtain the following information from logs:
Activities that occur in the cluster
Activity occurrence times and objects
Activity triggering times, triggering positions, and observation points
Activity results and subsequent processing

Reading the audit log

{
"kind":"Event",
"apiVersion":"audit.k8s.io/v1",
"level":"RequestResponse",
"auditID":0a4376d5-307a-4e16-a049-24e017******,
"stage":"ResponseComplete",
// What happened?
"requestURI":"/apis/apps/v1/namespaces/default/deployments",
"verb":"create",
// Who initiated the request?
"user":{
"username":"admin",
"uid":"admin",
"groups":[
"system:masters",
"system:authenticated"
]
},
// Where was it initiated?
"sourceIPs":[
"10.0.6.68"
],
"userAgent":"kubectl/v1.16.3 (linux/amd64) kubernetes/ald64d8",
// What happened?
"objectRef":{
"resource":"deployments",
"namespace":"default",
"name":"nginx-deployment",
"apiGroup":"apps",
"apiVersion":"v1"
},
// What is the result?
"responseStatus":{
"metadata":{
},
"code":201
},
// Request and response details
"requestObject":Object{...},
"responseObject":Object{...},
// When did it start/end?
"requestReceivedTimestamp":"2020-04-10T10:47:34.315746Z",
"stageTimestamp":"2020-04-10T10:47:34.328942Z",
// Reason for accepting/rejecting the request
"annotations":{
"authorization.k8s.io/decision":"allow",
"authorization.k8s.io/reason":""
}
}

TKE Cluster Audit Policies

Audit levels (levels)

Unlike common logs, the level of a Kubernetes audit log is more like a verbose configuration, which is used to indicate the degree of detail of the recorded information. There are four audit levels, as described in the following table:
Parameter
Description
None
Nothing is recorded
Metadata
The metadata of the request (for example, the user, time, resources, and operation) is recorded, excluding the message bodies of the request and response
Request
The metadata and request message body are recorded, excluding the response message body
RequestResponse
All information is recorded, including the metadata and the message bodies of the request and response

Audit stages (stages)

Logs can be recorded at different stages, as described in the following table:
Parameter
Description
RequestReceived
The log is recorded when the request is received
ResponseStarted
The log is recorded after the message header of the response is sent. This parameter is applicable only to persistent connection requests, such as watch.
ResponseComplete
The log is recorded after the response is fully sent
Panic
The request is not completed due to an internal server error

TKE audit policies

By default, TKE records audit logs when receiving requests. For most operations, audit logs of the RequestResponse level are recorded, except for the following cases:
For get, list, and watch, logs of the Request level are recorded.
For requests of secrets resources, configmaps resources, or tokenreviews resources, logs of the Metadata level are recorded.
Logs will not be recorded for the following requests:
Requests sent by system:kube-proxy for monitoring endpoints resources, services resources, or services/status resources.
get requests sent by system:unsecured for configmaps resources in the kube-system namespace.
get requests sent by kubelet for nodes resources or nodes/status resources.
get requests sent by any identity in system:nodes for nodes resources or nodes/status resources.
get and update requests sent by system:kube-controller-manager, system:kube-scheduler, or system:serviceaccount:endpoint-controller for endpoint resources in the kube-system namespace.
get requests sent by system:apiserver for namespaces resources, namespaces/status resources, or namespaces/finalize resources.
Requests sent to URLs that match /healthz*, /version, or /swagger*.

Directions

Enabling cluster audit

Note:
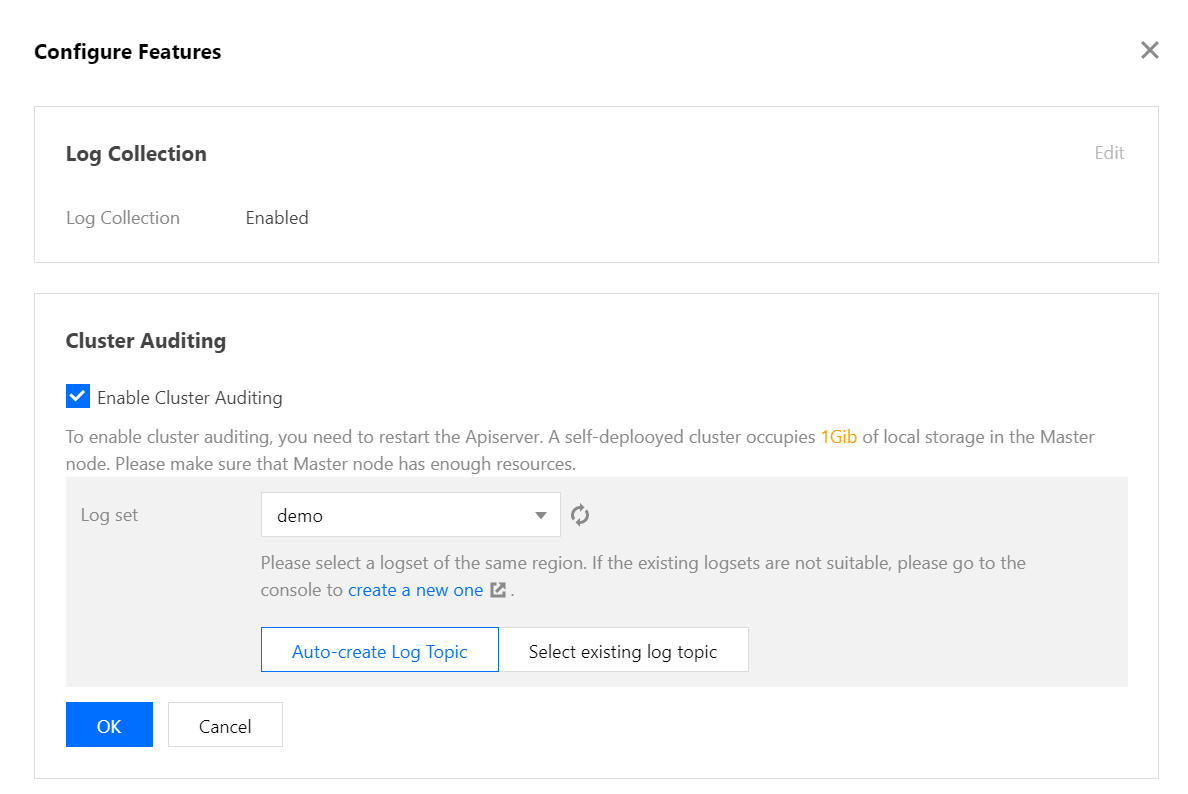
To enable the cluster audit feature, you need to restart kube-apiserver. We recommend that you do not frequently enable and disable the feature.
A self-deployed cluster consumes about 1 GB of local storage on the master node. Therefore, ensure that the storage of the master node is sufficient.
1. Log in to the TKE console.
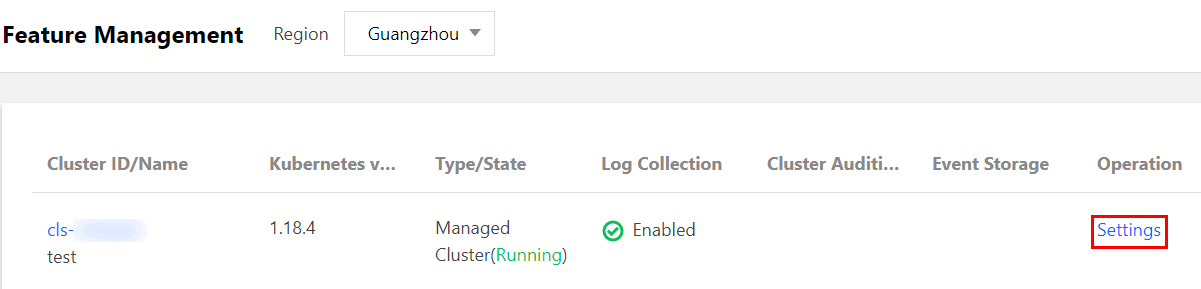
2. Choose Cluster OPS > Feature Management in the left sidebar to go to the Feature Management page.
3. At the top of the "Feature Management" page, select the region. Click Set for the cluster that you want to enable cluster audit, as shown in the figure below:

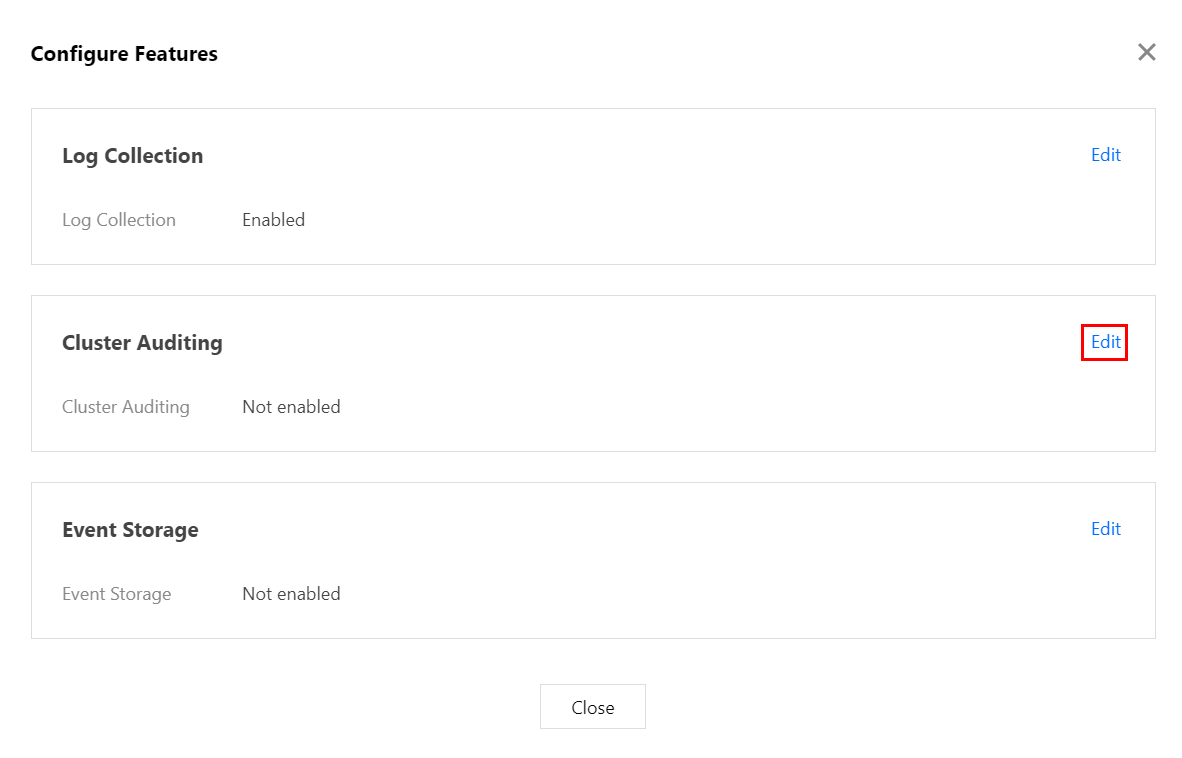
4. In the "Configure a Feature" window that appears, click Edit for the "Cluster Audit" feature.

5. Select Enable Cluster Audit and select the logset and log topic for storing audit logs. We recommend that you select Automatically Create a Log Topic.

6. Click OK to enable the cluster audit feature.

Bantuan dan Dukungan

Apakah halaman ini membantu?

masukan