This document describes how to configure monitoring collection items for the associated cluster.
Prerequisites
Before configuring monitoring collection items, you need to perform the following operations:
Create a TMP instance.
Associate the desired clusters with the TMP instance.
How It Works
Configuring data collection
1. Log in to the TKE console and click TMP in the left sidebar.
2. On the instance list page, select an instance name that needs to configure data collection rules to go to its details page.
3. On the Cluster monitoring page, click Data collection on the right of the instance to enter the collection configuration list page.
4. On the Data collection page, click Custom monitoring and add the data collection configuration. TMP has preset some collection configuration files to collect regular monitoring data. You can configure new data collection rules to monitor your business data by using the following two methods:
Adding data collection configuration via the console
Adding data collection configuration via yaml
Monitoring a service
1. Click Add.
2. In the Create collection policy pop-up window, enter the configuration information.
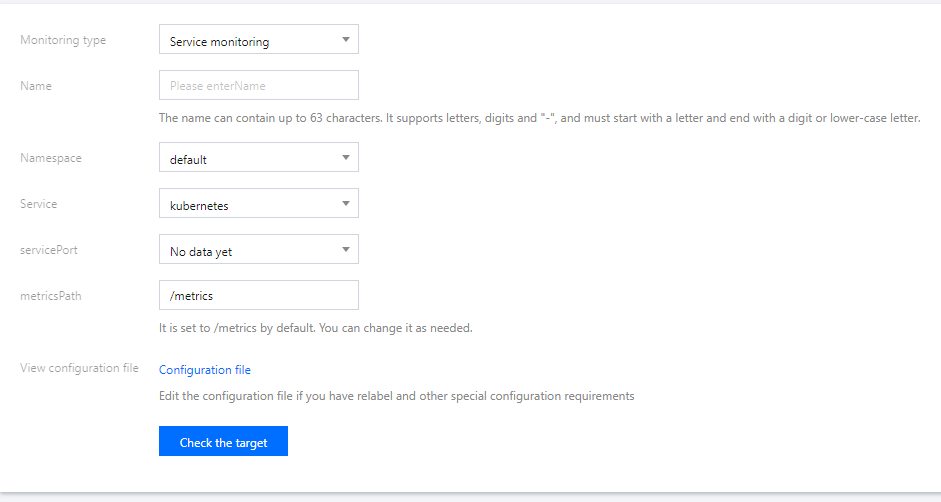
Monitoring type: Select Service monitoring.
Name: enter the rule name.
Namespace: select the namespace to which the Service belongs.
Service: select the service to be monitored.
ServicePort: select the corresponding port.
MetricsPath: defaults to /metrics. You can directly enter the collection API as needed.
View configuration file: Click Configuration file to view the current configuration file. If you have special configuration requirements such as relabel, you can edit them in the configuration file.
Check the target: Click Check the target to view a list of all targets that can be collected under the current collection policy, and confirm whether the collection policy meets your expectations.
Monitoring a workload
1. Click Add.
2. In the Create collection policy pop-up window, enter the configuration information.
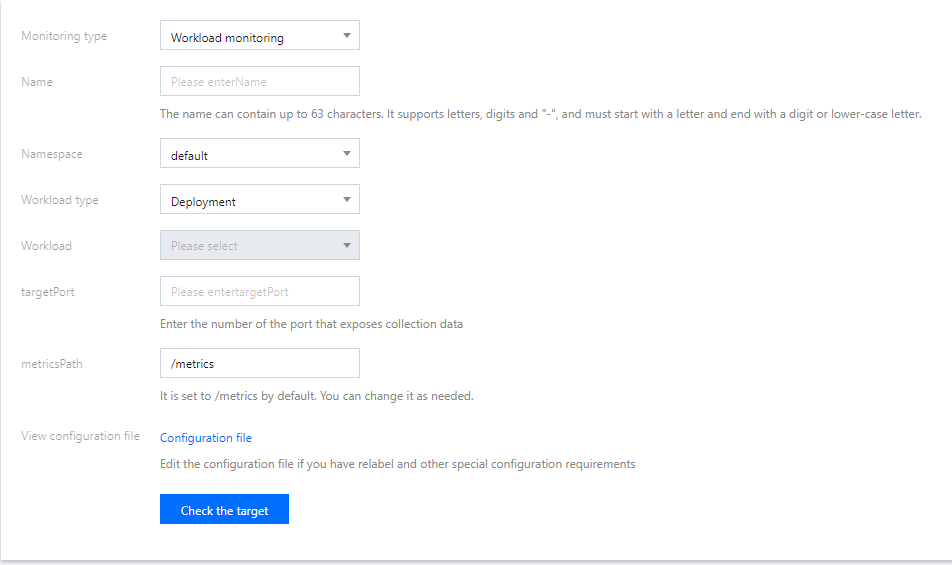
Monitoring type: Select Workload monitoring.
Name: enter the rule name.
Namespace: select the namespace to which the workload belongs.
Workload type: Select the workload type to be monitored.
Workload: select the workload to be monitored.
targetPort: enter the target port that exposes the collection metrics through which the collection target can be found. If the port is incorrect, the collection target will not be obtained correctly.
MetricsPath: defaults to /metrics. You can directly enter the collection API as needed.
View configuration file: Click Configuration file to view the current configuration file. If you have special configuration requirements such as relabel, you can edit them in the configuration file.
Check the target: Click Check the target to view a list of all targets that can be collected under the current collection policy, and confirm whether the collection policy meets your expectations.
1. Click Add via YAML.
2. In the pop-up window, select the monitoring type and enter the relevant configurations. Here takes Add PodMonitors as an example.
You can refer to the use methods in the community to submit the corresponding yaml to complete the data collection configuration.
Workload monitoring: The corresponding configuration is PodMonitors.
Service monitoring: The corresponding configuration is ServiceMonitors.
RawJobs monitoring: The corresponding configuration is RawJobs.
5. Click OK.
6. You can view the status of the collection target on the Data collection page of the instance.
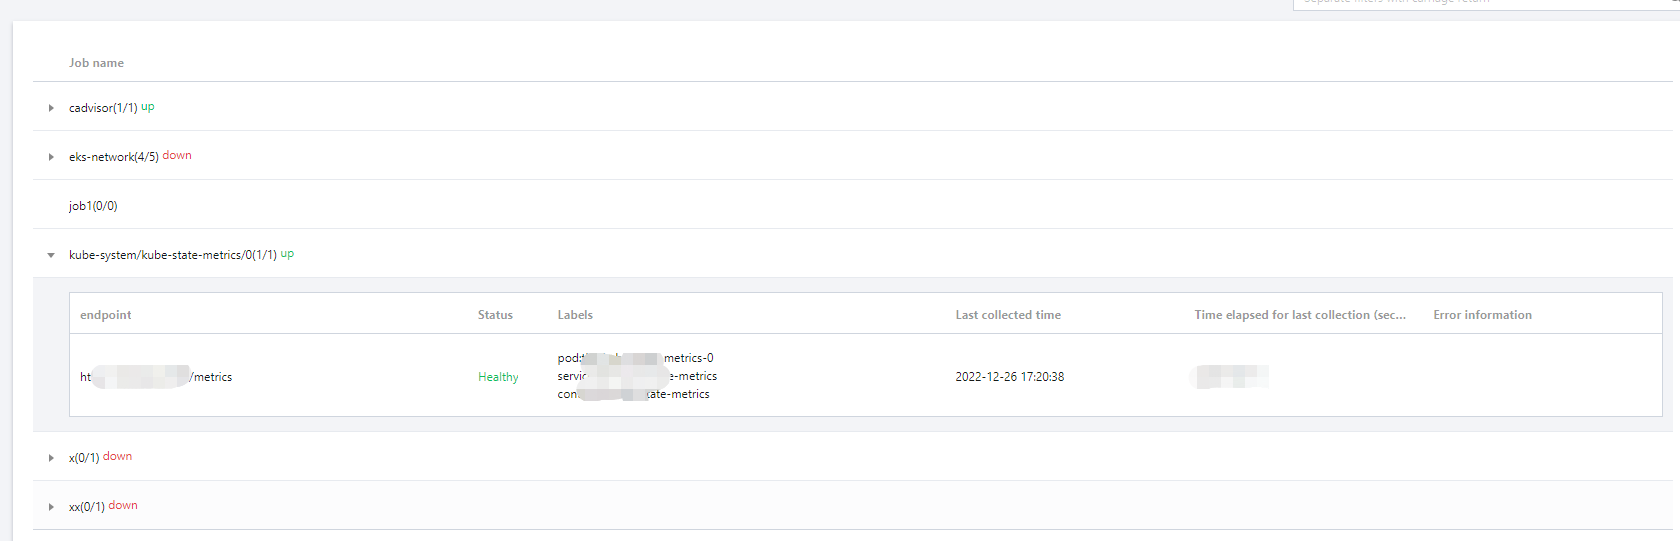
targets (3/3) indicates three actually captured targets/three checked collection targets. When the number of actual captured targets equals to the number of checked targets, the status will be "up", which means that the current capture is normal. When the number of actual captured targets is less than the number of checked targets, the status will be "down", which means that some endpoints capture failed.
Click the field value (3/3) to view the details of the collection target. The "down" status is as follows:
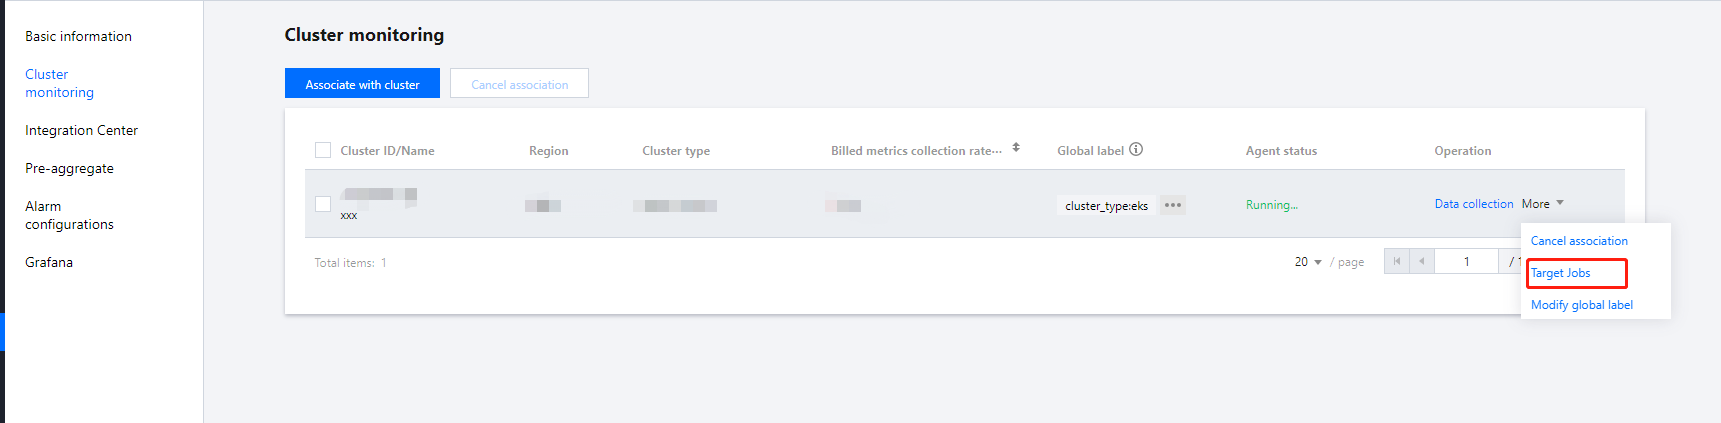
On the Cluster monitoring tab of the instance, click More > Target Jobs on the right of the cluster name to view all the collection targets of this cluster.
Viewing configuration
Note:
To view the configured YAML files, you can use only Custom Monitoring but not Basic Monitoring. All data collection configurations of the basic monitoring are productized, and you only need to click/select metrics to add/remove them.
1. Log in to the TKE console and click TMP in the left sidebar.
2. On the instance list page, select an instance name that needs to configure data collection rules to go to its details page.
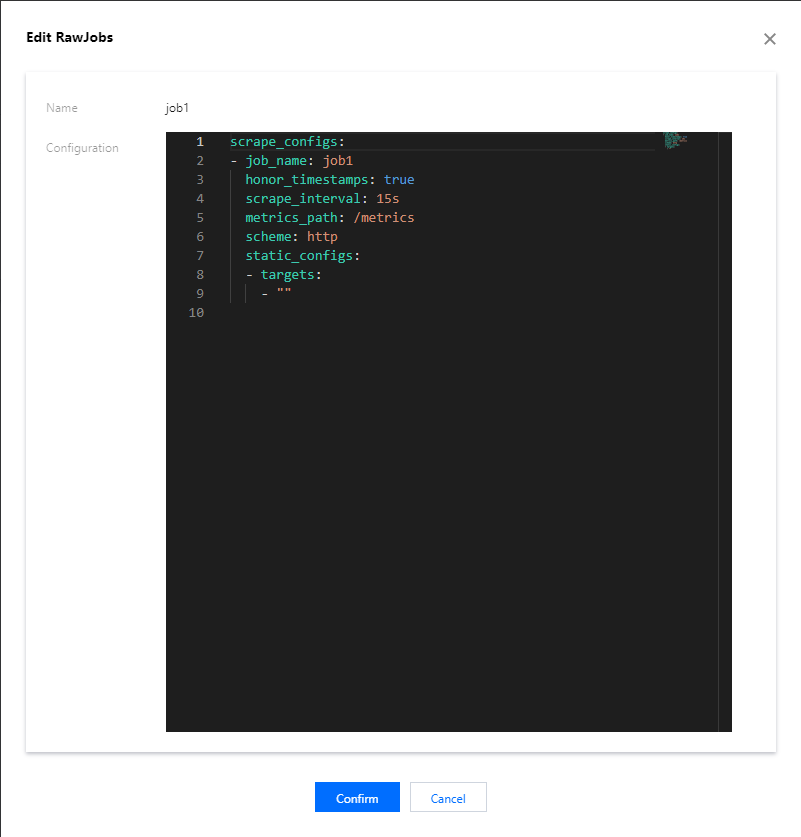
3. On the Cluster Monitoring page, select the Associate with Cluster tab and click Data Collection on the right of the instance to enter the data collection page. Select Custom Monitoring and click Edit on the right.
4. In the Edit RawJobs pop-up window, view all monitoring metrics configured in the YAML file.
Viewing collection targets
1. Log in to the TKE console and click TMP in the left sidebar.
2. On the instance list page, select an instance name that needs to view Targets and go to its details page.
3. On the Cluster monitoring page, click More > Target Jobs in the Operation column.
4. On the targets list page, view the collection status of current data.
Note:
The endpoints in the status of "Unhealthy" are displayed at the top of the list by default.
You can search the target by the resource attributes in the collection target page.
More
Mounting the file to the collector
When configuring the collection item, if you need to provide some files for the configuration, such as a certificate, you can mount the file to the collector in the following way, and the update of the file will be synchronized to the collector in real time.
prometheus.tke.tencent.cloud.com/scrape-mount = "true"
Add the above label to the configmap under the prom-xxx namespace, and all the keys will be mounted to the collector path /etc/prometheus/configmaps/[configmap-name]/.
prometheus.tke.tencent.cloud.com/scrape-mount = "true"
Add the above label to the secret under the prom-xxx namespace, and all the keys will be mounted to the collector path /etc/prometheus/secrets/[secret-name]/.