Overview
This document describes how to view scaling records of node pools, which can help you:
See traffic changes in business and configure node pools to more efficiently meet demands.
See expenditures to manage costs more efficiently.
See the reasons for scaling failures to manage risks. For example, scale-out may fail because all resources in a region are sold out.
Note:
When multiple node pools exist, Cluster Autoscaler (CA) selects a proper node pool for scaling. Global scaling records can be obtained based on CA events.
If you are only interested in the scaling records of a specific node pool and do not care about the CA behavior, go to the node pool details page to view scaling records of this node pool.
Prerequisites
You have opened the "Node pool list" page. For more information, please see Viewing a Node Pool. Directions
Viewing global scaling records
The community open-source component CA stores relevant information of each scaling activity under a specific pod or node as a Kubernetes event. However, Kubernetes events are stored in the backend for only 1 hour by default. If you want to query and review the scaling records of a node pool, we recommend that you enable event persistence to persistently store Kubernetes events.
Enabling event persistence
2. Choose Cluster OPS > Feature Management in the left sidebar to go to the Feature Management page.
3. At the top of the Feature Management page, select a region. Click Set next to the cluster for which you want to enable event persistence, as shown in the figure below.
4. In the Configure Features window that appears, click Edit next to the Event Storage feature.
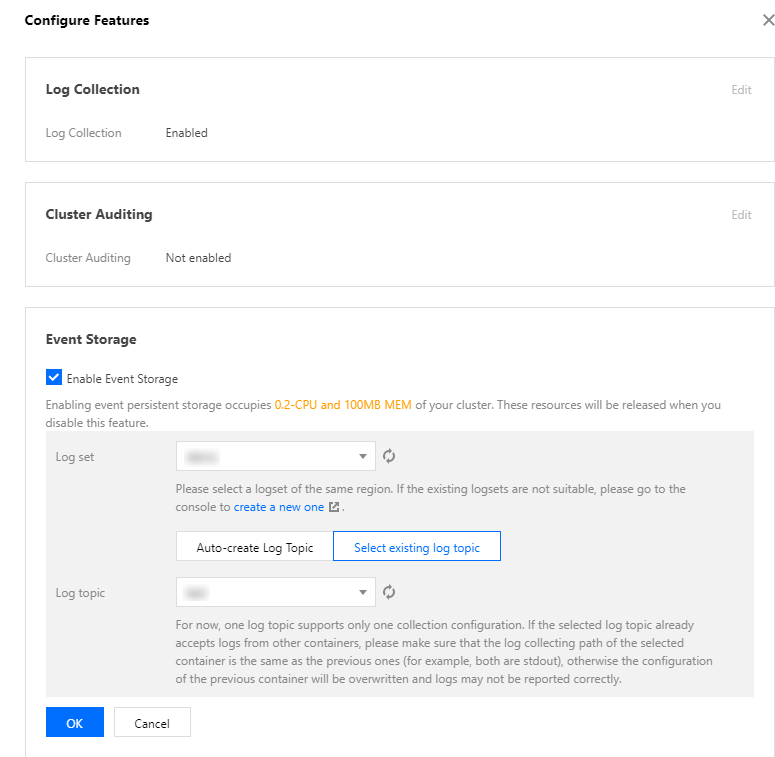
5. Select Enable Event Storage and select the logset and log topic for event persistence, as shown in the figure below.
6. Click OK.
Querying event persistence
2. Click Search and Analyze in the left sidebar to go to the Search and Analyze management page.
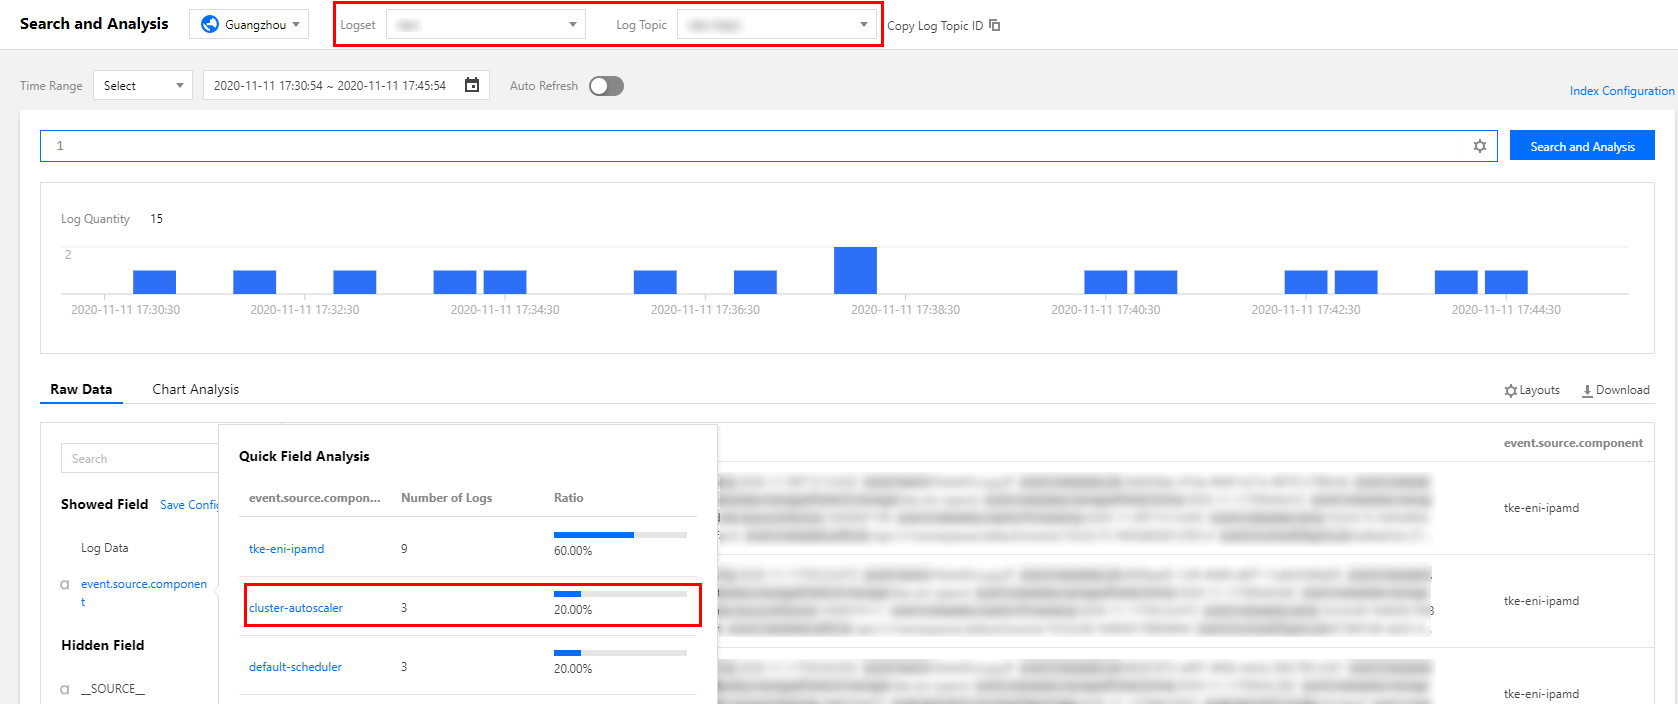
3. At the top of the Search and Analyze page, select a region and select the event persistence logset and log topic that you want to view.
4. Select event.source.component:cluster-autoscaler and click Search and Analyze, as shown in the figure below.
5. Configure data columns in Column Settings on the right and visualize the desired columns, as shown in the figure below.
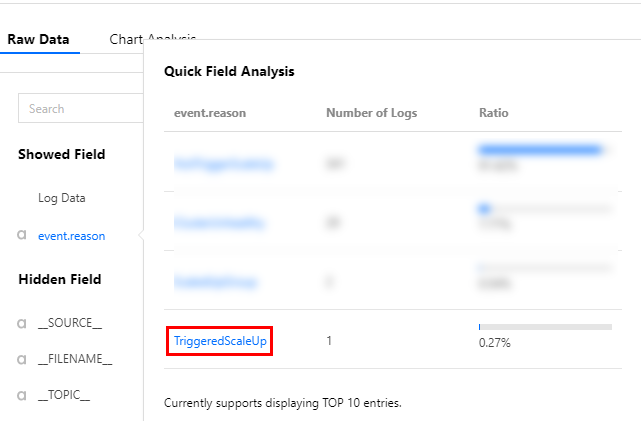
Specify an event type. For example, if you only want to view scale-out events, select TriggeredScaleUp for the search, as shown in the figure below.
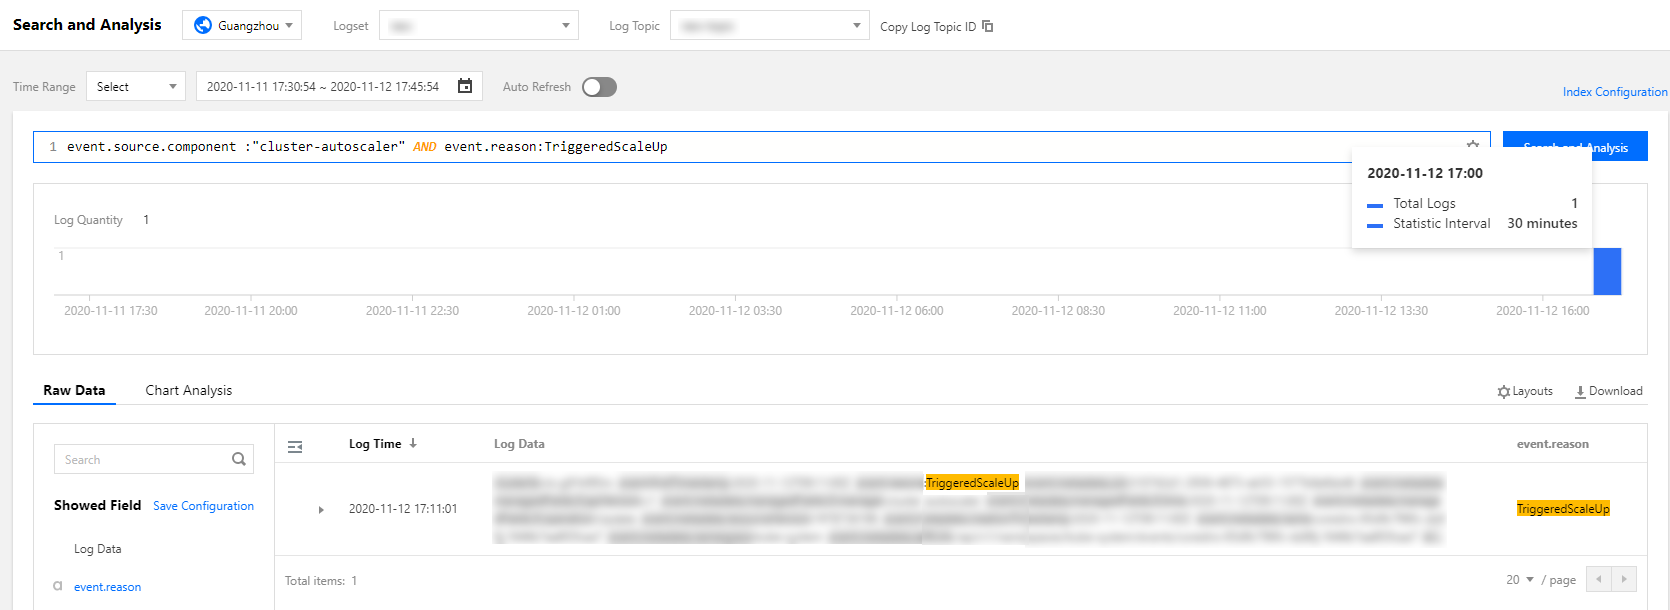
6. The scaling log querying result (including all node pool scale-out logs) is as follows:
Search guide
You can refer to the following documents to view a more detailed scaling activity list:
For CA scaling events, the value of the Reason field may be any of the following: TriggeredScaleUp, NotTriggerScaleUp, ScaledUpGroup, FailedToScaleUpGroup, ScaleDown, ScaleDownFailed, and ScaleDownEmpty. For more information, see Detailed Field Description. Querying scaling logs of a specific node pool
1. Log in to the TKE console and click Cluster in the left sidebar. 2. On the Cluster Management page, click the desired cluster ID to open the Deployment page.
3. In the left sidebar, choose Node Management > Node Pool to open the Node Pool List page.
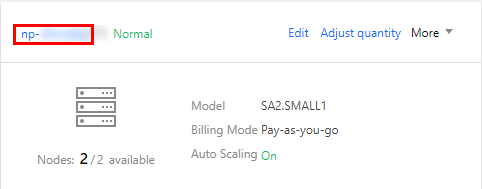
4. On the node pool page, click the desired node pool ID, as shown in the figure below.
5. On the node pool details page, click the Scaling Logs tab on the top, as shown in the figure below.
The scaling log fields are as follows: Activity ID: ID of a scaling activity.
Status: status of a scaling activity.
Description: description of a scaling activity, displaying the number of scale-out/scale-in nodes.
Activity Cause: causes for triggering a scaling activity.
Failure Cause: if a scaling activity fails, this column displays the causes of failure.
Start Time: time when a scaling activity starts, in seconds.
End Time: time when a scaling activity ends, in seconds.
References
For more information on the features and operations of node pools, please see the following documents:

