Compatible with the APIs of Prometheus and Grafana and the CRD usage of mainstream prometheus-operator, TKE Cloud Native Monitoring is more flexible and extensible. Combined with Prometheus open source tools, it can have more advanced usages.
This document describes how to use auxiliary scripts and migration tools to quickly migrate the self-built Prometheus to cloud native monitoring.
Prerequisites
You have installed Kubectl on the node of the self-built Prometheus cluster and configured Kubeconfig to ensure that you can manage the cluster through Kubectl.
Directions
Migrating the Dynamic Collection Configuration
If the prometheus-operator is used in self-built Prometheus, CRD resources such as ServiceMonitor and PodMonitor are usually used to dynamically add collection configurations. This method also applies to cloud native monitoring. If you only need to migrate the prometheus-operator of the self-built Prometheus cluster to cloud native monitoring, and without migrating the cluster, then there is no need to migrate the dynamic configuration. You only need to use the cloud native monitoring to associate the self-built cluster, and then the ServiceMonitor and PodMonitor resources created by the self-built Prometheus will automatically take effect in cloud native monitoring.
For cross-cluster migration, you can export the CRD resources of self-built Prometheus and selectively reapply them in the associated cloud native monitoring cluster. The following describes how to export ServiceMonitor and PodMonitor in batches in a self-built Prometheus cluster.
1. Create the script prom-backup.sh with the following contents:
kubectl -n ${_ns} get ${_type}${_item} -o yaml >${_file_name}
count=$[count + 1]
echo"Backup No.${count} file done."
done;
done;
done;
2. Run the following command to run the prom-backup.sh script.
bash prom-backup.sh
3. The prom-backup.sh script will export each ServiceMonitor and PodMonitor resource into a separate YAML file. You can run the ls command to view the output file list. The example is as follows:
4. You can filter, modify and reapply the YAML file to the associated cloud native monitoring cluster (do not apply the collection rules that already exist or have the same feature). The cloud native monitoring will automatically perceive these dynamic collection rules and perform collection.
Note:
If you need to add ServiceMonitor or PodMonitor, you can add it visually on the TKE console, or you can directly create it with YAML. The usage is fully compatible with the CRD of the Prometheus community.
Migrating the static collection configuration
If the self-built Prometheus system directly uses the Prometheus native configuration file, you can convert it into a RawJob of cloud native monitoring with a few steps on the TKE console, making it compatible with the scrape_configs configuration item of the Prometheus native configuration file.
2. Click Cloud Native Monitoring in the left sidebar to go to the Cloud Native Monitoring page.
3. Click the instance ID/name to configure to go to its basic information page.
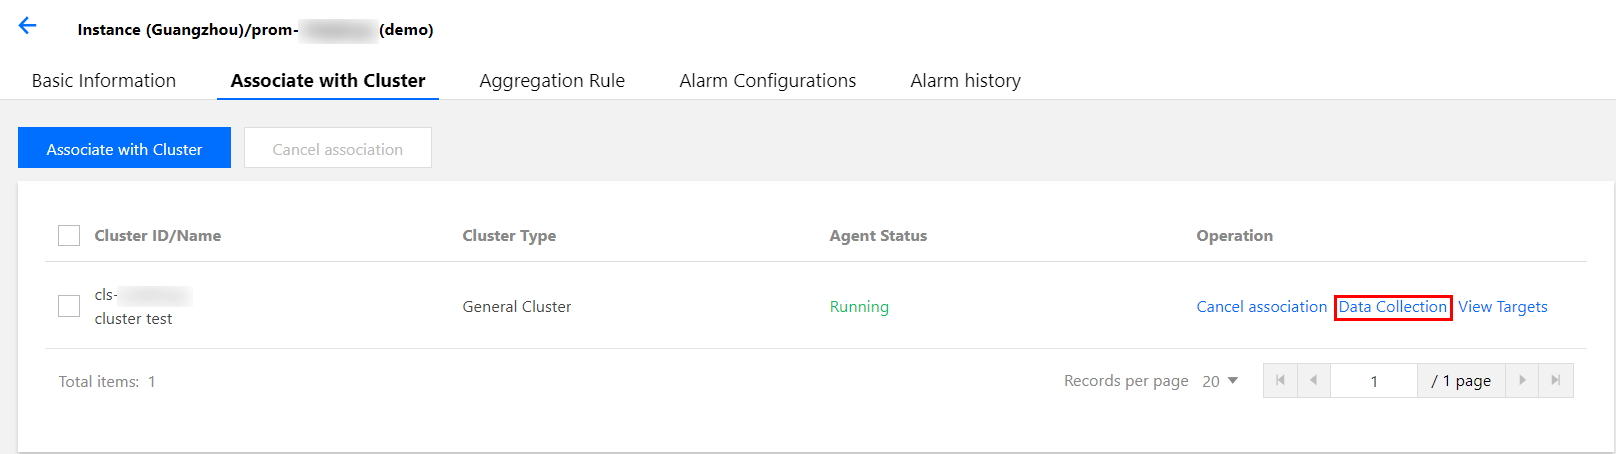
4. Select Associate with Cluster tab, select the cluster to configure, and click Data Collection under the Operation column.
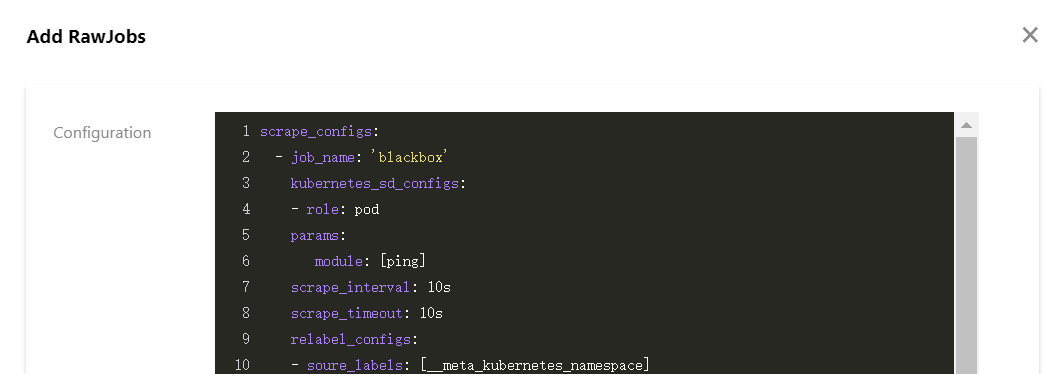
5. Select RawJob > Add. Copy and paste the Job configuration from the native Prometheus configuration file into this configuration window.
6. You can paste all the Job arrays that need to import into the cloud native monitoring, and click Confirm. The Job arrays will be automatically split into multiple RawJobs and named as the job_name field of each Job.
Migrating the global configuration
You can modify the Prometheus CRD resource of cloud native monitoring to modify the global configuration.
1. Run the following command to obtain the Prometheus information.
Modify the following parameters in the pop-up window:
scrapeInterval: the collection capture interval (default value is 15 seconds)
externalLabels: add the default label tag for all time series data.
Migrating the aggregation configuration
The format of each Prometheus aggregation configuration rule is the same no matter it is the original static configuration Recording rules or the dynamic configuration PrometheusRule.
2. Click Cloud Native Monitoring in the left sidebar to go to the Cloud Native Monitoring page.
3. Click the instance ID/name to configure to go to its basic information page.
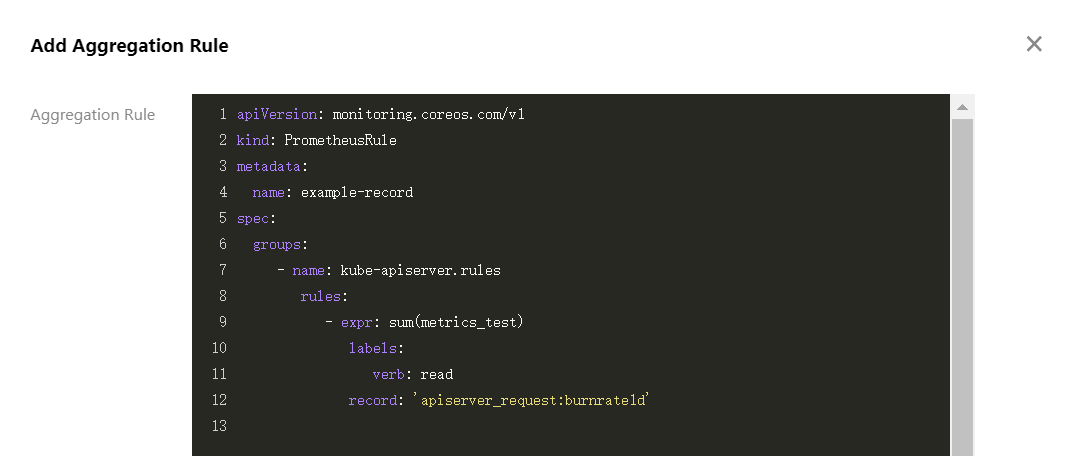
4. Select Aggregation Rule > Create Aggregation Rule. In the Add Aggregation Rule window, paste each rule into the groups array in the PrometheusRule format, as shown in the figure below:
Note:
If the self-built Prometheus uses the aggregation rules defined by PrometheusRule, it is recommended to migrate them according to the above steps. If the PrometheusRule resource is created directly in the cluster using YAML, it cannot be displayed in cloud native monitoring on the console currently.
Migrating the alarm configuration
This document provides the self-built Prometheus Alarm original configuration YAML file as an example to describe how to convert it into a monitoring configuration similar to cloud native monitoring.
2. Click Cloud Native Monitoring in the left sidebar to go to the Cloud Native Monitoring page.
3. Click the instance ID/name to configure to go to its basic information page.
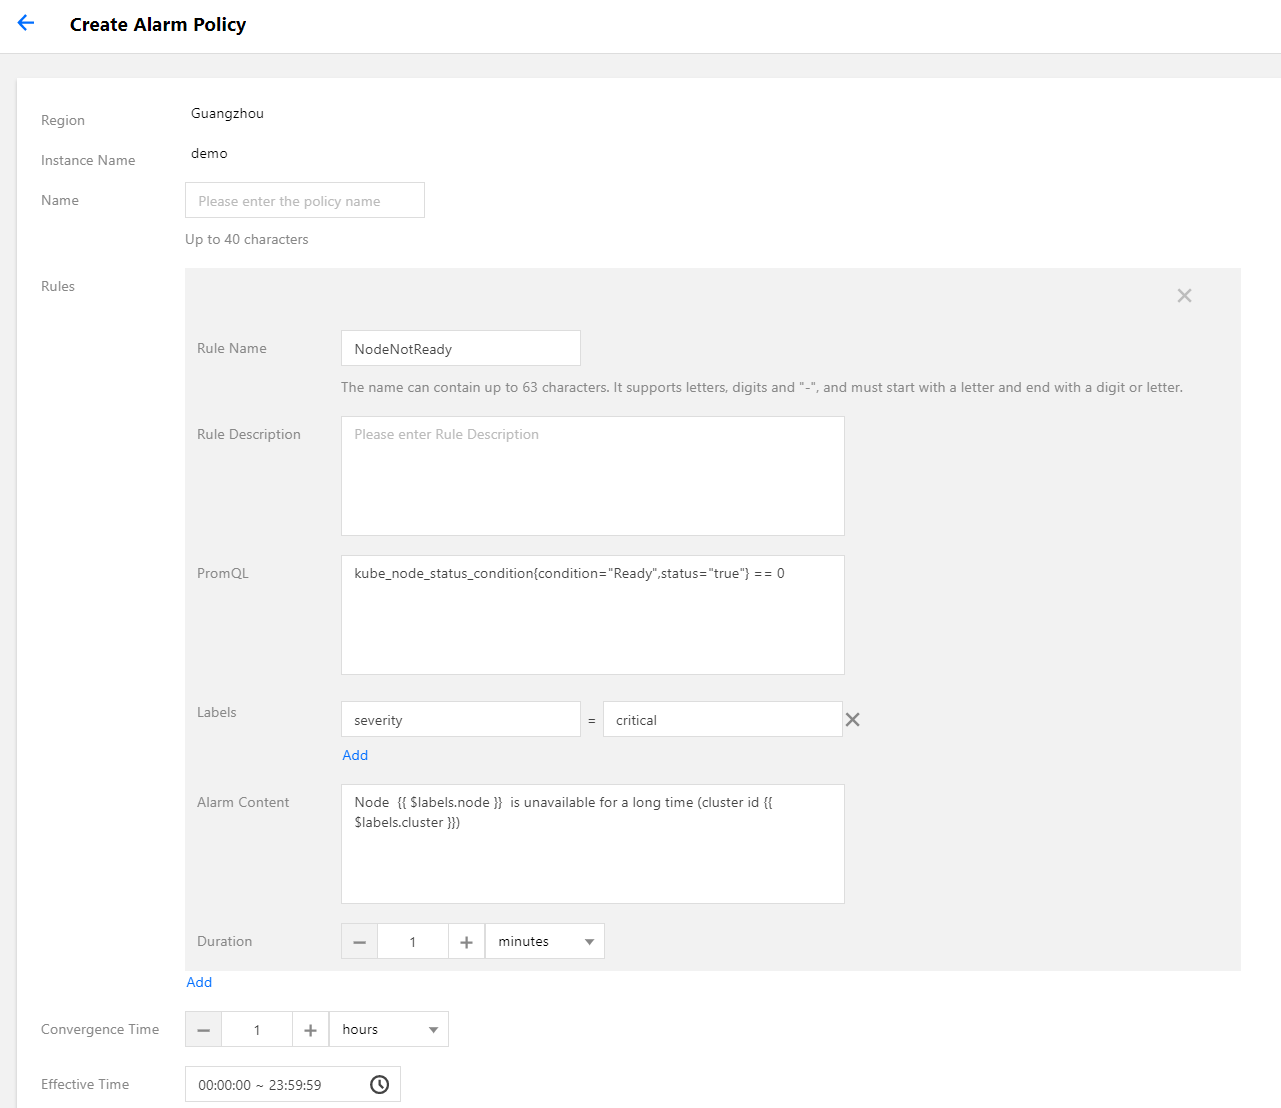
4. Select Alarm Configurations > Create Alarm Policy to configure the alarm policy.
Main parameters are described as follows:
PromQL: the core configuration of the alarm and is the PromQL expression used to indicate the alarm trigger condition, which is equivalent to the “expr” field of the original configuration.
Labels: an extra label added for the alarm, which is equivalent to the labels field of the original configuration.
Alarm Content: the pushed alarm content. You can use a template or a template with variables. It is recommended to add the cluster ID in the alarm content. You can use the variable {{ $labels.cluster }} to represent the cluster ID.
Duration: indicates an alarm will be pushed when the alarm is not restored after the alarm condition is met for how long. It is equivalent to the “for” field of the original configuration. The configuration in the following sample is 5 minutes.
Convergence Time: indicates an alarm will be pushed again when the alarm is not restored after the alarm condition is met for how long, that is, the push interval between the same alarms. It is equivalent to the repeat_interval configuration of AlertManager. The configuration in the following sample is 1 hour.
Note:
The above alarm configuration example shows that after the node status changes to NotReady, the alarm will be pushed if it is not restored within 5 minutes. If it has not restored for a long time, the alarm will be pushed again at an interval of 1 hour.
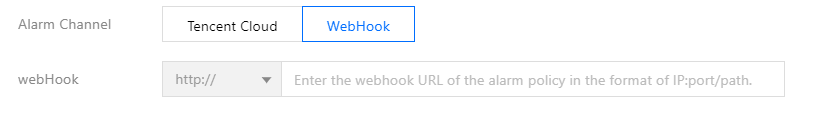
5. Configure the alarm channel. Currently, only Tencent Cloud and WebHook are available.
Tencent Cloud alarm channel
WebHook alarm channel
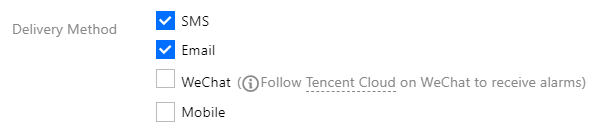
The alarm channels of Tencent Cloud support SMS, Email, WeChat and Mobile. You can select as needed.
If you need to configure other alarm channels, such as DingTalk, Zoom, you can deploy the relevant WebHook backend by yourself, and specify the URL of the WebHook in the cloud native monitoring.
Migrating the Grafana dashboard
The self-built Prometheus is usually configured with many custom Grafana monitoring dashboards. If you need to migrate a large number of dashboards to other platforms, it is too inefficient to export and import one by one. You can use the grafana-backup tool to export and import Grafana dashboards in batches. For details, please refer to the following directions.
1. Run the following command to install grafana-backup, as shown below:
pip3 install grafana-backup
Note:
It is recommended to use Python3 to avoid the compatibility problems.
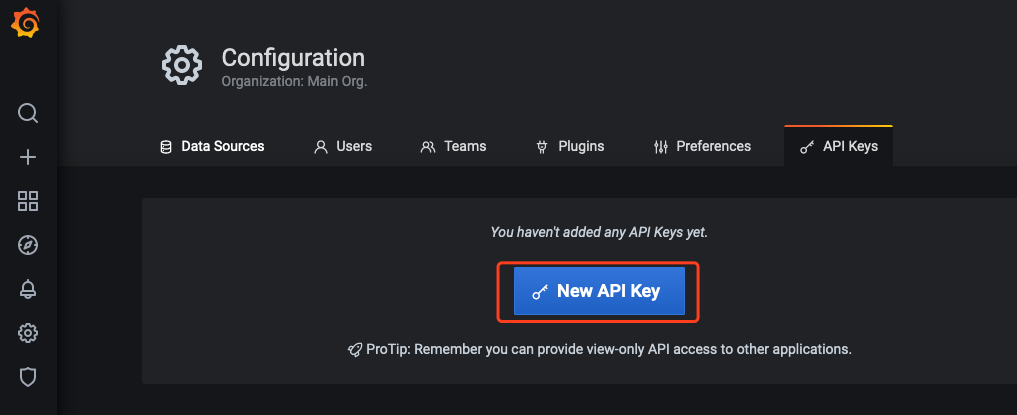
2. Create API Keys.
2.1 Enter the configuration page of self-buit Grafana and cloud native monitoring Grafana respectively. Select API Keys > New API Key, as shown below:
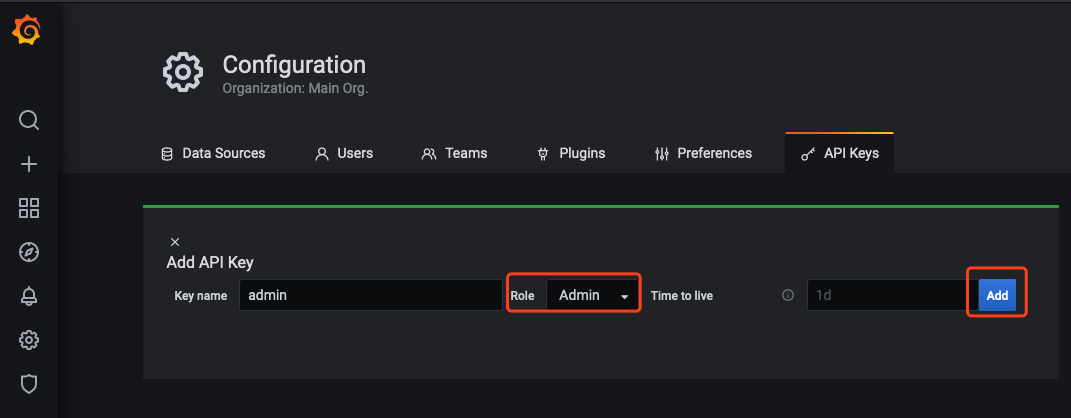
2.2 In Add API Key window, create an API KEY whose role is Admin, as shown below:
3. Back up the configuration file of the dashboard that you want to export.
3.1 Run the following command to obtain the access address of the self-built Grafana, as shown below:
Take the Grafana access address http://172.21.254.127:3000 in the cluster as an example.
3.2 Run the following command to generate the grafana-backup configuration file (with Grafana address and APIKey) as shown below:
exportTOKEN=<TOKEN>
cat> ~/.grafana-backup.json <<EOF
{
"general": {
"debug": true,
"backup_dir": "_OUTPUT_"
},
"grafana": {
"url": "http://172.21.254.127:3000",
"token": "${TOKEN}"
}
}
EOF
Note:
You need to replace <TOKEN> with the APIKey of self-built Grafana, and replace the URL with the actual environment address.
4. Run the following command to export all dashboards, as shown below:
grafana-backup save
The dashboard will be saved as a compressed file in the _OUTPUT_ directory. You can run the following command to view the files in this directory, as shown below:
$ tree _OUTPUT_
_OUTPUT_
└── 202012151049.tar.gz
0 directories, 1file
5. Run the following command to restore the configuration file, as shown below:
You need to replace <TOKEN> with the APIKey of cloud native monitoring Grafana, and replace the URL with the access address of cloud native monitoring Grafana. (The internet access need to be enabled).
6. Run the following command to import the exported dashboards to the cloud native monitoring Grafana with one click, as shown below:
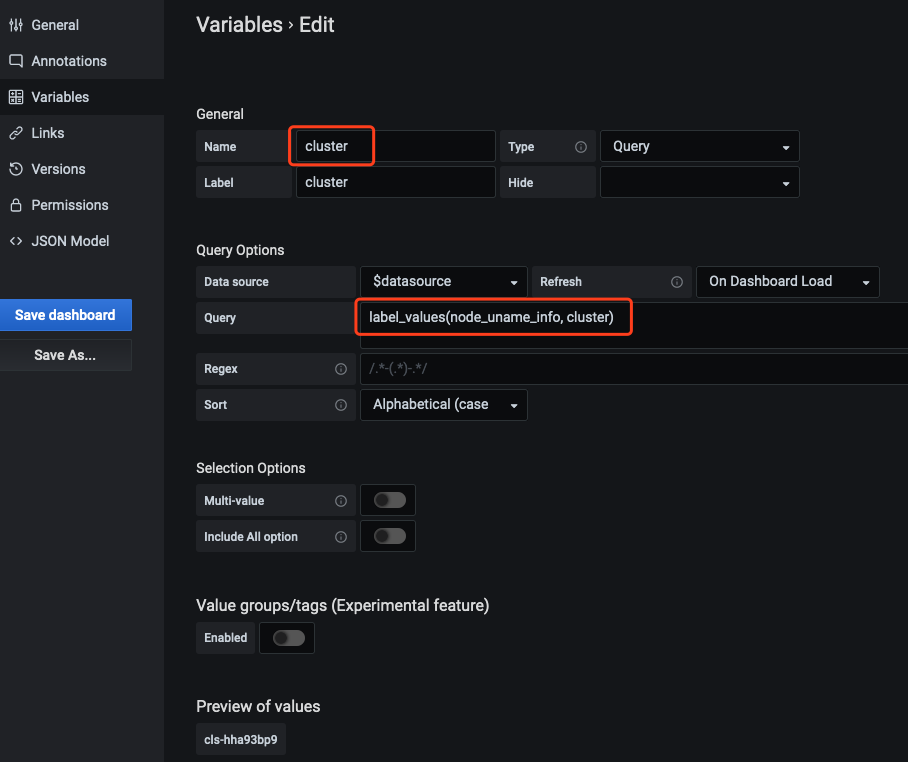
7. In Grafana configuration dashboard, select Dashboard settings > Variables > New to create the cluster field. It is recommended to add the filter field “cluster” for all dashboards. Cloud native monitoring supports multiple clusters. It will add the label “cluster” to the data of each cluster, and use the cluster ID to distinguish different clusters, as shown below:
Note:
Enter an arbitrary metric name that is involved in the current dashboard in label_values (The example is node_uname_info).
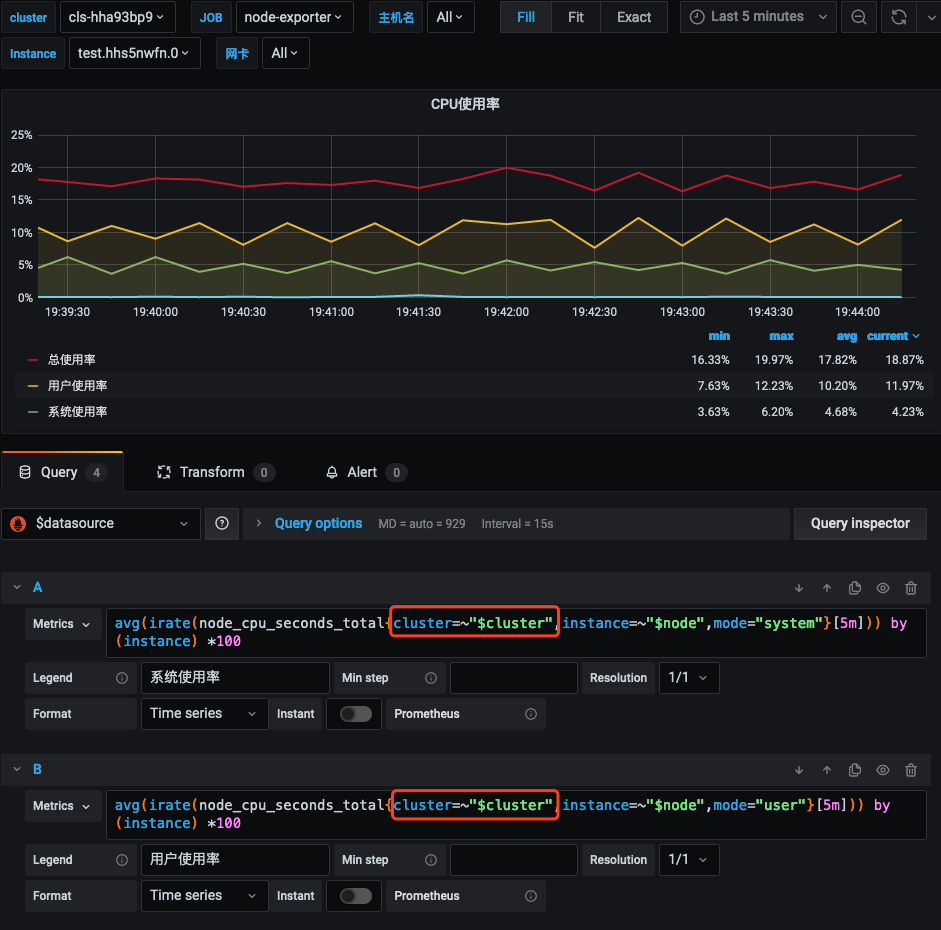
8. Modify the query statements of PromQL in all dashboards and add the filter conditions cluster=~"$cluster", as shown below:
Integrating with the existing systems
Cloud native monitoring supports accessing self-built Grafana and AlertManager systems.
Accessing self-built Grafana
Accessing self-built AlertManager
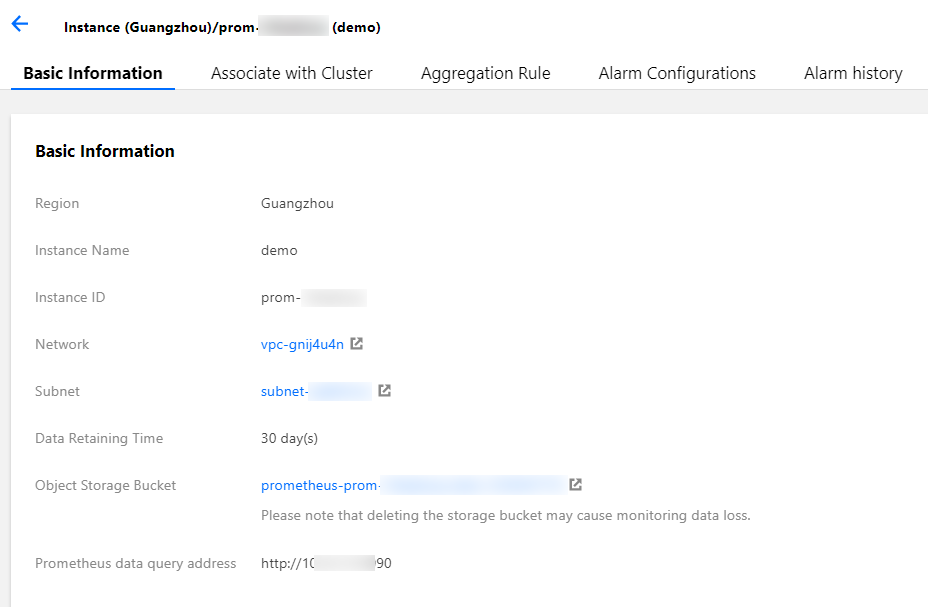
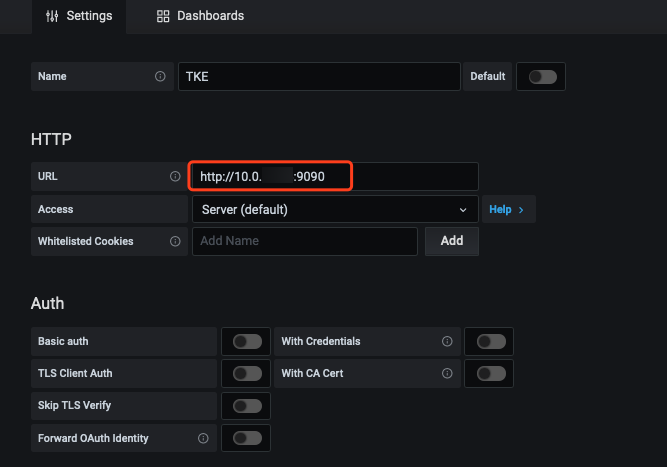
Cloud native monitoring provides Prometheus API. If you need to use self-built Grafana to display monitoring, you can add cloud native monitoring data as a Prometheus data source to self-built Grafana. You can find the Prometheus API address in the basic information of cloud native monitoring instance on TKE console.
2. Click Cloud Native Monitoring in the left sidebar to go to the Cloud Native Monitoring page.
3. Click the instance ID/name to go to its details page to obtain the Prometheus API address.
Note:
Ensure that the self-built Grafana and cloud native monitoring are in the same VPC or their networks have connected.
4. Add the Prometheus API address in Grafana as the Prometheus data source, as shown below:
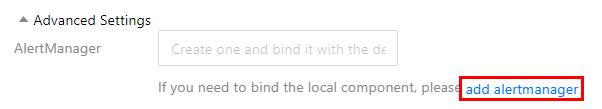
If you have more complex alarm requirements or want to use the self-built AlertManager for unified alarms, you can access the cloud-native monitoring alarms to the self-built AlertManager. You only need to enter the address of the self-built AlertManager in the advanced settings when [creating a monitoring instance](https://intl .cloud.tencent.com/document/product/457/38824), as shown in the figure below: