Use Cases
The cluster auditing and event storage features of TKE are configured with rich visual charts to display audit logs and cluster events in multiple dimensions. Their operations are simple, and most common cluster Ops use cases are covered, making it easy for you to find and locate problems, improve the Ops efficiency, and maximize the value of audit and event data.This document describes how to use audit and event dashboards to quickly locate cluster problems for several use cases.
Prerequisites
Example
Sample 1. Troubleshooting workload disappearance
2. Select Log Management > Audit Logs in the left sidebar to go to the Audit log search page.
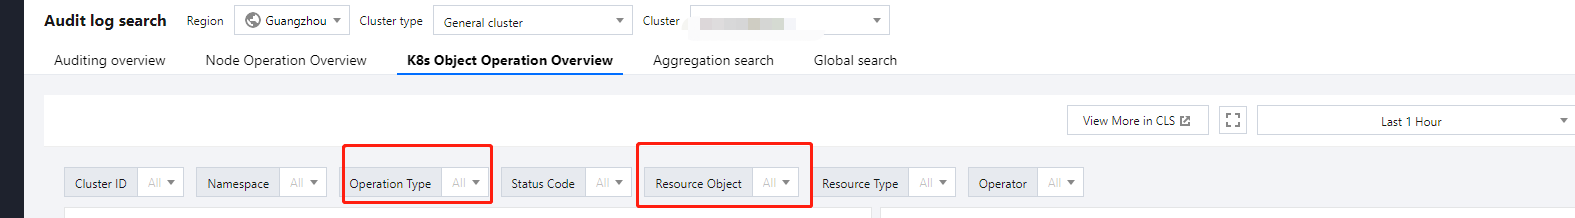
3. Select the K8s Object Operation Overview tab and specify the operation type and resource object to be checked in Filters as shown below:
4. The query result is displayed, as shown in the figure below:
As shown above, the 10001****7138 account deleted the nginx application at 2020-11-30T03:37:13. For more information on the account, select CAM > User List. Sample 2. Troubleshooting node cordoning
2. Select Log Management > Audit Logs in the left sidebar to go to the Audit log search page.
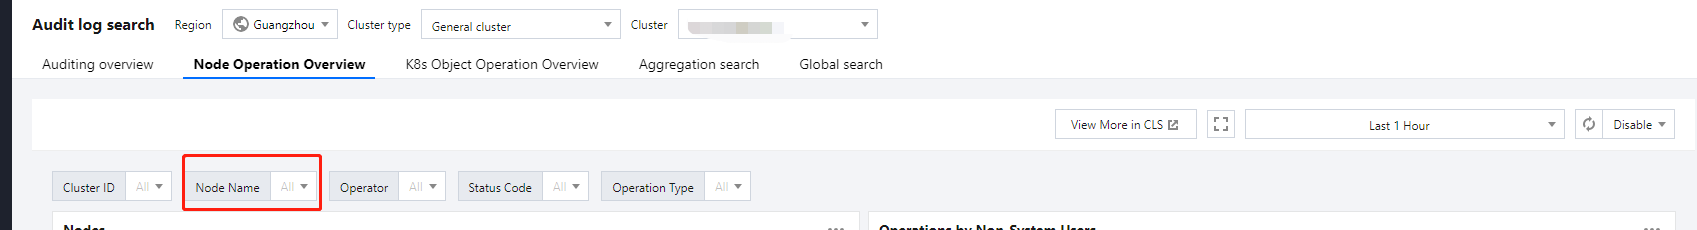
3. Select the Node Operation Overview tab and specify the name of the cordoned node in Filters as shown below:
4. Click Filter to start the query. The result is as shown below:
As shown in the above figure, account 10001****7138 cordoned the node 172.16.18.13 at 2020-11-30T06:22:18. Sample 3. Troubleshooting slow API server response
2. Select Log Management > Audit Logs in the left sidebar to go to the Audit log search page.
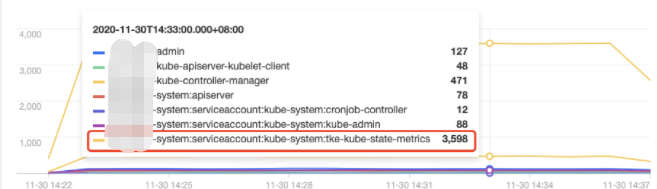
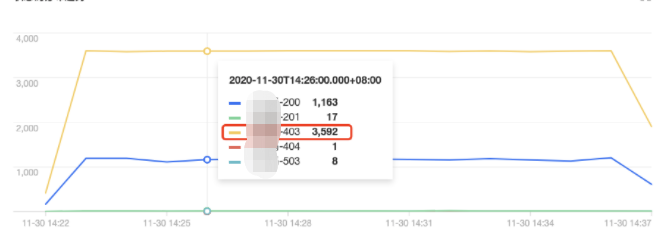
3. Select the Aggregated Search tab, which provides trend graphs of API server access requests in multiple dimensions, such as user, operation type, and return status code, as shown below: Operator distribution trend:
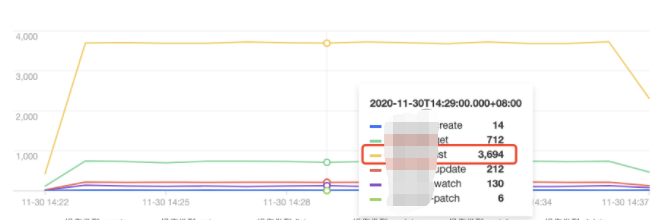
Operation type distribution trend:
Status code distribution trend
:
As shown above, the tke-kube-state-metrics user has much more access requests than others. The operation type distribution trend shows that most of the operations are LIST operations, and the status code distribution trend shows that most of the status codes are 403. The business logs show that the tke-kube-state-metrics add-on kept requesting API server retries due to the RBAC authentication issue, resulting in a sharp increase in API server access requests. Below is a sample log: E1130 06:19:37.368981 1 reflector.go:156] pkg/mod/k8s.io/client-go@v0.0.0-20191109102209-3c0d1af94be5/tools/cache/reflector.go:108: Failed to list *v1.VolumeAttachment: volumeattachments.storage.k8s.io is forbidden: User "system:serviceaccount:kube-system:tke-kube-state-metrics" cannot list resource "volumeattachments" in API group "storage.k8s.io" at the cluster scope
Sample 4. Troubleshooting a node exception
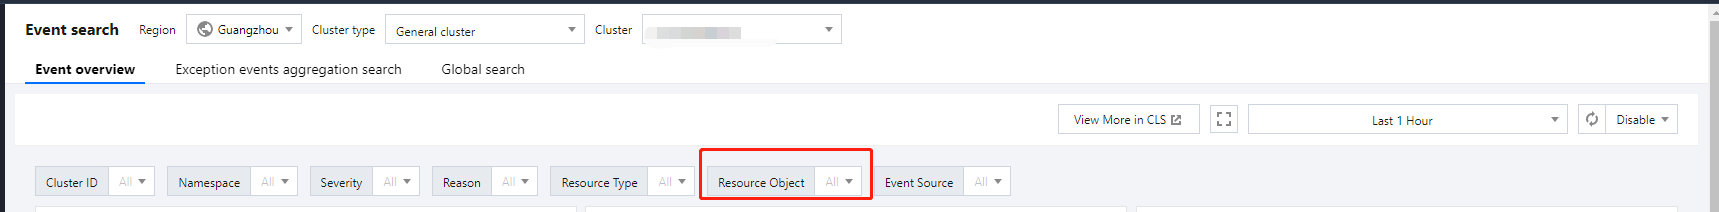
2. Select Log Management > Event Logs in the left sidebar to go to the Event search page.
3. Select the Event Overview tab and enter the abnormal node IP in the Resource Object filter as shown below:
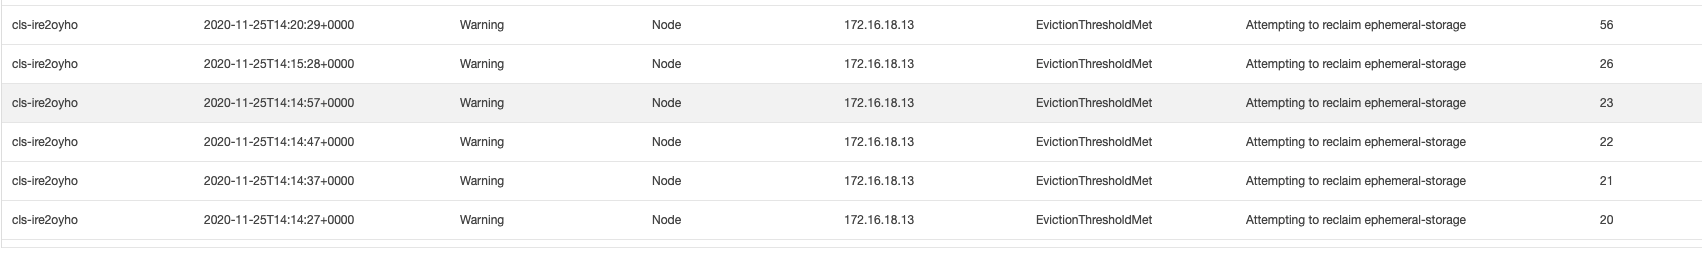
4. Click Filter to start the query. The results show that there is an event of Insufficient disk space of the node.
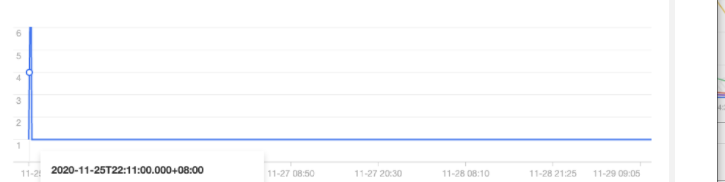
5. Click the event to further view the trend of the abnormal event.
As shown in the above figure, starting from 2020-11-25, the node 172.16.18.13 was exceptional due to insufficient disk space. Then kubelet began to drain pods on the node to reclaim the node's disk space. Sample 5. Locating a node scale-out trigger
The cluster auto-scaler (CA) add-on automatically increases or decreases the number of nodes in the cluster according to the load condition when node pool elastic scaling is enabled. If a node in the cluster is automatically scaled, you can backtrack the whole scaling process through event search.
2. Select Log Management > Event Logs in the left sidebar to go to the Event search page.
3. Select the Global Search tab and enter the following search command in the search box:
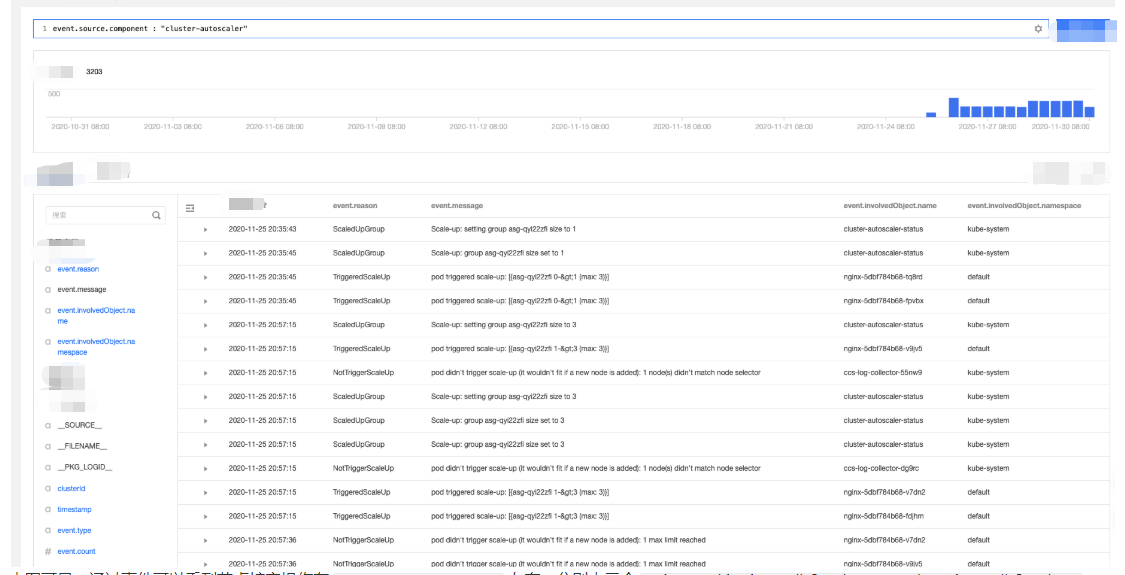
event.source.component : "cluster-autoscaler"
4. Select event.reason, event.message, and event.involvedObject.name from the Hidden Fields on the left for display. Click Search and Analysis and view the results.
5. Sort the search results by Log Time in reverse order as shown below:
According to the event flow in the above figure, you can find that the node scaling occurred around 2020-11-25 20:35:45 and was triggered by three Nginx pods (nginx-5dbf784b68-tq8rd, nginx-5dbf784b68-fpvbx, and nginx-5dbf784b68-v9jv5). After three nodes were scaled out, the subsequent scaling was not triggered because the number of nodes in the node pool reached the upper limit.